|
A fairly normal start to 2016 hydrologically changed direction drastically as the year progressed. The first few months of the year were characterized by generally normal winter and early spring rainfall with periodic bouts of minor riverine flooding. Rainfall in February produced minor flooding on portions of the Tombigbee, Black Warrior, Cahaba and Coosa Rivers, and again in mid-March on the Tombigbee and Sucarnoochee Rivers. Rainfall during the remainder of the spring was fairly typical of the season with only some minor flooding on the Upper Tombigbee River in mid-April.
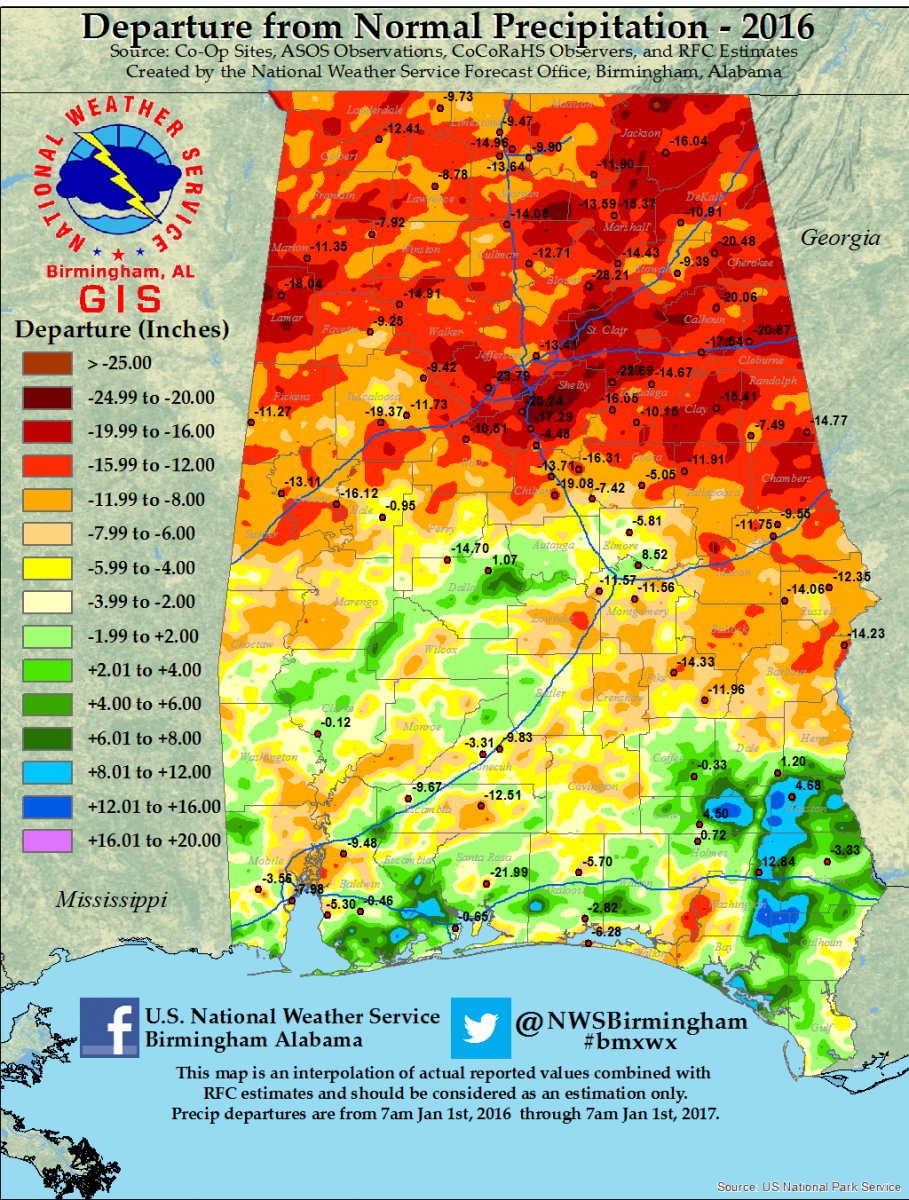
As we moved into the summer season, June brought below normal rainfall to much of the area, but was followed by more normal summertime rainfall in July, as typical summertime convection was observed. Moving into August, however, changes began. Drier conditions developed, and by the month’s end, moderate to severe drought had developed across the area. The dry pattern persisted into September, and the drought continued to slowly intensify. By mid-September, the driest conditions of the year developed across Central Alabama and continued until late November as persistent high pressure almost totally ended rainfall over the area. Some stations experienced over sixty consecutive days without measurable rainfall during this period, including sixty one consecutive days at the Birmingham Airport, sixty two days at Anniston and seventy one days at Tuscaloosa.
With this extremely dry pattern in place, and with much above normal temperatures for the time of year, extreme to exceptional drought rapidly developed and engulfed virtually all of Central Alabama by mid-November. Voluntary water restrictions were implemented in many areas, with mandatory water restrictions in places such as the greater Birmingham area. Agricultural interests were hard-hit, with many pastures and other crops suffering significant losses and cattle ponds and small streams drying up in many counties. The planting of many winter crops was either delayed or did not occur due to the extremely dry conditions. Numerous wildfires also occurred across the area. The Alabama State Forestry Commission reports that over eleven hundred wildfires burned over twenty thousand acres in Central Alabama during October and November.
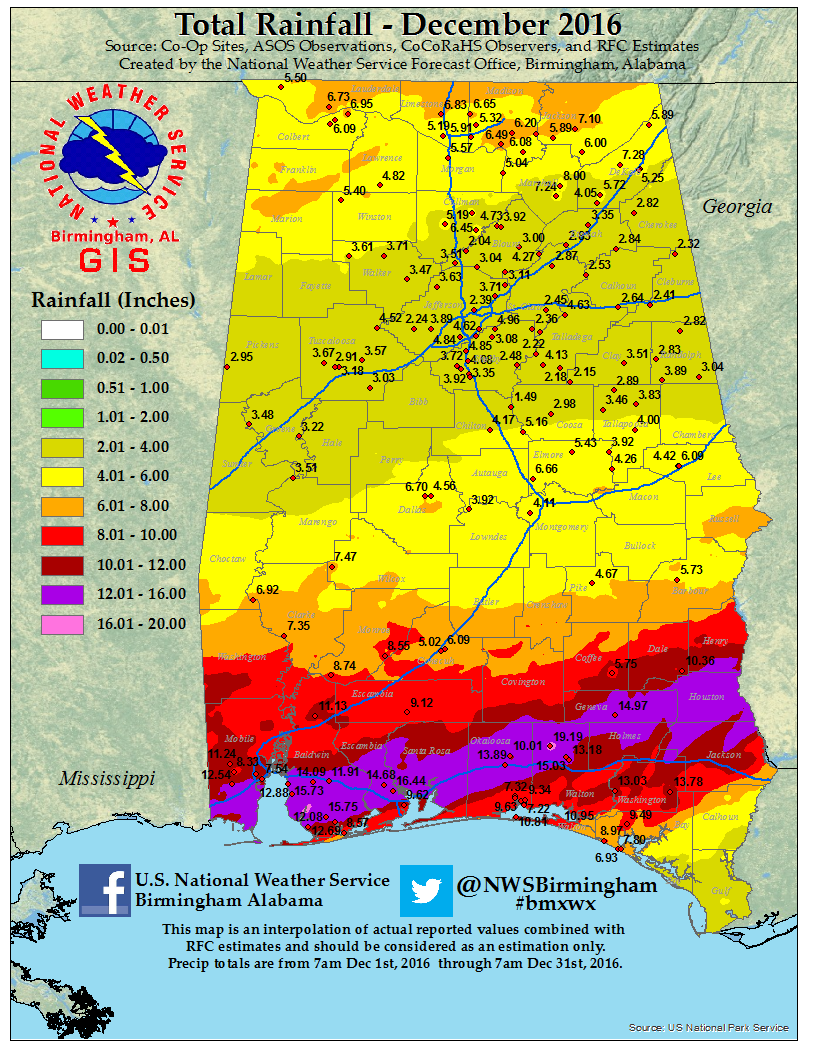
The dry conditions finally began to abate somewhat during the latter half of November as much needed rainfall finally returned to Central Alabama. The weather pattern in December continued to bring periodic rainfall to the area. However, despite the rainfall late in the year, most stream flows across the area in late December were still running below normal, and extreme to exceptional drought persisted across much of Central Alabama.
Below are the Drought Conditions each month in 2016
|