


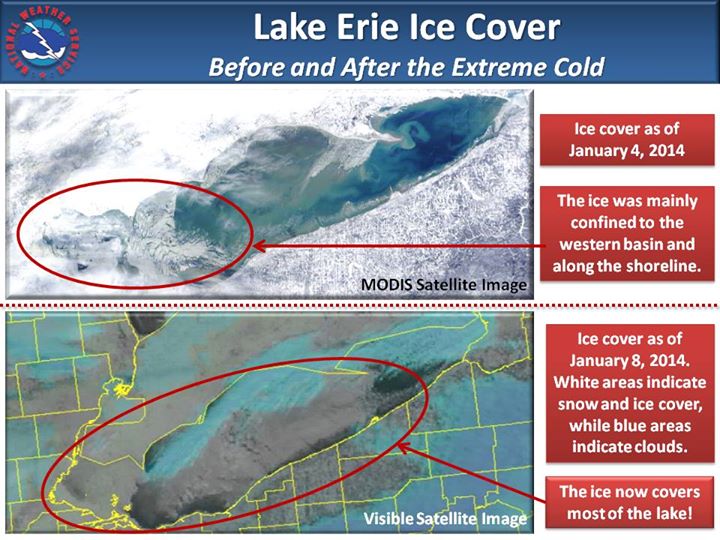
As we rang in the new year we were in the midst of what would turn out to be the coldest winter in 20 to 30 years!! While December 2013 was not too far from normal both in temperatures and snowfall statistics, the outbreaks of arctic air started in January. One such cold outbreak occurred on January 5th - 7th when night lows dipped below zero. Winds gusted to 30-35 MPH and this created a dangerous wind chill (-35 to -45 degrees) in which exposed skin would experience frostbite in a mere 10 minutes. New record lows were established at all of the major climate sites on both the 6th and the 7th. It was the coldest we had been since January of 1994. Lake Erie was nearly ice covered by January 8th. It took just 4 days as the lake was primed for a quick freeze. The below zero temperatures made that a reality. The cold was nearly continuous as we endured a northwest flow of air from Canada and the Arctic most of the winter. The pattern held strong and persistent snow cover helped contribute to and enhance the cold. All of the climate sites had one of their ten coldest February’s ever.
Click on each of the tabs below to show the tables on how the winter season '13-'14 made it into the record books. There were at least two cold related deaths in northern Ohio.
Snowfall Data for Winter 2013-’14:
|
Seasonal Snow (inches) |
Total |
Rank |
Normal |
Record/Year |
|---|---|---|---|---|
|
Toledo |
86.3 record |
1st |
37.6 |
Old record 73.1/1977-78 |
|
Mansfield |
65.3 |
7th |
48.3 |
91.0/1995-96 |
|
Cleveland |
86.1 |
8th |
68.1 |
117.9/2005-06 |
|
Akron-Canton |
69.9 |
7th |
47.5 |
82.0/1977-78 |
|
Youngstown |
90.1 |
4th |
62.7 |
118.7/2010-11 |
|
Erie, PA |
139.5 |
5th |
100.9 |
149.1/2000-01 |
*Note that rank/duration varies for each climate site.
Temperature Info for Winter (Dec2013-Feb2014):
|
Temperature (F)
|
Avg 2013-14 |
Rank |
Normal |
Record/Season |
Days Zero or Below/Rank |
Most Zero & Below/Year |
|---|---|---|---|---|---|---|
|
Toledo |
20.4 |
5th |
27.8 |
17.7/1977-78 |
25 / 3rd |
29 / 1962-63 |
|
Mansfield |
23.4 |
9th |
27.8 |
17.6/1976-77 |
14 / 8th |
27 / 1976-77 |
|
Cleveland |
25.4 |
22nd |
30.3 |
19.7/1976-77 |
11 / 11th* |
28 / 1976-77 |
|
Akron-Canton |
25.0 |
20th |
28.5 |
20.4/1976-77 |
11 / 10th* |
24 / 1976-77 |
|
Youngstown |
23.7 |
8th |
28.1 |
19.0/1976-77 |
16 / 3rd |
25 / 1976-77 |
|
Erie, PA |
24.4 |
17th |
29.3 |
20.5/1976-77 |
10 / 10th* |
14 / 1978-79 |
*Tied with other winters. Note that rank/duration varies for each climate site.
To complement the cold temperatures, many locations had one of the top 10 snowiest winters on record (see the above tables). In fact Toledo broke their previous all-time record with 86.3 inches! This was more than twice their normal seasonal snowfall. Toledo had 6 days during the winter that had snowfall of 4 inches more which is well above average. Erie, PA was also above normal for the more significant snow days. Cleveland, on the other hand, nickeled and dimed their way to an above average seasonal total with only 4 days with 4 inches or better.
| 2008-2009 | 2009-2010 | 2010-2011 | 2011-2012 | 2012-2013 | 2013-2014 | 1981-2010 Normal Annual Snowfall | |||||||||
|---|---|---|---|---|---|---|---|---|---|---|---|---|---|---|---|
| seasonal snowfall | # of days with GTE 4" | seasonal snowfall | # of days with GTE 4" | seasonal snowfall | # of days with GTE 4" | seasonal snowfall | # of days with GTE 4" | seasonal snowfall | # of days with GTE 4" | seasonal snowfall | # of days with GTE 4" | average | # of days with GTE 4" | ||
| Toledo | 45.9 | 3 | 39.1 | 1 | 49.2 | 3 | 20.8 | 0 | 24.2 | 0 | 86.3 | 6 | 39.5 | 1.4 | |
| Cleveland | 80 | 4 | 59.5 | 2 | 69.3 | 4 | 38.9 | 2 | 51.7 | 3 | 86.1 | 4 | 68.2 | 4.1 | |
| Erie, PA | 145.8 | 12 | 91.4 | 8 | 110.2 | 6 | 46.9 | 3 | 105.6 | 5 | 139.5 | 9 | 100.9 | 7.3 | |
One of the more significant snowstorms and wintry mixes occurred on February 4th and 5th with a mixture of snow, freezing rain and sleet. Over 10 inches of snow fell across the northern tier of countries with significant ice accumulation further south. Schools were closed for several days due to the snow and ice. In addition, schools closed on a number of days due to dangerous wind chills. Many school districts ended using more than their allotted calamity days over the course of the winter. Another episode of heavy snow occurred on the 17th and 18th. This time Northeast Ohio saw the greatest accumulations.
On January 21st a few lucky people experienced a rare atmospheric optical phenomenon: light pillars. Light pillars occur when light is reflected off of plate-shaped ice crystals in the air. The light pillars appear as vertical columns of light extending above or below the source of light, which can be street lights, headlights on cars, or even the moon. It requires very cold air, high humidity, and little to no wind.

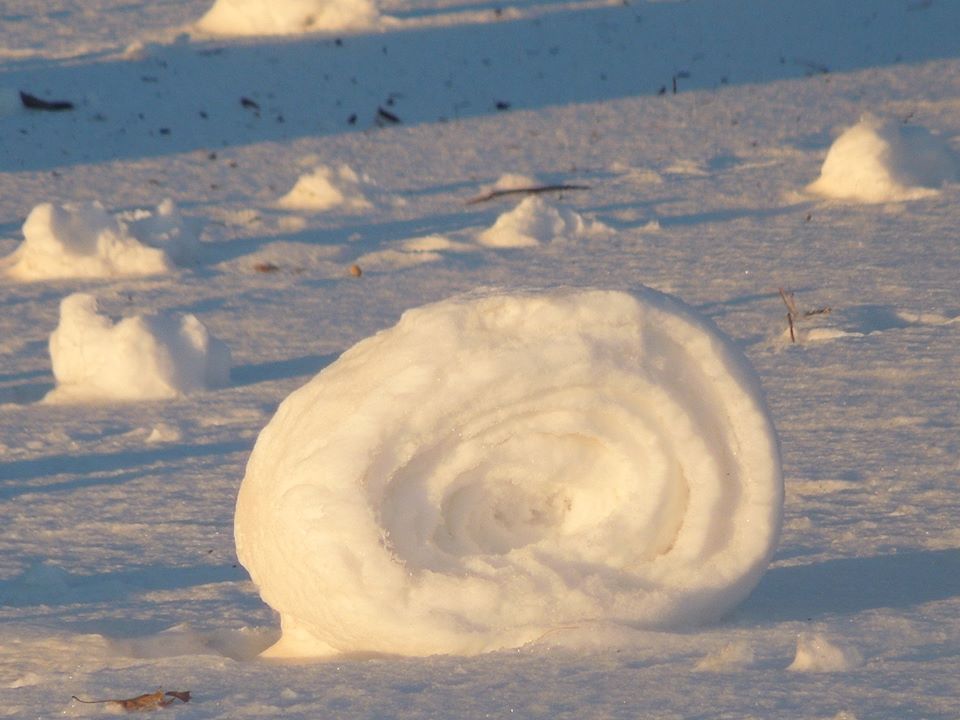
People all across the area woke up on January 27th to see a rare phenomenon: snow rollers. These wind driven balls of snow need just the right conditions to form and this was it. As the temperatures began to drop below freezing early that morning a couple inches of snow fell atop the refrozen snowpack and winds were sustained around 20-25 MPH (gusting to 40-60 MPH).
Such cold temperatures formed thick ice on area rivers in January and February. In some instances the ice was 8"-10" thick. Of course Lake Erie was also frozen at the mouths of the rivers. Combine the ice with a snowpack that had up to 2 inches of water within it and warm temperatures and rainfall and the result can be significant ice jams and flooding. A brief warm up led to minor ice jams in January. Late in February, the Vermilion River had flooding as ice began to break up and then chunks of ice became lodged against bridges, bends in the river, and against Lake Erie ice. Flooding can occur upstream of the ice jam as water backs up and then flooding can occur downstream once the jam becomes dislodged.
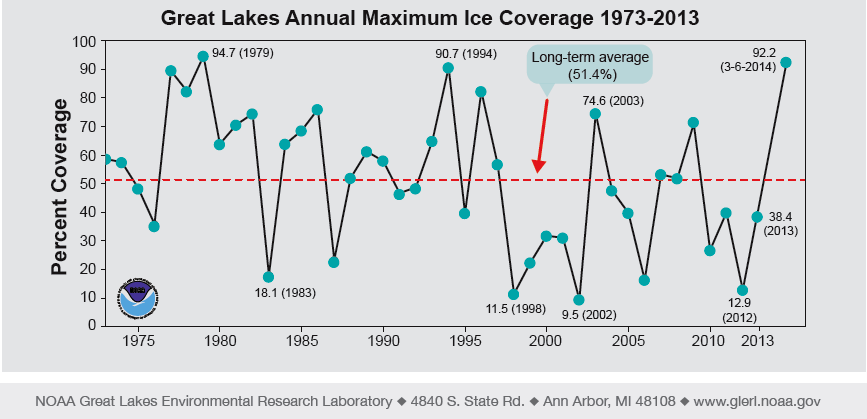
The cold temperatures also allowed for ice on the Great Lakes to reach its 2nd greatest extent on record (1973-2014). On March 6th 92.2% of the Great Lakes had ice cover. The record remains at 94.7 percent from 1979. Last season, Lake Erie peaked at 96.4% on March 6th. For more information visit the NWS Great Lake Ice Climatology page or the Great Lakes Environmental Research Laboratory.
While March continued to have temperatures that ran well below normal, April through June averaged slightly above normal as we began to see a shift in the pattern. The warmer weather brought frequent rounds of severe weather. The first significant severe weather event occurred on April 29th with damaging winds reported across north central Ohio.
By May we had the area's first tornados which occurred in Lorain and Medina counties (May 12th) along with flash flooding in the Akron and Cleveland areas. Slow moving storms brought intense rainfall rates that produced destructive flash floods across dozens of communities. Thousands of homes and businesses in northern Ohio were flooded. County-level emergencies were declared in Lorain, Medina and Summit counties. The rainfall intensity was around a 500 year event for many of the hardest hit communities.

The first 90+ degree days occurred in June (17th and 18th) which made those cold winter months seem like the distant past. These warm temperatures led to a significant severe weather event on the 18th. Hail and winds greater than 70 MPH caused damage across northern Ohio and northwestern Pennsylvania. An EF1 caused damage in Brunswick (Medina County) on the 23rd of June.
For the first time in years, no 90 degree temperatures were reported in July (and some locations, including Youngstown, never did hit 90+ in 2014). For Toledo, Mansfield, Youngstown and Cleveland, July 2014 made it into the top ten coolest Julys on record. Temperatures for the month average four degrees below normal. This pattern limited the extent of severe weather and events were more isolated. There were multiple tornadoes on July 8th with three EF1 tornadoes and one EF0 tornado. Two of the tornadoes struck Medina County and for the second time in two weeks, one struck Brunswick and caused minor damage. The other tornadoes were in Mahoning and Lorain counties. Cool weather the second half of the month lead to numerous reports of waterspouts on Lake Erie.
Temperatures August, September and October averaged within a degree of normal. September was rather dry and this led to very warm weather at the beginning of the month. The warmest temperatures of the year occurred on September 5th when readings soared into the lower 90s. Four weak EF0 tornadoes occurred on September 10th. Three of these were in Portage County with the fourth in Summit County. Only minor damage was reported.
Winter got off to an early start in November. After seasonable temperatures the first half of the month, readings took a turn downward. Highs failed to get out of the teens on the 18th and there were several days of highs below freezing. The first significant snow of the year occurred on the 13th through the 15th with more than a foot of snow to the east of Cleveland in the snowbelt. In Erie, PA the 12.6 inches of snow they received on November 13the was the earliest occurrence for them of a snowfall of that magnitude. Another bout of snow for the area occurred on the 20th and 21st. This was followed by a big warm up on the 24th which led to an outbreak of severe weather. Winds in excess of 60 mph downed thousands of trees and led to scattered power outages throughout the region. Cleveland finished the month with its 4th snowiest November and both Youngstown and Erie with their 8th snowiest.
Although 2014 started like a lion, it went out as a lamb. Virtually no snow fell during the month of December with temperatures averaging between four and five degrees above normal. Many sites ended up in the top five rankings for least snowiest December’s ever.
The average high temperature was 56.8 F. The hottest temperature was 93.0 F, which occurred on September 5.
1 record high temperature was broken:
Oct 27 (78.0 F)
The average low temperature was 40.3 F. The coldest temperature was -15.0 F, which occurred on January 6.
15 record low temperatures were broken:
Jan 3 (-12.0 F) Jan 6 (-15.0 F) Jan 7 (-14.0 F) Jan 28 (-10.0 F)
Feb 6 (-6.0 F) Feb 12 (-14.0 F) Feb 28 (-7.0 F) Mar 4 (-4.0 F)
Mar 13 (-4.0 F) Mar 26 (9.0 F) Apr 16 (19.0 F) Jul 25 (50.0 F)
Jul 29 (49.0 F) Jul 31 (48.0 F) Nov 2 (22.0 F)
The annual average temperature was 47.0 F. The normal mean average temperature is 50.2 F.
January was the 6th coldest on record with an average temperature of 16.0 F.
February was the 7th coldest on record with an average temperature of 17.7 F.
March was the 6th coldest on record with an average temperature of 28.6 F.
November was the 8th coldest on record with an average temperature of 35.1 F.
2014 was the 4th coldest year on record with an average temperature of 47.0 F.
31.70 inches of precipitation fell for the year. 34.24 inches is normal.
The greatest daily rainfall was 3.39 inches, which fell on Sep 10.
July was the 8th driest on record with 0.83 inches of precipitation.
77.4 inches of snow fell for the year. 37.6 inches is normal.
The greatest daily snowfall was 9.4 inches, which fell on January 5.
The most snow recorded on the ground was 13 inches on January 10.
January was the snowiest on record with 40.2 inches.
February was the 7th snowiest on record with 21.6 inches.
December tied 1931 for the least snow with only a trace.
2014 was the snowiest year on record with 77.4 inches.
The average high temperature was 57.5 F. The hottest temperature was 90.0 F, which occurred on September 5.
No record high temperatures were broken.
The average low temperature was 38.5 F. The coldest temperature was -15.0 F, which occurred on January 28.
8 record low temperatures were broken:
Jan 6 (-13.0 F) Jan 7 (-12.0 F) Jan 28 (-15.0 F) Feb 11 (-5.0 F)
Mar 4 (1.0 F) Mar 13 (3.0 F) Nov 19 (12.0 F) Nov 21 (12.0 F)
The annual average temperature was 48.0 F. The normal mean average temperature is 49.6 F.
February was the 9th coldest on record with an average temperature of 21.1 F.
March was the 10th coldest on record with an average temperature of 31.6 F.
July was the 6th coldest on record with an average temperature of 68.6 F.
November was the 7th coldest on record with an average temperature of 36.0 F.
36.52 inches of precipitation fell for the year. 41.62 inches is normal.
The greatest daily rainfall was 1.38 inches, which fell on April 29.
April was the 2nd wettest on record with 7.16 inches of precipitation.
53.5 inches of snow fell for the year. 48.3 inches is normal.
The greatest daily snowfall was 4.5 inches, which fell on Jan 2.
The most snow recorded on the ground was 5 inches on Feb 9 and 18.
The average high temperature was 57.4 F. The hottest temperature was 91.0 F, which occurred on September 5.
1 record high temperature was broken:
May 13 (88.0 F)
The average low temperature was 40.1 F. The coldest temperature was -11.0 F, which occurred on January 6 and Jan 7.
7 record low temperatures were broken:
Jan 6 (-11.0 F) Jan 7 (-11.0 F) Feb 7 (-3.0 F) Mar 4 (0.0 F)
Jul 18 (51.0 F) Nov 17 (14.0 F) Nov 18 (10.0 F)
The annual average temperature was 48.9 F. The normal mean average temperature is 49.8 F.
July tied the 10th coldest on record with an average temperature of 69.3 F.
November tied the 8th coldest on record with an average temperature of 37.1 F.
44.05 inches of precipitation fell for the year. 41.62 inches is normal.
The greatest daily rainfall was 3.54 inches, which fell on Jun 24.
June was the 9th wettest on record with 6.26 inches of precipitation.
84.2 inches of snow fell for the year. 68.1 inches is normal.
February was the 7th snowiest on record with 23.8 inches.
November was the 4th snowiest on record with 19.4 inches.
December was the 3rd least snowiest with 0.9 inches.
The greatest daily snowfall was 7.0 inches, which fell on Nov 27.
The most snow recorded on the ground was 13 inches on Feb 18.
The average high temperature was 58.3 F. The hottest temperature was 90.0 F, which occurred on July 1.
No record high temperatures were broken.
The average low temperature was 40.4 F. The coldest temperature was -11.0 F, which occurred on January 7.
3 record low temperatures were broken:
Jan 6 (-10.0 F) Jan 7 (-11.0 F) Nov 19 (7.0 F)
The annual average temperature was 49.2 F. The normal mean average temperature is 49.8 F.
45.69 inches of precipitation fell for the year. 39.62 inches is normal.
The greatest daily rainfall was 2.49 inches, which fell on Jun 18.
April was the 3rd wettest on record with 6.24 inches of precipitation.
June was the 2ndwettest on record with 9.28 inches of precipitation.
2014 was the 8th wettest year on record with 45.69 inches of precipitation.
55.2 inches of snow fell for the year. 47.5 inches is normal.
January tied the 9th snowiest on record with 19.1 inches.
February was the 8th snowiest on record with 17.0 inches.
December was the 1st least snowiest with 0.5 inches.
The greatest daily snowfall was 6.3 inches, which fell on Jan 25.
The most snow recorded on the ground was 9 inches on Feb 19.
The average high temperature was 57.2 F. The hottest temperature was 89.0 F, which occurred on July 1.
1 record high temperature was broken:
Oct 28 (77.0 F)
The average low temperature was 37.9 F. The coldest temperature was -12.0 F, which occurred on January 7.
8 record low temperatures were broken:
Jan 7 (-12.0 F) Jan 22 (-6.0 F) Feb 28 (-8.0 F) Mar 4 (-5.0 F)
Mar 13 (4.0 F) Mar 26 (7.0 F) Apr 16 (18.0 F) Nov 19 (9.0 F)
The annual average temperature was 47.6 F. The normal mean average temperature is 49.6 F.
February was the 10th coldest on record with an average temperature of 20.9 F.
March was the 4th coldest on record with an average temperature of 29.9 F.
July was the 7th coldest on record with an average temperature of 68.1 F.
39.27 inches of precipitation fell for the year. 38.91 inches is normal.
The greatest daily rainfall was 1.71 inches, which fell on August 20.
August was the 10th wettest on record with 6.26 inches of rain.
67.8 inches of snow fell for the year. 62.7 inches is normal.
The greatest daily snowfall was 5.5 inches, which fell on January 25.
The most snow recorded on the ground was 12 inches on February 19.
February was the 5th snowiest on record with 23.4 inches.
November was the 8th snowiest on record with 11.6 inches.
December was the 2nd least snowiest on record with 0.7 inches.
The average high temperature was 56.0 F. The hottest temperature was 91.0 F, which occurred on August 30.
3 record high temperatures were broken:
May 13 (88.0 F) Jun 17 (90.0 F) October 28 (76.0 F)
The average low temperature was 40.3 F. The coldest temperature was -10.0 F, which occurred on January 7.
8 record low temperatures were broken:
Jan 7 (-10.0 F) Feb 28 (-7.0 F) Mar 3 (-4.0 F) Mar 4 (-4.0 F)
Mar 26 (12.0 F) Apr 16 (21.0 F) Apr 24 (28.0 F) Nov 19 (12.0 F)
The annual average temperature was 48.1 F. The normal mean average temperature is 49.8 F.
March was the 7th coldest on record with an average temperature of 28.1 F.
40.75 inches of precipitation fell for the year. 42.16 inches is normal.
The greatest daily rainfall was 1.64 inches, which fell on July 8.
106.3 inches of snow fell for the year. 100.9 inches is normal.
The greatest daily snowfall was 12.6 inches, which fell on Nov ember13.
The most snow recorded on the ground was 9 inches on February 6, 10, 11 and November 14.
February was the 9th snowiest on record with 28.9 inches.
November was the 8th snowiest on record with 25.0 inches.
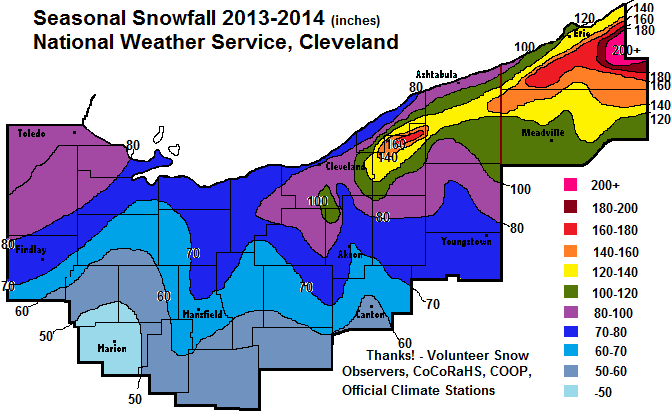
A text description of the 2013-2014 Season Snowfall and the snowfall totals that contributed to this map can be found here.
A number of monthly temperature and precipitation records occurred across our climate sites this year.
All of these monthly statistics for our climate stations can be found year round by going to the following link and selecting your station. Data each month are updated within a week if data for the previous month made the "top ten."
NWS Cleveland Unique Local Climate Data
Records that encompass yearly totals such as the wettest/driest/snowiest years on record are again located on our Unique Local Climate Data page.
View our growing local weather events page highlighted below.
Local Weather Events & Local Interest Features Page
The publication, StormData, can be found with the National Climate Data Center.
Significant Global Climate Extremes and Anomalies 2014
NCDC 2014 Preliminary Annual Global Climate Report
NCDC 2014 Preliminary United States Significant Weather and Climate Events
NCDC 2014 Preliminary State of the Climate - U.S. Summary
Preliminary data is updated in mid-January to reflect end of the year weather. The full analysis will be out in spring.
All data are considered preliminary. The National Climate Data Center finalizes and stores the official record of all of our weather data.
Period of record are as follows:
Records data back to 1873 for Erie
1897 for Youngstown
1887 for Canton-Akron
1871 for Cleveland
1873 for Toledo
1916 for Mansfield

