2018 Annual Climate Summaries
 |
|
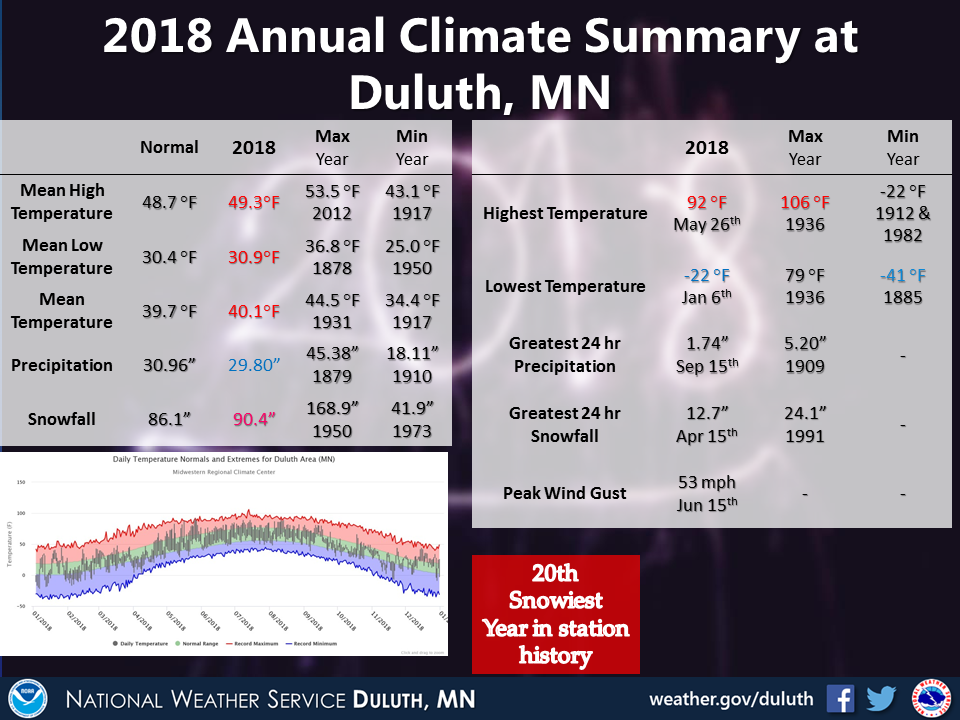
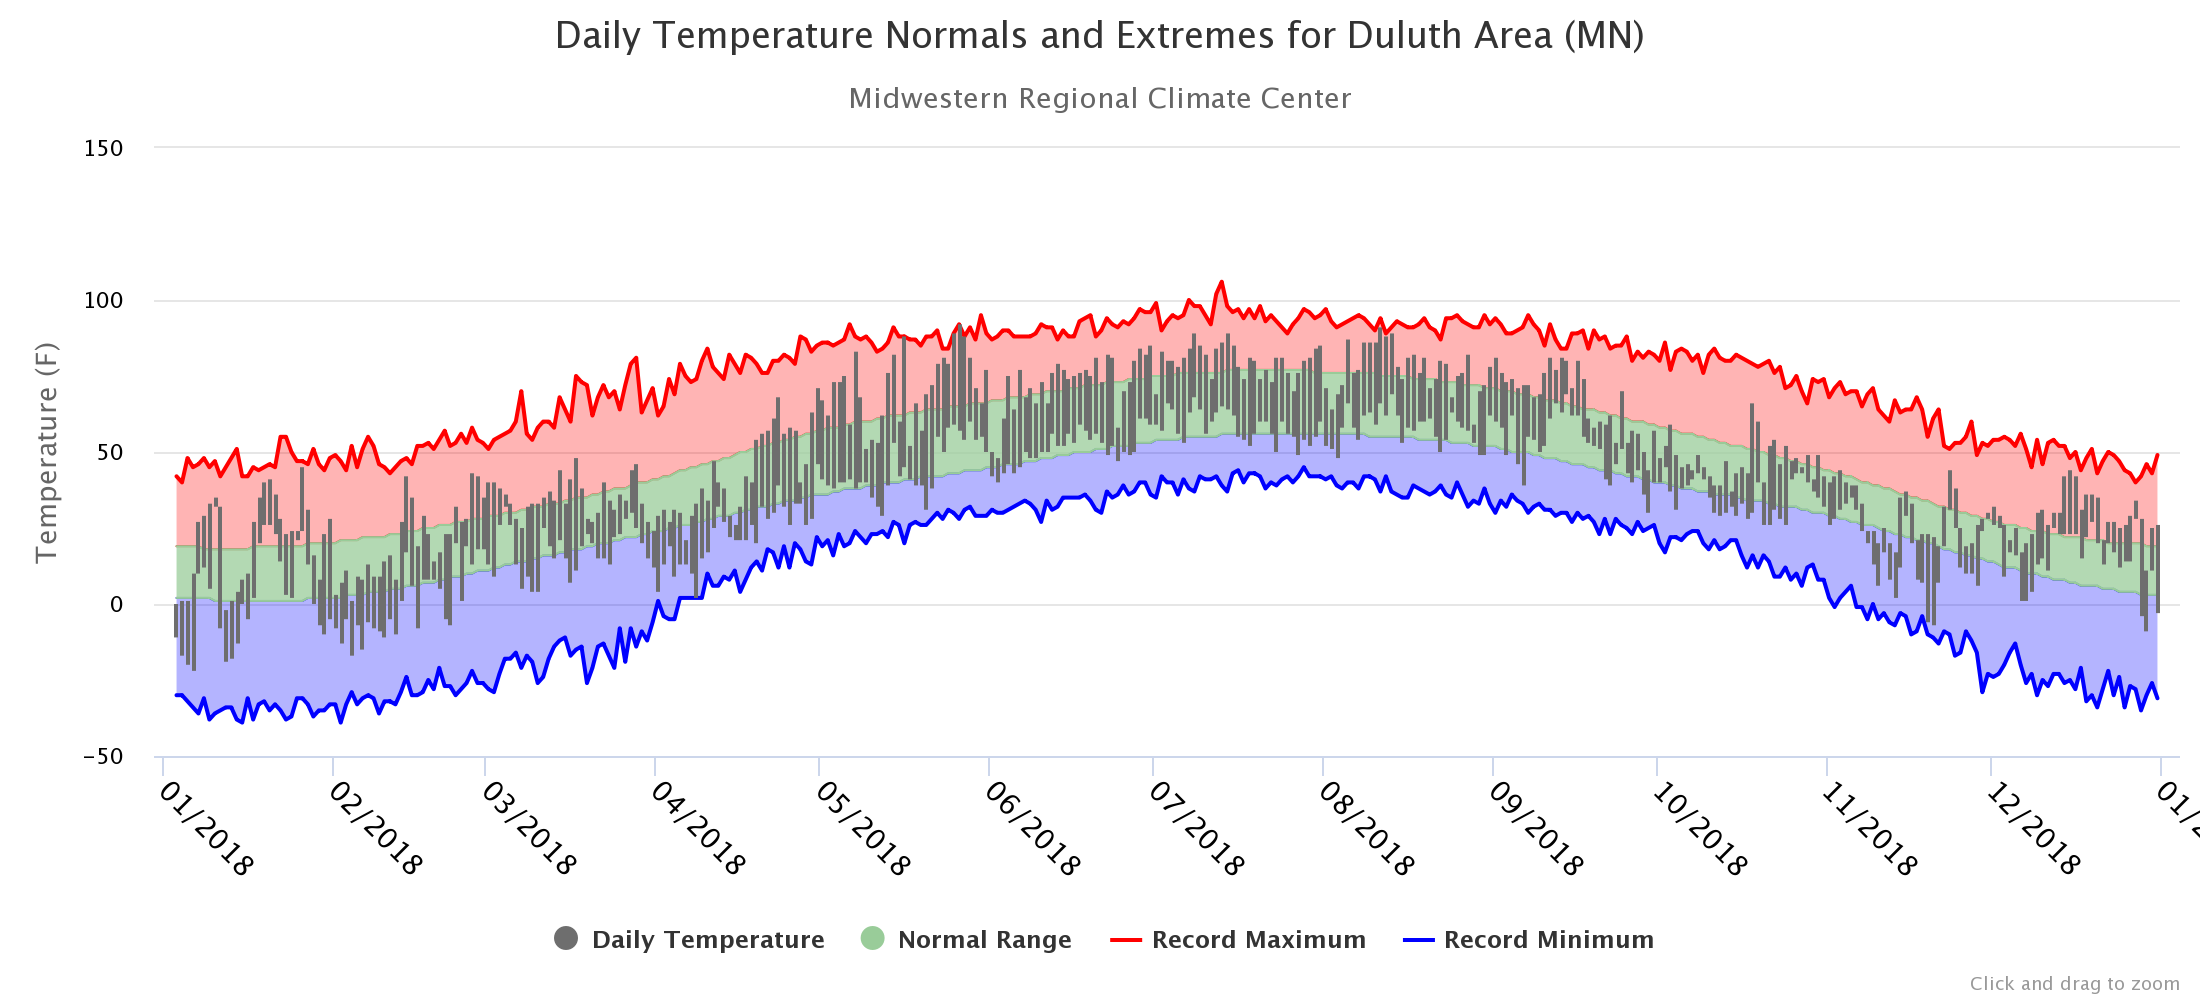
For the full details check out: Click Here For a larger view of the Duluth, Minnesota temperature graph provided by the Midwestern Regional Climate Center: Click Here |
 |
|
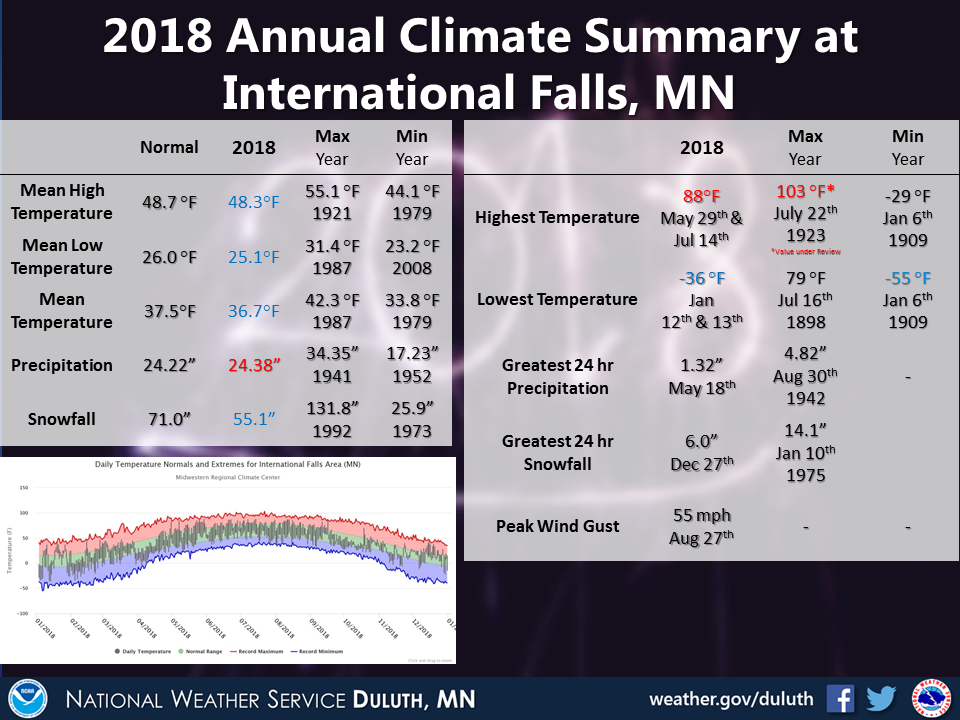
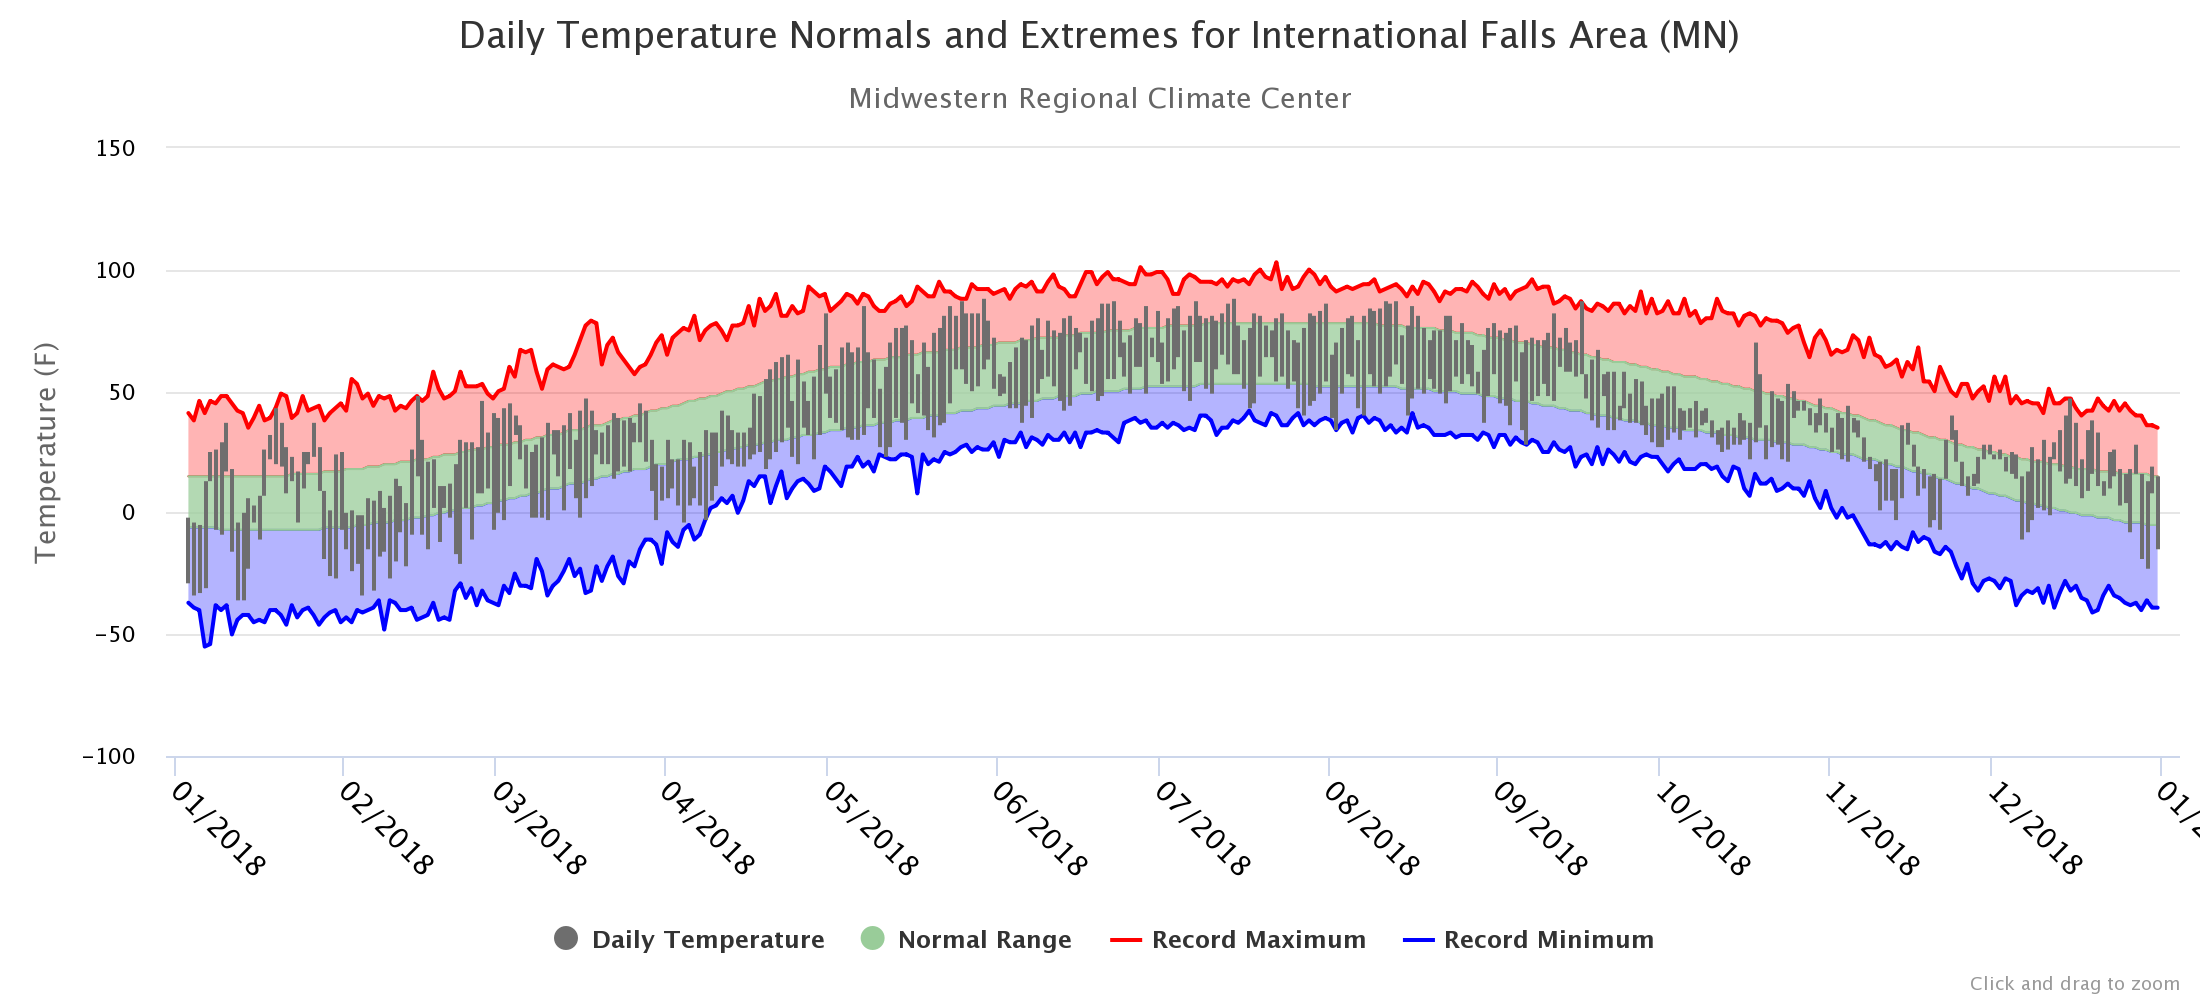
For the full details check out: Click Here For a larger view of the International Falls, Minnesota temperature graph provided by the Midwestern Regional Climate Center: Click Here |
 |
|
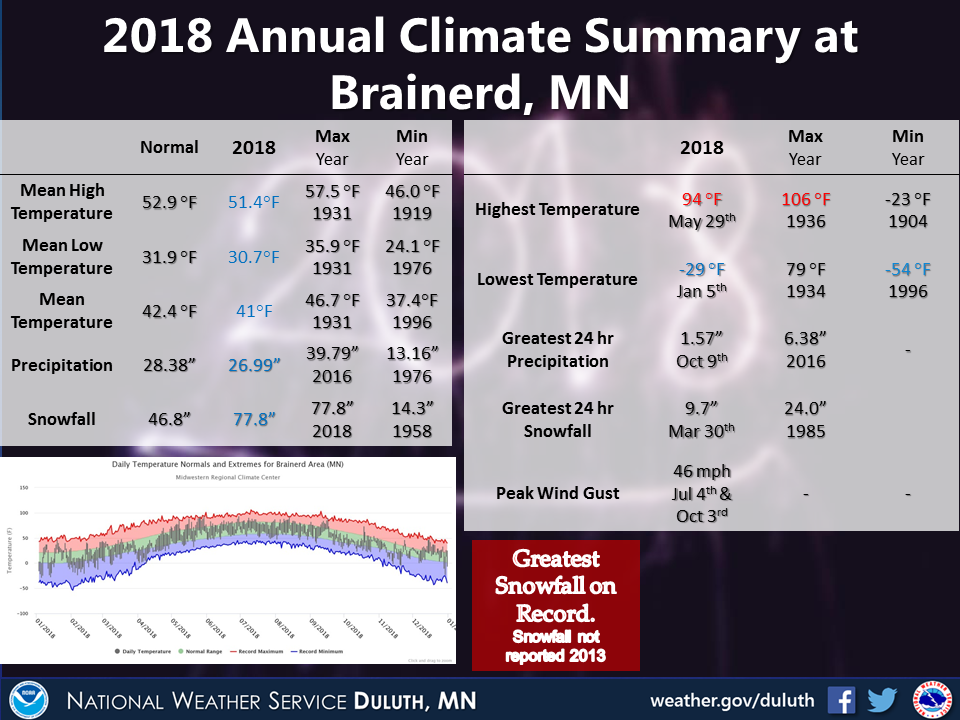
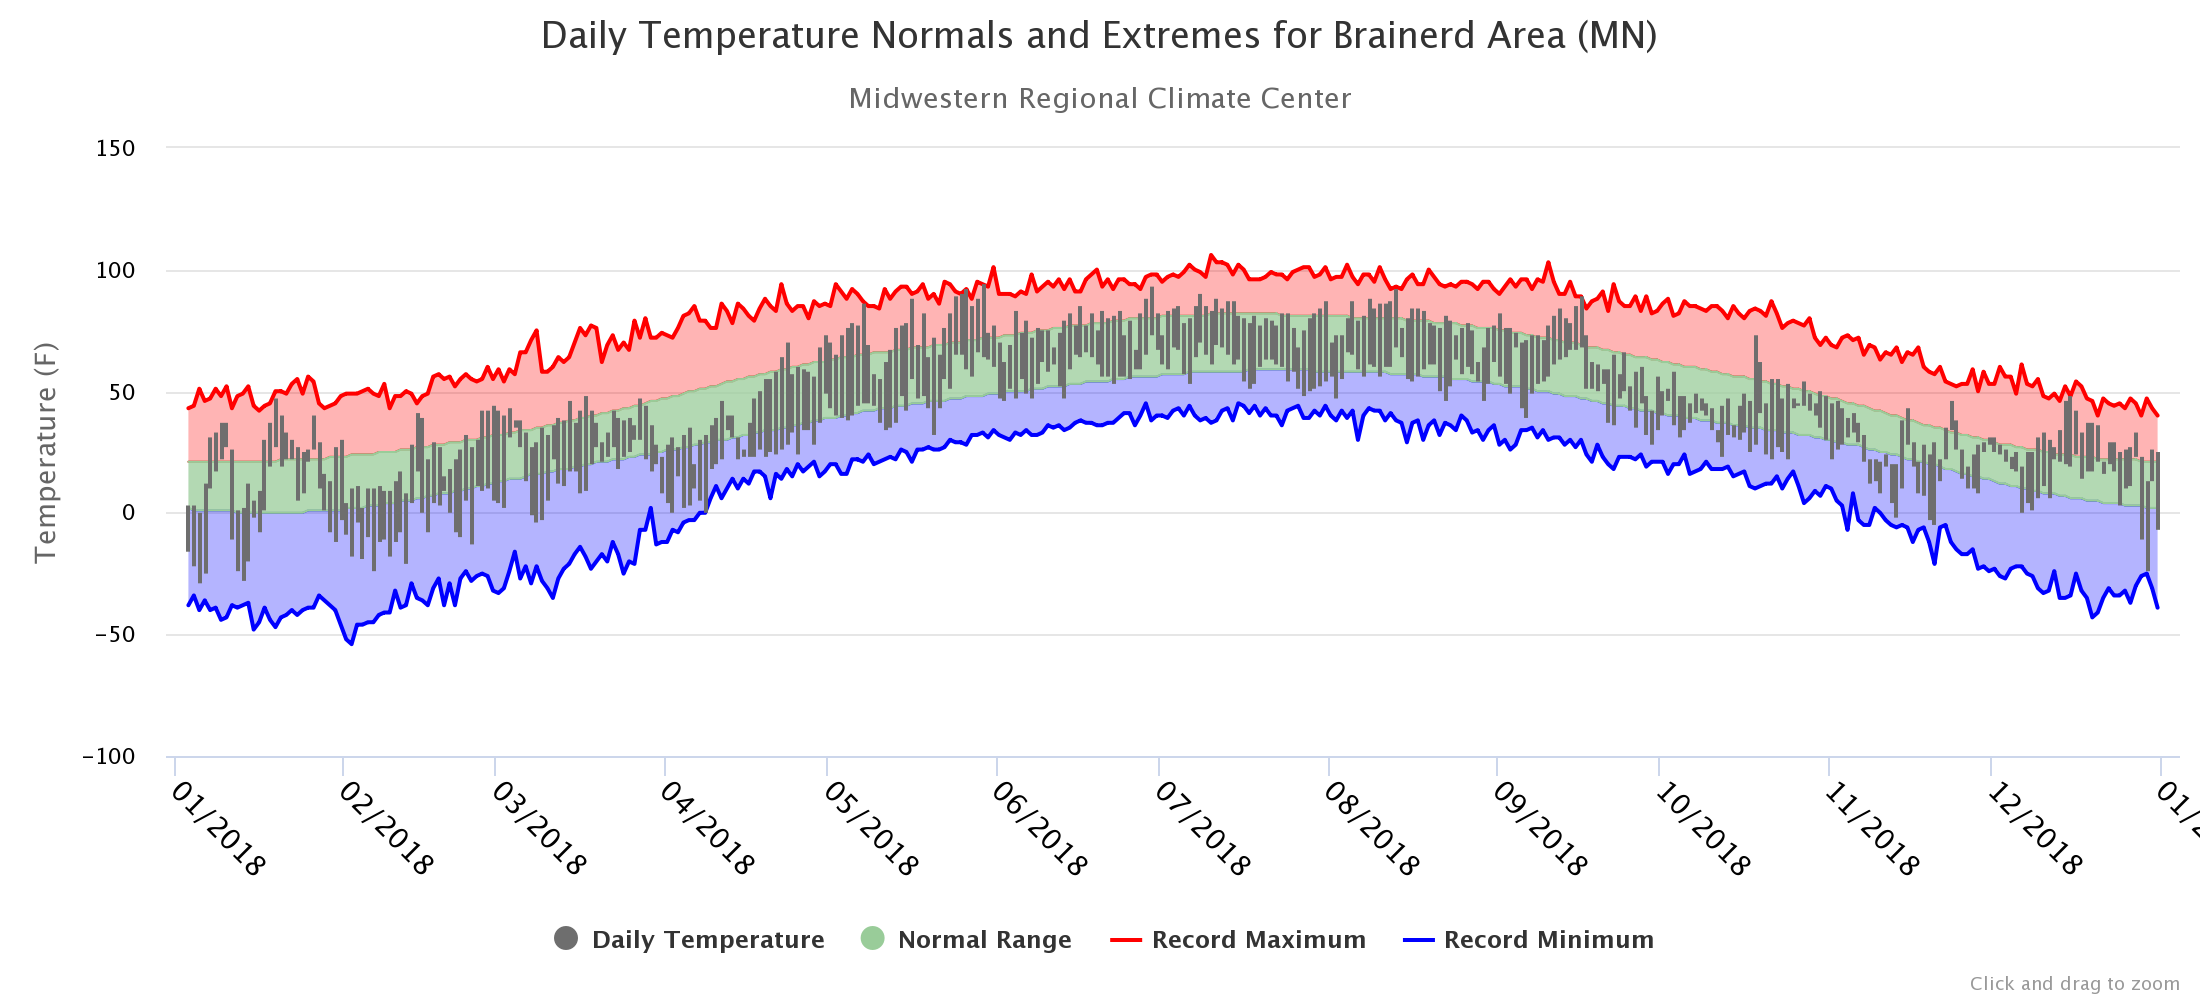
For the full details check out: Click Here For a larger view of the Brainerd, Minnesota temperature graph provided by the Midwestern Regional Climate Center: Click Here |
 |
|
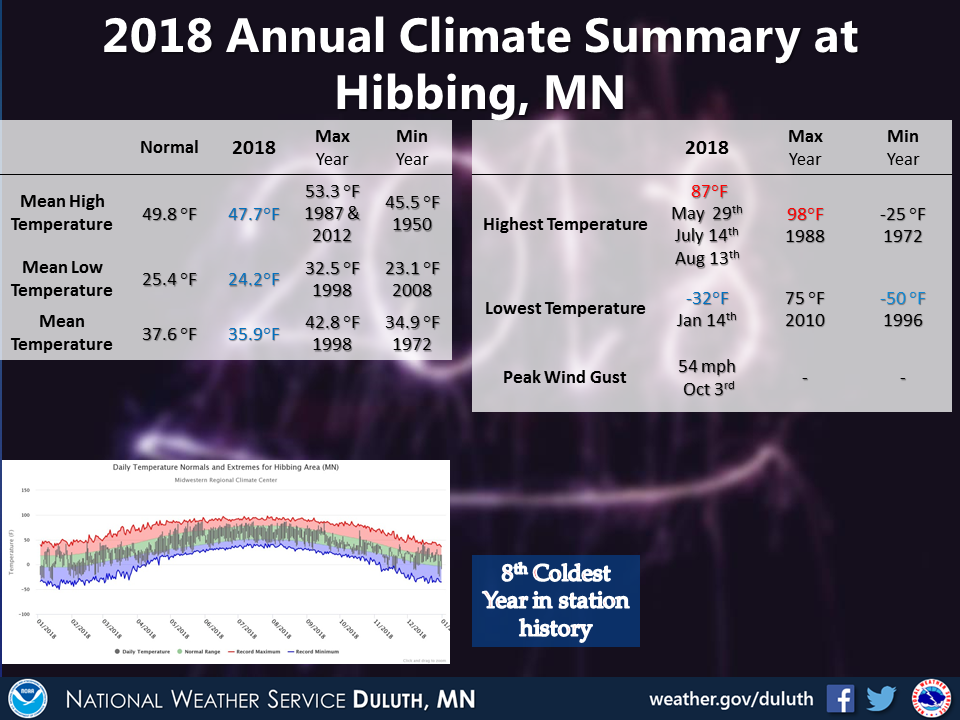
For the full details check out: Click Here For a larger view of the Hibbing, Minnesota temperature graph provided by the Midwestern Regional Climate Center: Click Here |
 |
|
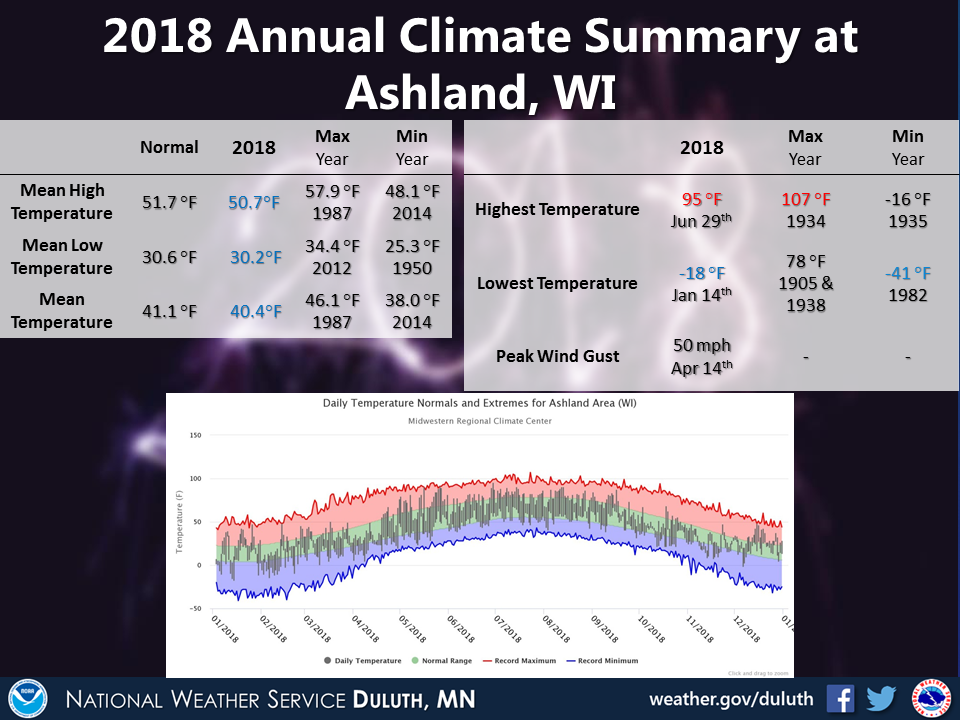
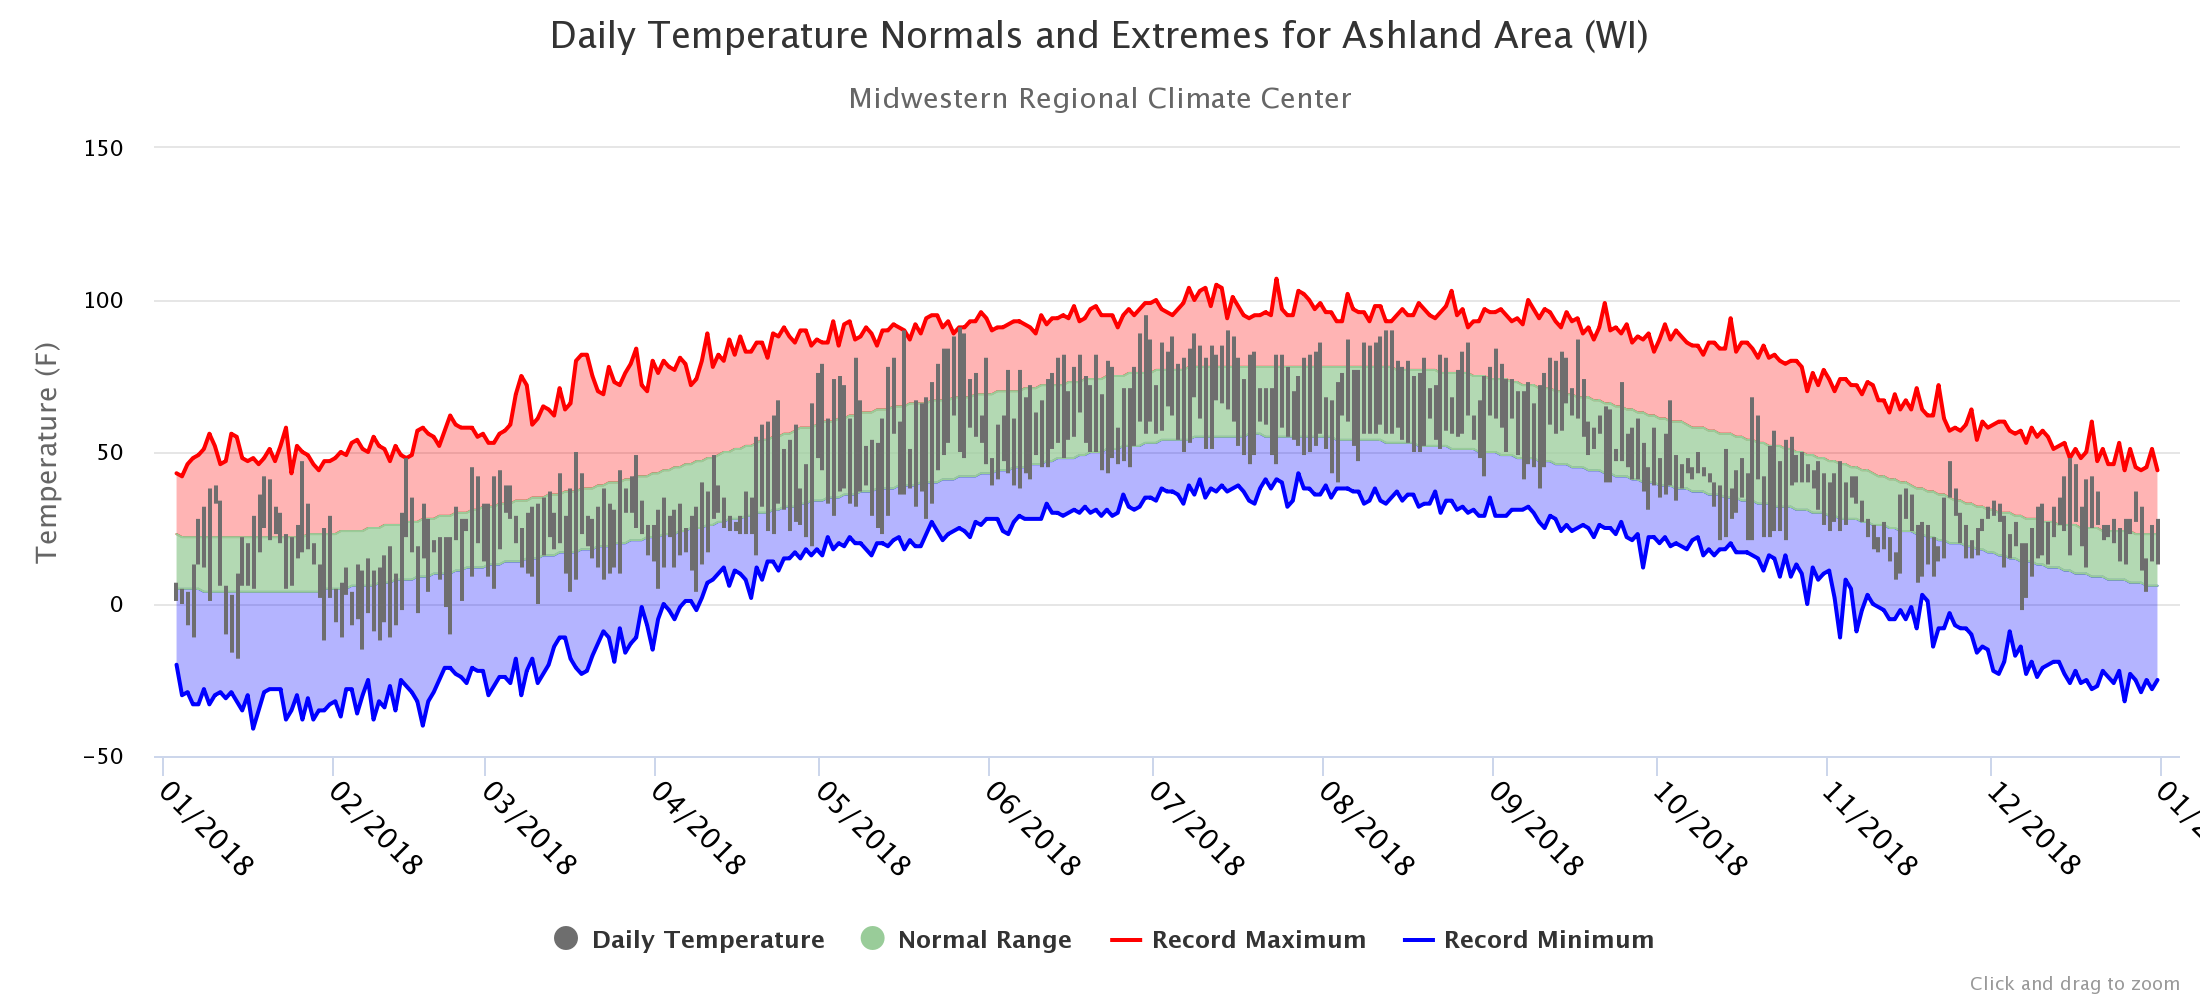
For the full details check out: Click Here For a larger view of the Ashland, Wisconsin temperature graph provided by the Midwestern Regional Climate Center: Click Here |
Duluth, MN
|
Normals for the Year |
|
|
The Normal, Yearly Average Temperature (degrees F) |
39.7 |
|
The Normal, Yearly High Temperature (degrees F) |
48.8 |
|
The Normal, Yearly Low Temperature (degrees F) |
30.5 |
|
|
|
|
Normal Yearly Precipitation (inches) |
30.96 |
|
Normal Yearly Snowfall (inches) |
86.1 |
|
|
|
|
Normal number of days with Measurable Precipitation |
131.4 |
|
Normal number of days with snow depth of 1 inch or greater |
|
|
|
|
|
Normal Heating Degree Days |
9444 |
|
Normal Cooling Degree Days |
204 |
|
|
|
|
Records for the Year |
|
|
Warmest Year (Yearly Average Temperature) |
49.9 in 1963 |
|
Coldest Year (Yearly Average Temperature) |
37.7 in 1959 |
|
Highest Observed Temperature (degrees F) |
106.0 on the 7th of July in 1936 |
|
Lowest Observed High Temperature (degrees F) |
-22 on the 5th of January in 1912 & on the 9th of January in 1982 |
|
Lowest Observed Temperature (degrees F) |
-41 on the 2nd of January in 1885 |
|
Highest Observed Low Temperature (degrees F) |
79 on the 13th of July in 1936 |
|
|
|
|
Greatest Yearly Precipitation (inches) |
45.38 in 1879 |
|
Least Yearly Precipitation (inches) |
18.11 in 1910 |
|
|
|
|
Greatest Yearly Snowfall (inches) |
168.9 in 1950 |
|
Least Yearly Snowfall (inches) |
41.9 in 1973 |
International Falls, MN
|
Normals for the Year |
|
|
The Normal, Yearly Average Temperature (degrees F) |
37.5 |
|
The Normal, Yearly High Temperature (degrees F) |
48.8 |
|
The Normal, Yearly Low Temperature (degrees F) |
26.2 |
|
|
|
|
Normal Yearly Precipitation (inches) |
24.22 |
|
Normal Yearly Snowfall (inches) |
71.0 |
|
|
|
|
Normal number of days with Measurable Precipitation |
128.0 |
|
Normal number of days with snow depth of 1 inch or greater |
|
|
|
|
|
Normal Heating Degree Days |
10222 |
|
Normal Cooling Degree Days |
193 |
|
|
|
|
Records for the Year |
|
|
Warmest Year (Yearly Average Temperature) |
42.3 in 1987 |
|
Coldest Year (Yearly Average Temperature) |
33.8 in 1979 |
|
Highest Observed Temperature (degrees F) |
103.0 on the 22nd of July in 1923 |
|
Lowest Observed High Temperature (degrees F) |
-28 on the 19th of January in 1985 |
|
Lowest Observed Temperature (degrees F) |
-48 on the 8th of February in 1909 |
|
Highest Observed Low Temperature (degrees F) |
79 on the 16th of July in 1898 |
|
|
|
|
Greatest Yearly Precipitation (inches) |
34.35 in 1941 |
|
Least Yearly Precipitation (inches) |
17.23 in 1952 |
|
|
|
|
Greatest Yearly Snowfall (inches) |
131.8 in 1992 |
|
Least Yearly Snowfall (inches) |
25.9 in 1973 |
Brainerd, MN
|
Normals for the Year |
|
|
The Normal, Yearly Average Temperature (degrees F) |
42.4 |
|
The Normal, Yearly High Temperature (degrees F) |
52.9 |
|
The Normal, Yearly Low Temperature (degrees F) |
31.9 |
|
|
|
|
Normal Yearly Precipitation (inches) |
28.38 |
|
Normal Yearly Snowfall (inches) |
46.8 |
|
|
|
|
Normal Heating Degree Days |
8651 |
|
Normal Cooling Degree Days |
422 |
|
|
|
|
Records for the Year |
|
|
Warmest Year (Yearly Average Temperature) |
46.7 in 1931 |
|
Coldest Year (Yearly Average Temperature) |
37.4 in 1996 |
|
Highest Observed Temperature (degrees F) |
106 on July 10th in 1936 |
|
Lowest Observed High Temperature (degrees F) |
-23 on January 25th in 1904 and on February 9th in 1899 |
|
Lowest Observed Temperature (degrees F) |
-54 on February 2nd in 1996 |
|
Highest Observed Low Temperature (degrees F) |
79 on July 19th in 1934 |
|
|
|
|
Greatest Yearly Precipitation (inches) |
39.79 in 2016 |
|
Least Yearly Precipitation (inches) |
13.16 in 1976 |
|
Greatest Daily Precipitation (inches) |
6.38 on July 11th in 2016 |
|
|
|
|
Greatest Yearly Snowfall (inches) |
74.8 in 1950 |
|
Least Yearly Snowfall (inches) |
14.3 in 1958 |
|
Greatest Daily Snowfall (inches) |
24.0 on March 4th in 1985 |
|
Greatest Measured Snow Depth (inches) |
38 on March 29th in 1965 |
Hibbing, MN
|
Normals for the Year |
|
|
The Normal, Yearly Average Temperature (degrees F) |
37.6 |
|
The Normal, Yearly High Temperature (degrees F) |
49.8 |
|
The Normal, Yearly Low Temperature (degrees F) |
25.4 |
|
|
|
|
Normal Heating Degree Days |
10147 |
|
Normal Cooling Degree Days |
147 |
|
|
|
|
Records for the Year |
|
|
Warmest Year (Yearly Average Temperature) |
42.8 in 1998 |
|
Coldest Year (Yearly Average Temperature) |
34.9 in 1972 |
|
Highest Observed Temperature (degrees F) |
100 on July 29th in 1999 |
|
Lowest Observed High Temperature (degrees F) |
-25 on January 14th in 1972 |
|
Lowest Observed Temperature (degrees F) |
-50 on January 20th in 1996 |
|
Highest Observed Low Temperature (degrees F) |
75 on August 30th in 2010 |
Ashland, WI
|
Normals for the Year |
|
|
The Normal, Yearly Average Temperature (degrees F) |
41.1 |
|
The Normal, Yearly High Temperature (degrees F) |
51.7 |
|
The Normal, Yearly Low Temperature (degrees F) |
30.6 |
|
|
|
|
Normal Heating Degree Days |
8938 |
|
Normal Cooling Degree Days |
239 |
|
|
|
|
Records for the Year |
|
|
Warmest Year (Yearly Average Temperature) |
46.1 in 1987 |
|
Coldest Year (Yearly Average Temperature) |
38.0 in 2014 |
|
Highest Observed Temperature (degrees F) |
107 on the 23rd of July in 1934 |
|
Lowest Observed High Temperature (degrees F) |
-16 on the 23rd of January in 1935 |
|
Lowest Observed Temperature (degrees F) |
-41 on the 17th in 1982 |
|
Highest Observed Low Temperature (degrees F) |
78 on the 14th of August in 1938 and on the 29th of August in 1905 |

