|
The Ice Storm of 15 December 2005 in the Western Carolinas and Extreme Northeast Georgia Laurence G. Lee and Patrick D. Moore 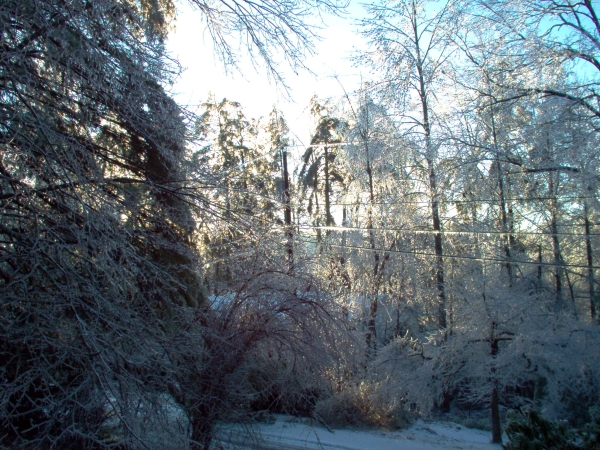
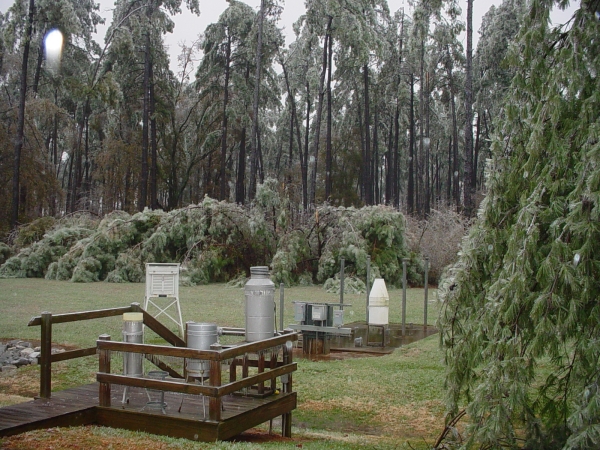
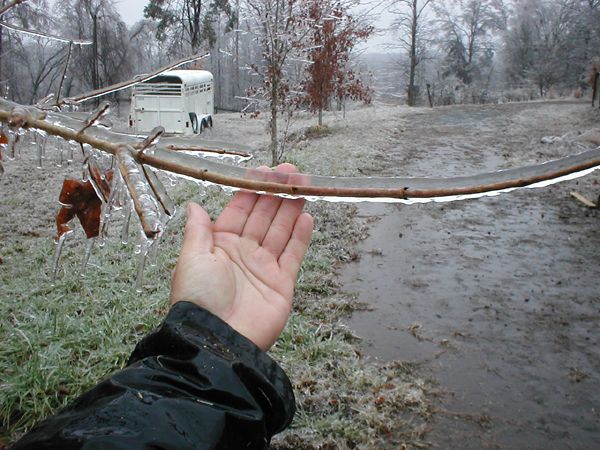
Photo by John Cunningham
Photo by David P. Smith Author's Note: The following report has not been subjected to the scientific peer review process. 1. Introduction A damaging ice storm occurred across portions of the western Carolinas and extreme northeast Georgia on Thursday, 15 December 2005. Rain and freezing rain began in the western portion of the WFO Greenville-Spartanburg (GSP) County Warning Area (CWA) around midnight and spread across the entire area during the morning. The precipitation continued into the afternoon, but it moved steadily from west to east so that almost all precipitation ended by sunset. Ice accumulations between one quarter and three quarters of an inch, with locally greater amounts, caused widespread damage to trees and power lines, resulting in numerous power outages. One quarter to one half inch thick ice occurred in a band extending from extreme northeast Georgia across Upstate South Carolina into the Foothills and northwest Piedmont of North Carolina (Fig. 1). Several locations experienced more than three quarters of an inch of ice, with the most significant ice accretion occurring across the area bounded approximately by Hendersonville and Tryon, North Carolina, and Greenville, South Carolina. No ice accumulation was observed in the far western counties of North Carolina along the Tennessee border. Figure 1. Total ice accumulation (inches) for 15 December 2005. Note that sharp gradients in accumulation may not be indicated at the scale of the graphic. Click on image to enlarge. (Click here to view a list of ice accumulation reports for 15 December 2005. The icing event was caused by a low pressure system that moved across the southeastern United States while a high pressure system centered over New England and the Canadian Maritime Provinces extended southward along the Eastern Seaboard. Cold air damming east of the Appalachians developed nearly coincidently with the onset of precipitation. Even though rapid warming occurred aloft, the subfreezing surface wet bulb temperatures caused the rain to freeze on contact. Highway and road conditions became hazardous only in a few areas. The significant ice accretion was limited to trees, power lines, signs, and other objects above the ground. The highest elevations in western North Carolina extended above the warm layer. Several locations above 5,000 feet received as much as ten inches of snow. 2. Synoptic Features and Associated Weather A broad area of precipitation spread across the southeastern United States between 0000 UTC and 1200 UTC on Thursday, 15 December 2005. (Universal Time Coordinated [UTC] is Eastern Standard Time plus five hours, during the winter months.) The precipitation and a surface low pressure system developed in the isentropic lift region of the coupled jet structure depicted in the Storm Prediction Center (SPC) 0000 UTC 300 mb analysis (Fig. 2). The dominant characteristic of the 500 mb analysis was a low height center over the north central United States (Fig. 3), but the key feature with regard to the precipitation spreading toward the southeastern states was a short wave trough over Texas. The short wave trough and associated surface low moved from the Mississippi Delta to South Carolina during the next 24 hours. 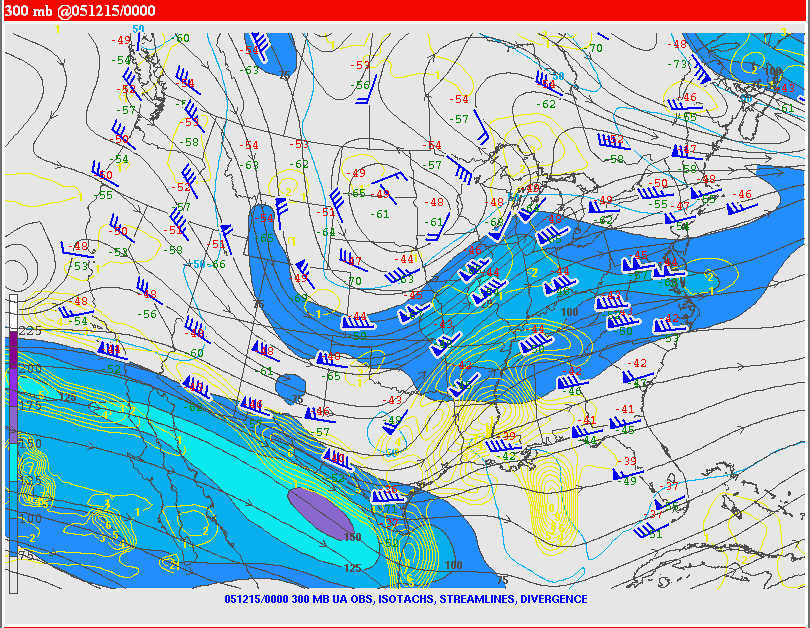
Figure 2. SPC objective analysis of 300 mb wind isotachs, streamlines, and divergence at 0000 UTC 15 December 2005. Click on image to enlarge. 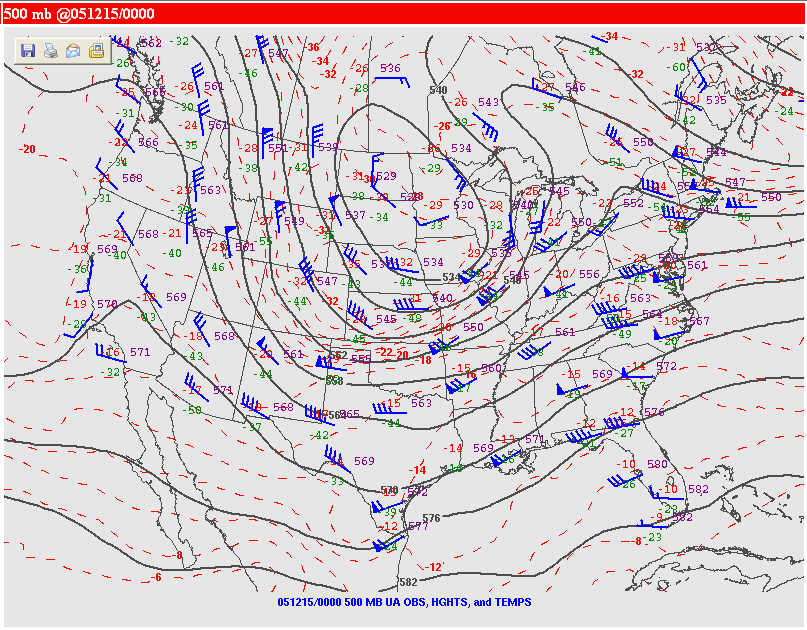
Figure 3. SPC objective analysis of 500 mb geopotential height and temperature at 0000 UTC 15 December. Click on image to enlarge. In the lower troposphere, the isotherm pattern at 850 and 925 mb (Figs. 4 and 5) revealed the presence of the surface based cold air east of the mountains. However, significant warm advection was occurring at both levels across the Carolinas and Georgia as indicated by the southeast and south winds blowing nearly perpendicular to the isotherms. The southerly wind flow caused rapid warming aloft and served to transport moisture into the region. The 0000 UTC surface analysis identified a well-defined axis of high pressure in a cold air damming configuration east of the Appalachians. Surface temperatures across the Piedmont of North Carolina were generally between 30 and 35 deg F, and dewpoints were generally between 10 and 15 deg F. In the North Carolina Mountains around Asheville, temperatures were in the upper 20s. Temperatures in the far western mountains were in the lower and middle 30s. [Note: During cold air damming events, it is quite common for locations west of the Asheville-Hendersonville area to be several degrees warmer because of the inability of the shallow cold air to penetrate beyond the mountains on the west side of the French Broad Valley. This relationship between topography and low-level temperature advection explains in large part the smaller number of freezing rain occurrences in the far western mountain counties during cold air damming. -Ed] Temperatures in Upstate South Carolina were in the lower 30s, and dewpoints were in the teens. Wet bulb temperatures prior to the onset of precipitation were generally in the 25 deg F to 30 deg F range. The 0600 UTC GSP surface analysis (Fig. 6) shows the surface pressure pattern at the time when the precipitation was spreading across the southwestern portion of the forecast area. 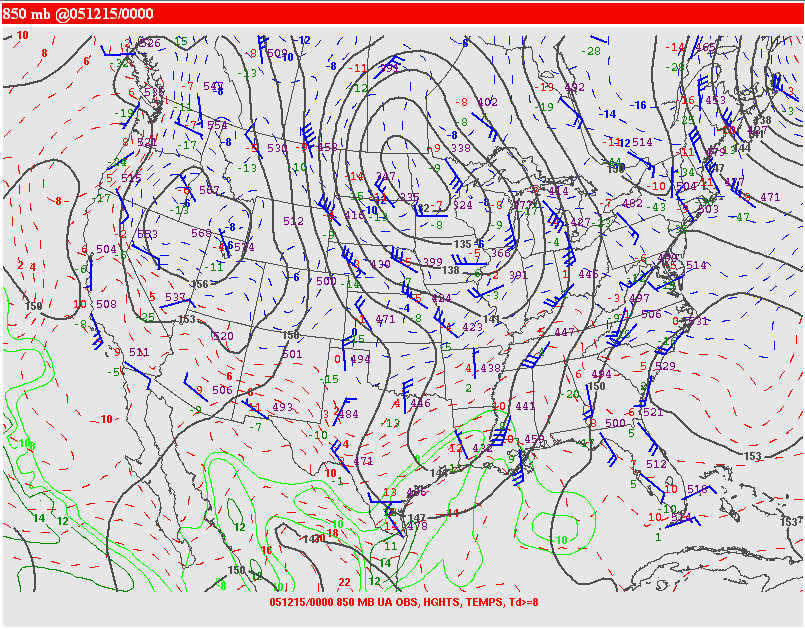
Figure 4. SPC objective analysis of 850 mb geopotential height, temperature, and dew point at 0000 UTC 15 December. Click on image to enlarge. 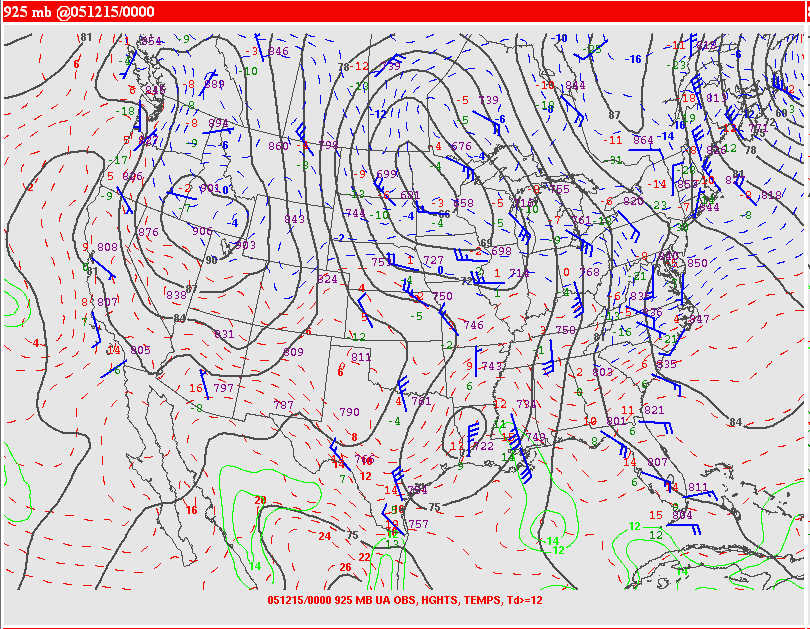
Figure 5. SPC objective analysis of 925 mb geopotential height, temperature, and dew point at 0000 UTC 15 December. Click on image to enlarge. 
Figure 6. Sea level pressure contours (mb) and surface fronts analysis for 0600 UTC 15 December. Click on image to enlarge. The progression of upper level features can be seen in Figs. 7 and 8. By 1200 UTC the region of upper level ascent moved into the southeastern states resulting in widespread precipitation. Even though warming occurred aloft, surface temperatures east and southeast of the mountains remained below freezing due in large part to cold air damming, as seen in the 1200 UTC surface analysis (Fig. 9). Evaporational cooling at the onset of the precipitation contributed to the lowering of surface temperatures which were already near or below freezing at many locations. The near surface cooling also increased the static stability of the air mass thus strengthening the damming. Following the onset of the precipitation across the western Piedmont and Foothills, temperatures warmed very little during the remainder of the morning because of the cloud cover, precipitation, and cold advection. These effects were sufficient to overcome - or at least balance - the warming that accompanied the release of latent heat during the freezing process. 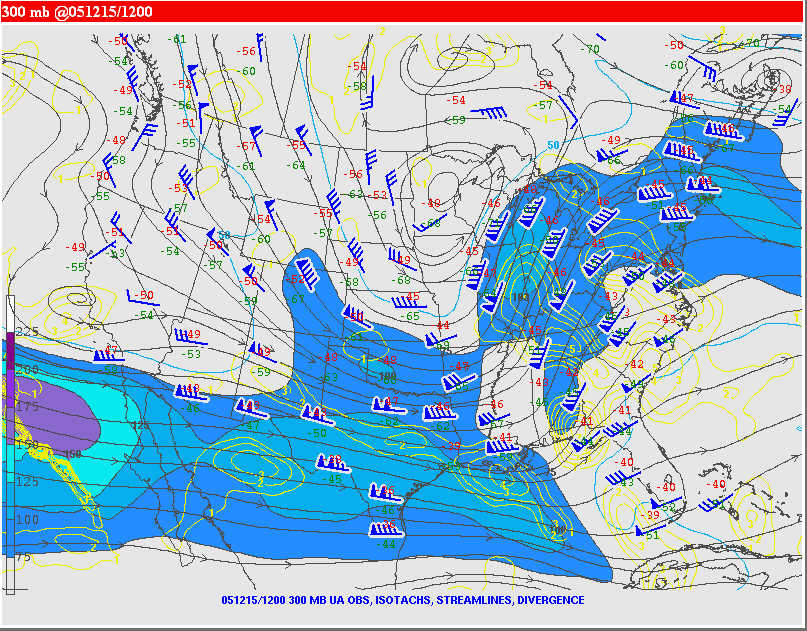
Figure 7. SPC objective analysis of 300 mb wind isotachs, streamlines, and divergence at 1200 UTC 15 December. Click on image to enlarge. 
Figure 8. SPC objective analysis of 850 mb geopotential height, temperature, and dew point at 1200 UTC 15 December. Click on image to enlarge. 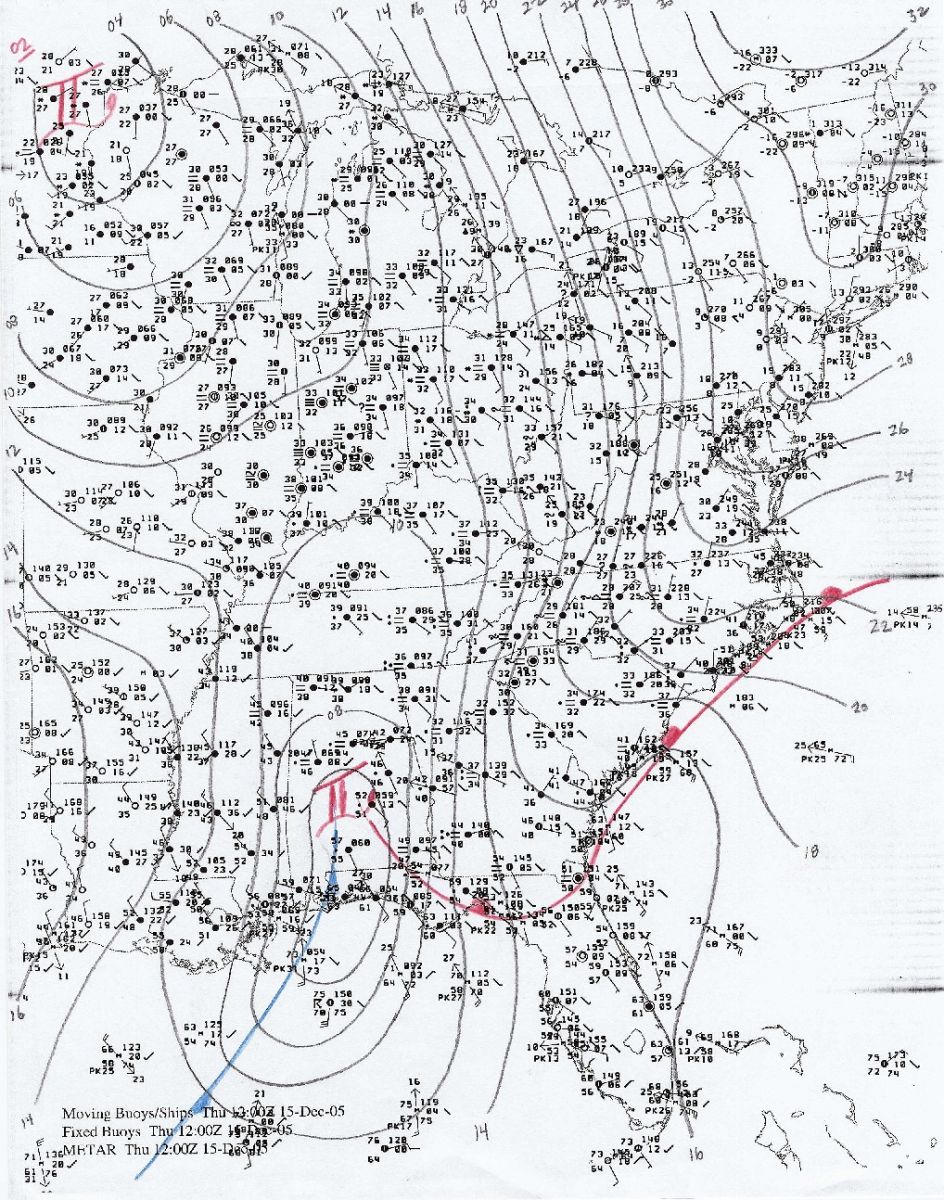
Figure 9. Sea level pressure contours (mb) and surface fronts analysis for 1200 UTC 15 December. Click on image to enlarge. By mid afternoon on 15 December, the parent high had moved far enough to the east so that further cold air advection in the axis of the damming high was greatly diminished. The eastern edge of the high eroded as a coastal warm front moved inland. For example, the temperature at Raleigh-Durham increased from 31 deg F at 1200 UTC to 35 deg F at 1500 UTC and to 41 deg F at 1800 UTC. Hourly data from Asheville, Greer, Hickory, and Charlotte show nearly steady temperatures in the cold air damming region (Table 1). 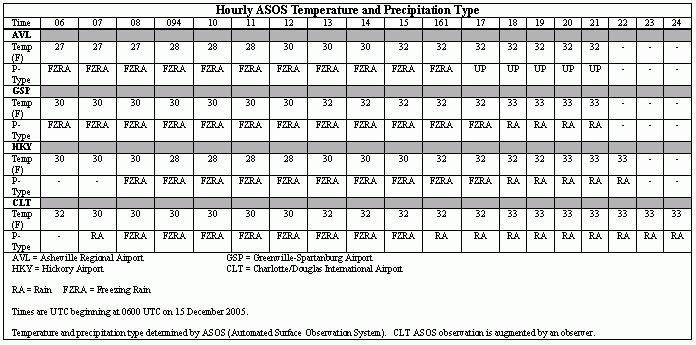
Table 1. Hourly precipitation type at AVL (Asheville), GSP (Greer), HKY (Hickory), and CLT (Charlotte), for the period from 0600 UTC 15 December to 0000 UTC 16 December. 3. Thermal Structure Freezing rain was the predominant precipitation type because the temperature profile in the lower atmosphere consisted of below freezing surface temperatures and above freezing temperatures aloft. Figure 10 displays the North American Mesoscale Model (NAM) 00-hour vertical temperature profile for GSP at 1800 UTC on 14 December. The panel on the right shows the vertical dewpoint, wet bulb, and dry bulb temperature structure. A slight warm nose existed at about 7,000 feet Above Ground Level (AGL), but the wet bulb temperature profile indicated the entire troposphere could be cooled to subfreezing if precipitation were introduced and no warm advection occurred. However, the wind barbs on the right clearly indicated a well- defined southwest flow above approximately 4,000 feet AGL with a veering profile indicative of warm air advection. From the surface to approximately 3,500 feet the wind was blowing from the northeast. The panel on the left side of Fig. 10 shows the universal precipitation type nomogram with a red dot marking the 1000-850 mb and 850-700 mb values. The nomogram indicated the most likely precipitation type, if it occurred, during the subsequent six hours would be snow mixed with freezing rain and sleet. 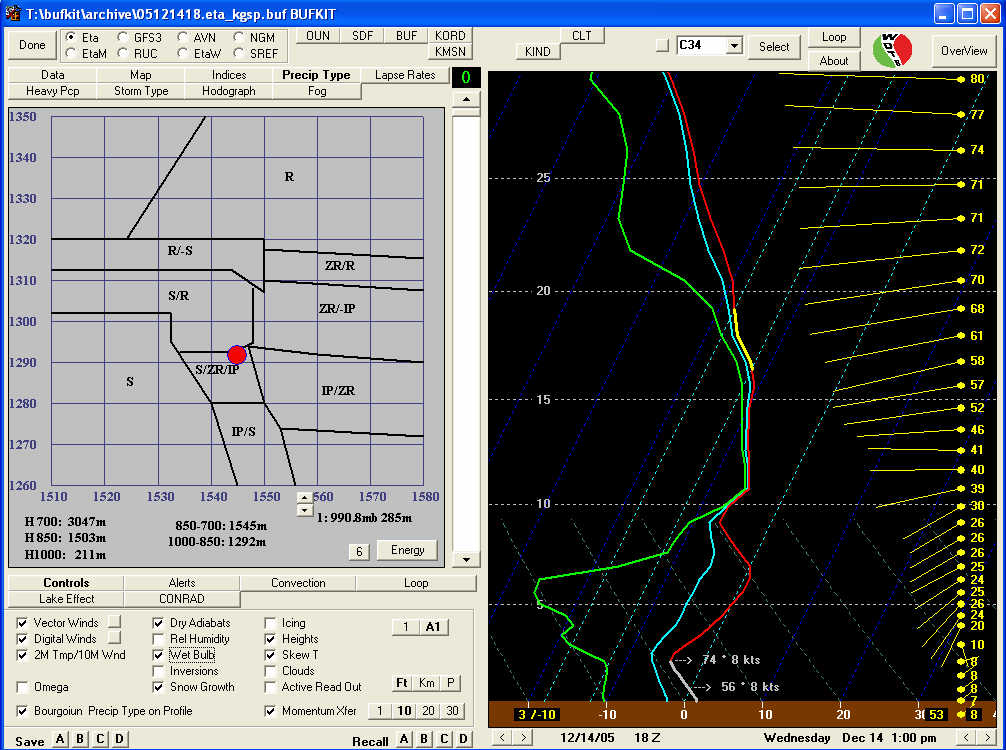
Figure 10. Bufkit display for GSP from 00-Hour NAM at 1800 UTC 14 December. The precipitation type nomogram is shown on the left. The dewpoint, wet bulb temperature, dry bulb temperature, and wind profile is shown on the right. Click on image to enlarge. The eastward progression of the upper level features seen in Figs. 7, 8, and 9 resulted in continued warming just above the cold surface layer. As precipitation spread into the southern Appalachian region, warming aloft continued, but the cold air damming resulted in virtually no change in the surface temperatures which were freezing or below from northeast Georgia through upstate South Carolina into the western Piedmont of North Carolina. Figure 11 shows the NAM 1200 UTC 15 December GSP initial hour profiles and precipitation type nomogram. The most noteworthy feature of this thermal structure was the subfreezing layer extending from the surface to about 2,000 ft AGL. Above the surface-based cold layer, the temperature increased rapidly to approximately 5 deg C at 3,000 ft then cooled to zero deg C near 7,000 ft AGL. A top-down evaluation indicated snow descended into the warm layer where complete melting occurred then the liquid precipitation froze on impact in the colder air at the surface. 
Figure 11. As in Fig. 10 except 1200 UTC on 15 December. Click on image to enlarge. Figure 12 is the 18-hour NAM GSP forecast valid at 1200 UTC on 15 December 2005. The temperature and moisture profiles on the right were quite similar to the 1200 UTC initial analysis in Fig. 11. A subfreezing layer with northeast winds was capped by a warm layer and southwest winds veering with height. The universal nomogram values on the left indicated that freezing rain would be the predominant precipitation type during the next six hours. The path depicted by the increasingly large dots on the nomogram provided a guide regarding the trend of the precipitation type forecasts. The significant warming of the 850-700 mb layer during the three most recent hours was compatible with the veering wind and warm advection that occurred just above the surface. 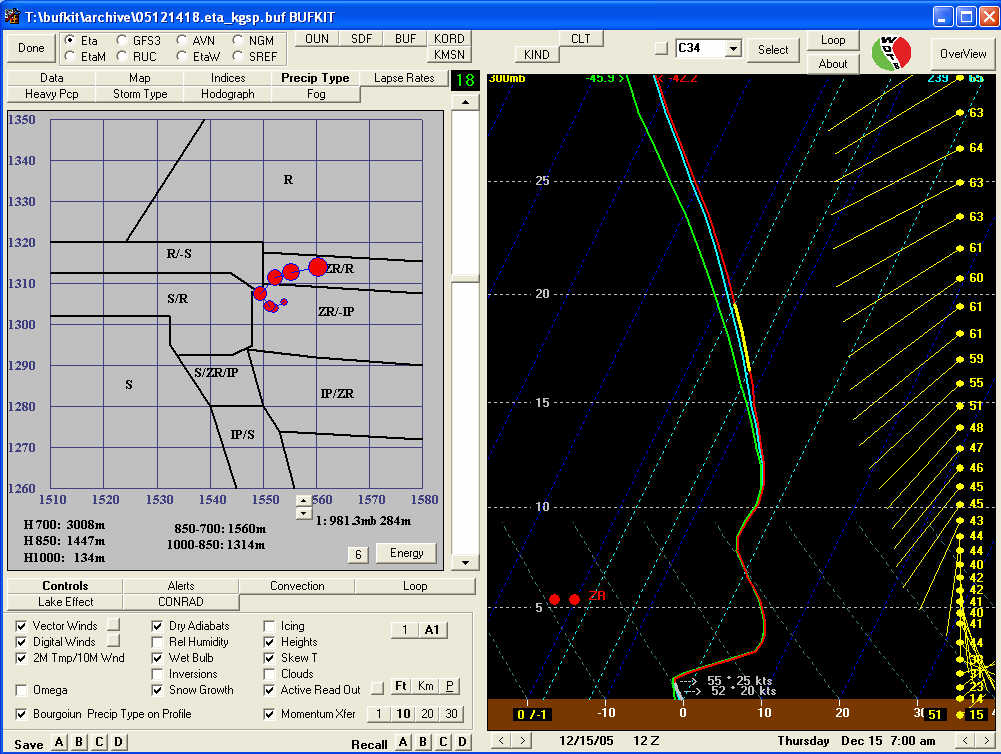
Figure 12. As in Fig. 10, except 18-hour forecast for GSP verifying at 1200 UTC on 15 December. Click on image to enlarge. Other numerical guidance provided an indication that a freezing rain event was likely. Figure 13 is an example from the National Centers for Environmental Prediction (NCEP) Short Range Ensemble Forecast (SREF) model run at 0900 UTC on 13 December 2005. The forecast panels are three-hour forecasts valid at 1200 UTC on 15 December. The panel in the lower right hand corner indicated much of the Greenville-Spartanburg CWA was susceptible to freezing rain. 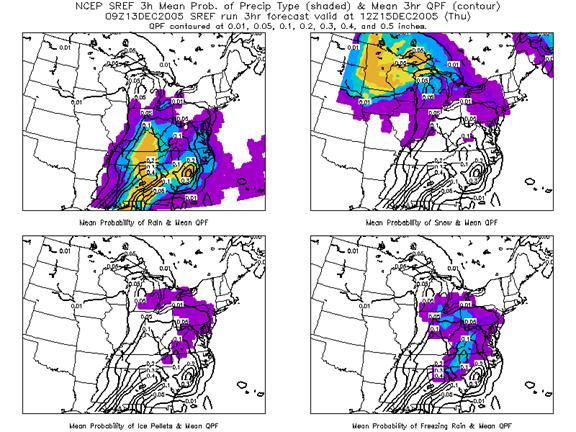
Figure 13. NCEP SREF three hour mean probability of precipitation (shaded) and mean three hour QPF (contour) from the 0900 UTC 13 December 2005 run valid at 1200 UTC 15 December. Click on image to enlarge. Another indicator of the significance of the warm air advection was the rapid temperature increase at Wayah Bald (elevation 5469 ft MSL) in Macon County, North Carolina. Figure 14 is a temperature trace from the North Carolina Environment and Climate Observing Network (ECONET) station on the top of the mountain. The temperature climbed from 18 deg F around sunrise on 14 December to the lower 30s by midnight on 15 December. The temperature peaked at 35 deg F during the morning of 15 December, but it dropped into the teens later that night. An interesting feature of this event is the shallow nature of the warm air layer depicted in the GSP Bufkit profiles and the Wayah Bald temperature record. The warmest portion of the layer remained below some of the highest elevations in the southern Appalachians. The National Weather Service cooperative observer at Mt. Mitchell, NC measured ten inches of snow. Three to ten inches of snow fell along the Blue Ridge Parkway near Mt. Mitchell State Park. NWS cooperative observers at Newfound Gap and Mt. LeConte in the Great Smoky Mountain National Park measured 10 and 11 inches of snow, respectively. Sleet mixed with snow produced local accumulations ranging from one to four inches in a narrow band extending from southeastern Buncombe County through Yancey, Mitchell, and Avery counties. 
Figure 14. Wayah Bald, NC 2 meter temperature during the week of 12 December 2005. Vertical bars identify 15 December (EST). Click on image to enlarge. While the warming was occurring just above the surface, the low-level pool of cold air that formed as a result of cold air damming persisted throughout the day on 15 December. The rising temperatures in the warm layer just above the surface contributed to maintenance of the cold air resting against the eastern slopes of the Appalachians. The strong inversion resulting from the differential temperature advection provided a buffer resisting the incursion of low level warm air from the south and east accompanying the eastward motion of the surface low pressure and the inland progression of the coastal warm front. By mid to late afternoon, however, surface temperatures were above 32 deg F in all areas except some of the mountain valleys and in a very narrow zone along the foot of the Blue Ridge escarpment. The precipitation ended across the entire area by 0000 UTC on 16 December. Precipitation totals (liquid equivalent) for the event included the following: Anderson, 1.52 inches; Asheville, 1.48 inches; Charlotte, 1.76 inches; and Greenville-Spartanburg, 1.55 inches. Some of the rain fell while temperatures were above freezing, and the rate of precipitation during the period of subfreezing temperatures was great enough so that much of the rain dripped to the ground before freezing occurred. 4. Summary A low pressure system traveling across the Southeast during a period of cold air damming on 15 December 2005 caused a significant icing event for portions of the western Carolinas and extreme northeast Georgia. Ice accumulations of at least one quarter inch were common across Upstate South Carolina, a portion of the North Carolina Mountains, and the Foothills and western Piedmont of North Carolina. Local ice thicknesses of approximately one inch were reported in the area bounded roughly by Greenville, South Carolina, and Tryon and Hendersonville, North Carolina. Freezing rain was the predominant precipitation type because a layer of warm air between approximately 2,000 ft and 6,000 ft AGL spread across the surface based cold air. The precipitation formed as snow then melted as it fell into the warm air. The liquid precipitation froze on contact with objects in the surface based cold air. Snow accumulated on some of the high elevations in western North Carolina that extended above the warm layer. Acknowledgements
The authors wish to thank Neil Dixon for assistance with converting the original document to html. Figures 2, 3, 4, 5, 7, and 8 are courtesy of the NOAA/NWS/NCEP Storm Prediction Center. Figure 13 is courtesy of the NOAA/NWS/NCEP Environmental Modeling Center. Figure 14 was obtained from the State Climate Office of North Carolina.  |


