
Dangerous and extreme heat will remain across portions of the southern U.S. through the weekend. A heat wave over the Southwest U.S. will intensify this week, peaking and expanding into the Intermountain West and northern High Plains this weekend. Multiple rounds of thunderstorms will produce heavy to excessive rainfall with significant flash flooding across portions of southern New England. Read More >
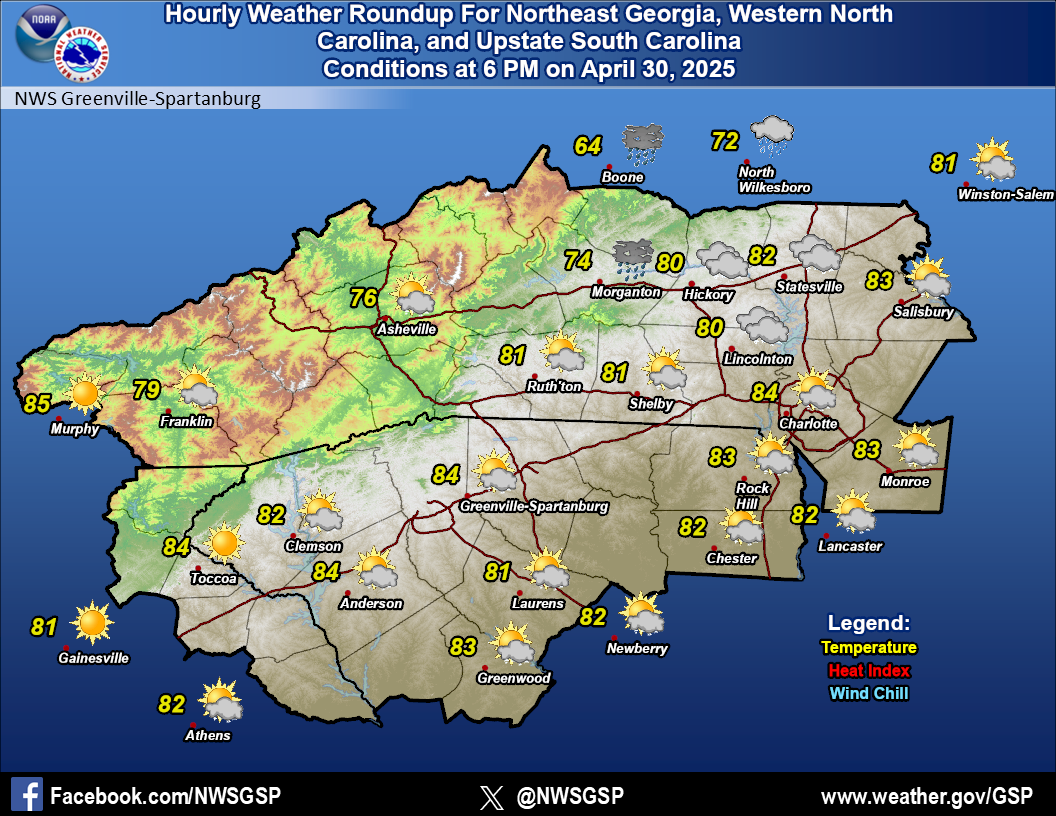
Greenville-Spartanburg, SC
Weather Forecast Office


| Drought.gov Additional Maps for NC |
| Soil Anomaly Map |
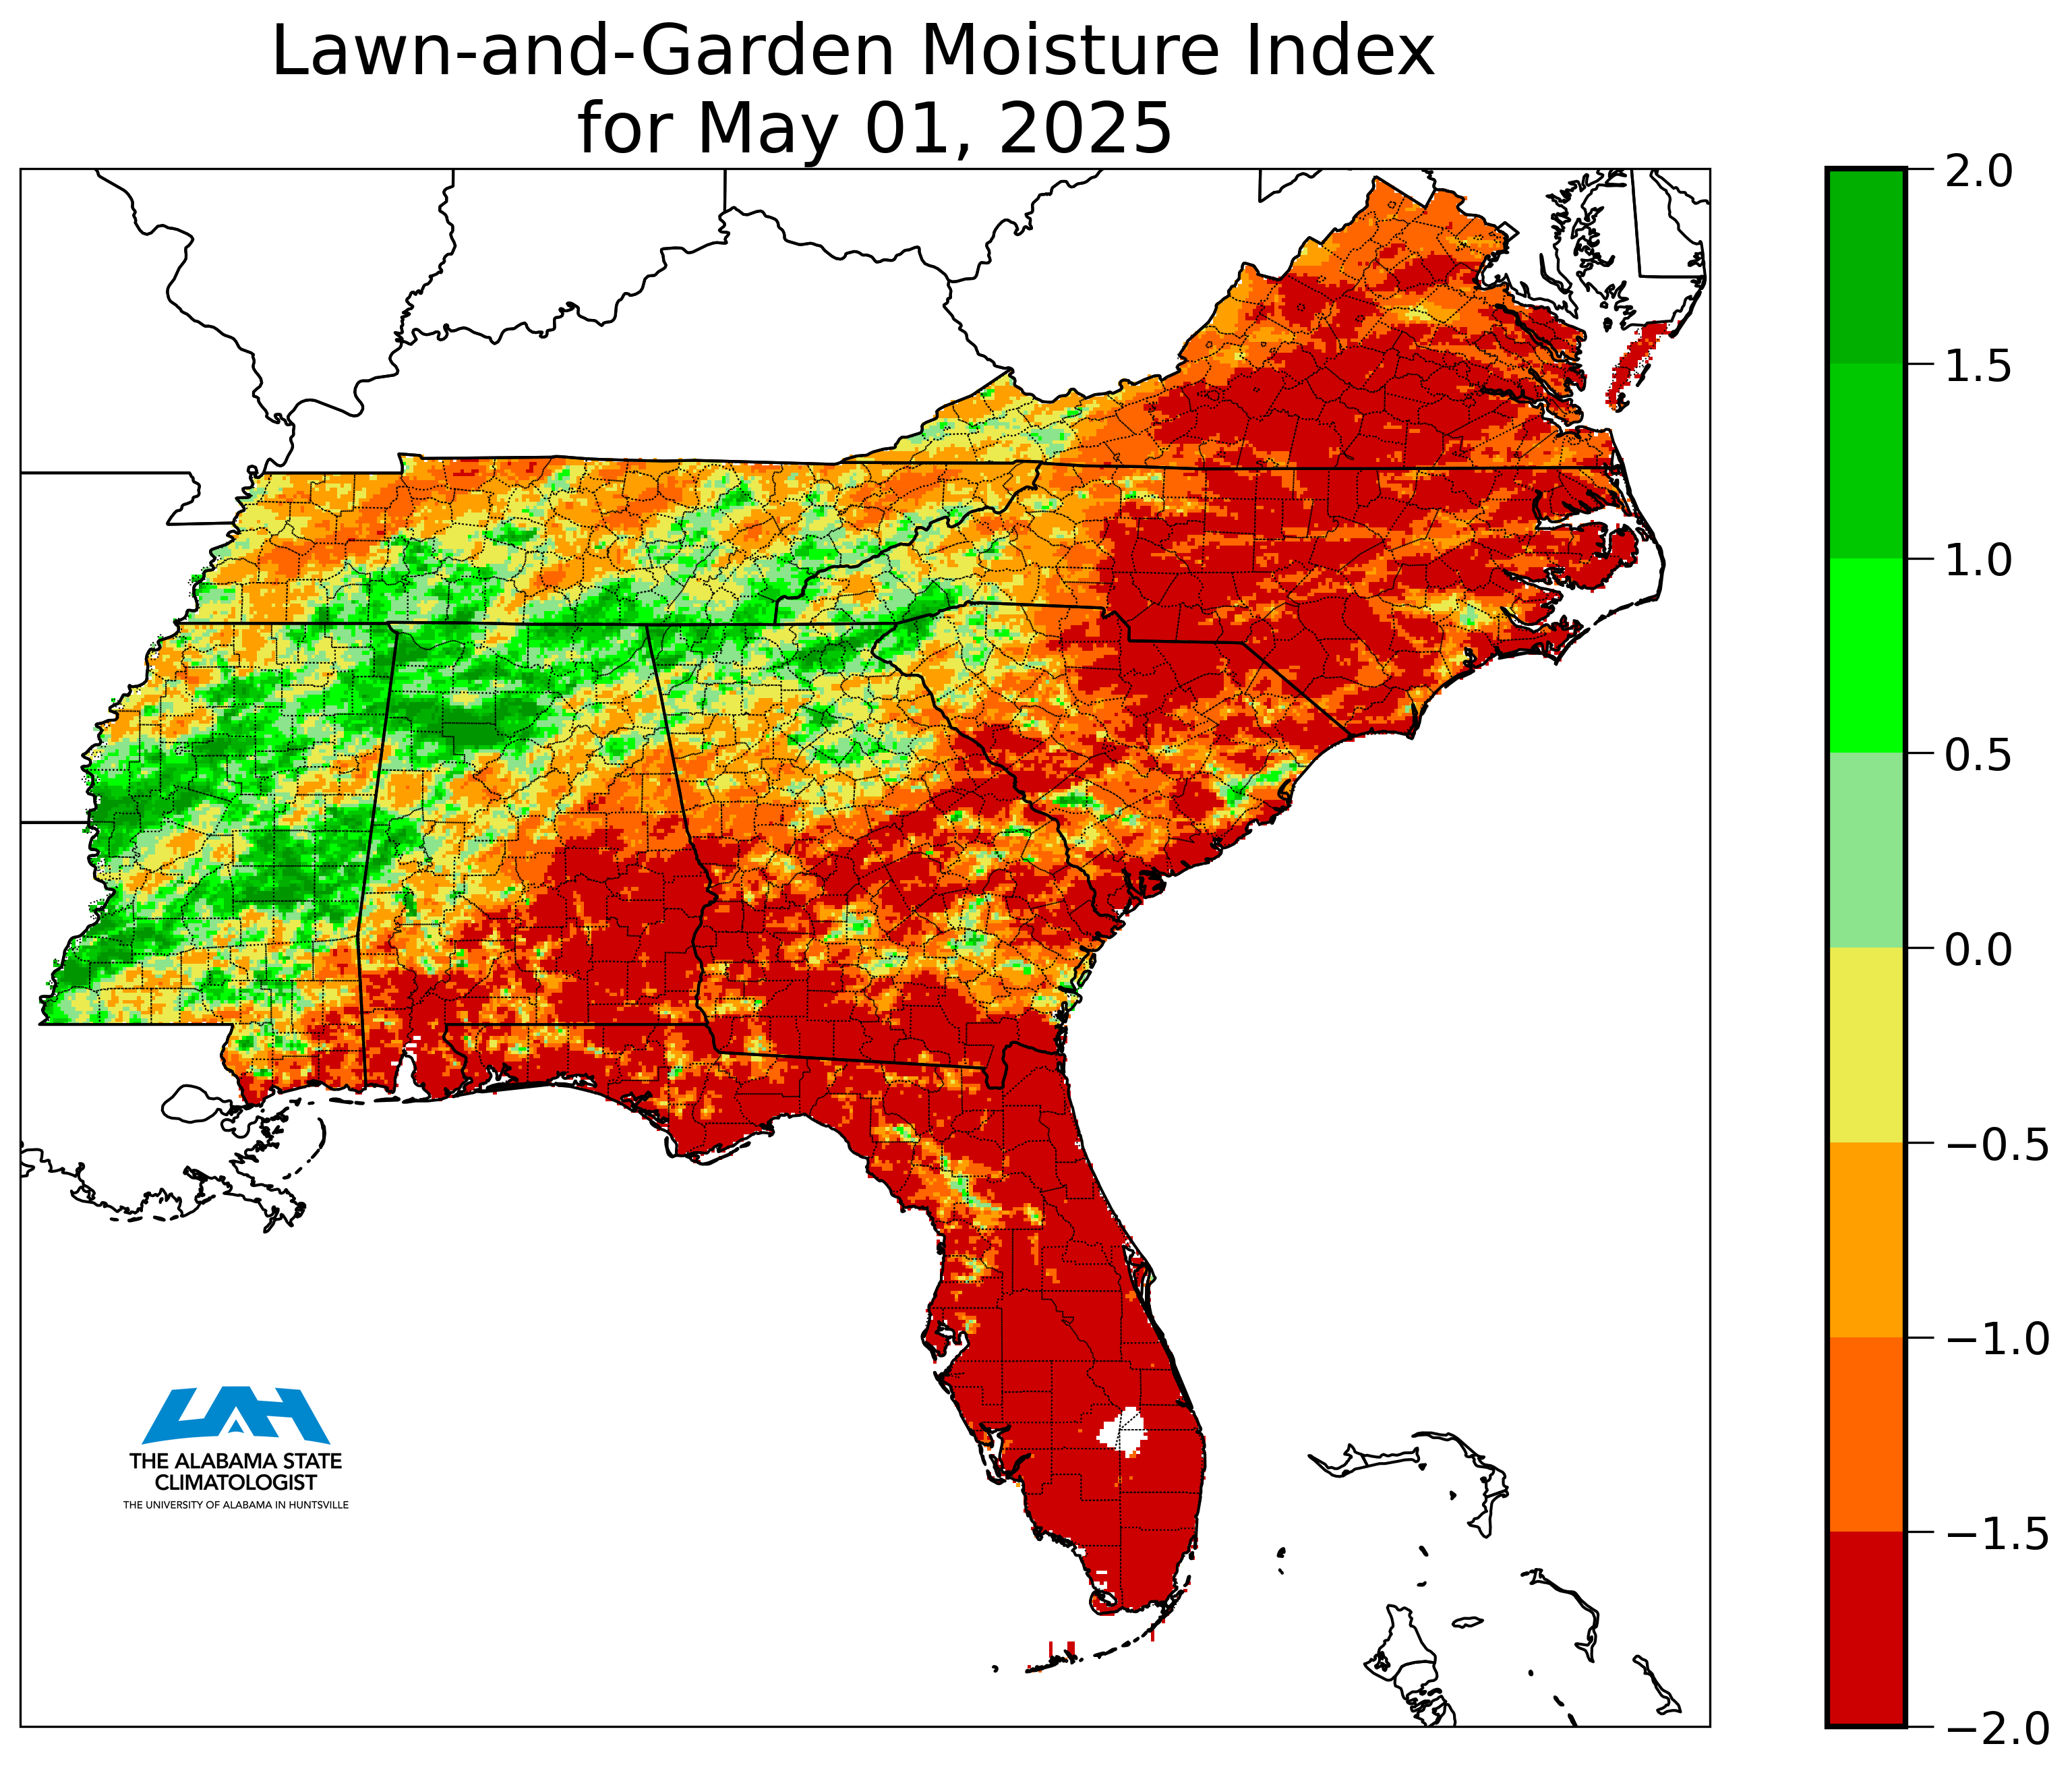
| Crop Moisture Index |
| Palmer Index |
| YTD Rainfall Deficit/Surplus |
| USGS Water Conditions for NC, SC, GA |

Hazards
Severe Thunderstorms
Tropical Weather
Winter Weather
Storm Prediction Center
National Hurricane Center
Space Weather
Hydrology
Stream Level Forecasts
Precipitation Forecasts
Past Precipitation
Stream and Lake Levels
Stream/Lake Levels (List)
Forecast
Weather Activity Planner
Aviation Weather
Graphical Forecasts
Weather Prediction Center
Long Range Forecast
Model Data
US Dept of Commerce
National Oceanic and Atmospheric Administration
National Weather Service
Greenville-Spartanburg, SC
GSP International Airport
1549 GSP Drive
Greer, SC 29651
(864) 848-3859
Comments? Questions? Please Contact Us.


 Hourly Weather