Overview
General Summary: During the evening of January 2, low pressure began to strengthen over Alabama/Georgia as a upper shortwave in the southern stream began to take on a neutral tilt as it tracked over the Tennessee Valley. Meanwhile, a cold front was moving southward across the local area while cold high pressure was centered from the Plains to Great Lakes. Temperatures were still in the 60s with rain and a few thunderstorms across the Wakefield CWA during the evening of 1/2 as the cold front approached. The front eventually moved just to the south of the Wakefield CWA by the early morning on 1/3 as the low started to rapidly deepen as it tracked ENE into South Carolina. Colder air quickly filtered in behind the front as steady precipitation was ongoing, dropping temperatures into the 30s-40s by 4-5 AM on 1/3. Precipitation already changed to sleet/snow across NW portions of the CWA by 5 AM. By 7-8 AM, the rain/sleet/snow line had moved into the Richmond Metro as moderate to heavy precipitation was ongoing thanks to intense frontogenetic forcing. Snowfall rates of 1-2"+ per hour were observed just NW of the metro area with heavy rain and (elevated) thunderstorms across SE VA and NE NC. The rain/snow line did not progress much to the SE through 9-10 AM largely due to a warm layer between 850 and 700 mb that kept the precipitation in the form of rain or sleet. Finally during the late morning through early afternoon, precipitation quickly changed over to snow from NW-SE across the entire area as the very strong area of low pressure moved offshore. Temperatures dropped to 29-33F across much of the area by mid afternoon. A widespread 6-11" (with locally higher totals) of heavy, wet snow fell from the central Virginia Piedmont to Dorchester County, MD. 2 to 7 inches fell from the Richmond metro to the rest of the Lower Eastern Shore, while only a trace to 2 inches fell over south/southeast VA. In addition, moderate to major tidal flooding was observed in the Lower Chesapeake Bay and Atlantic coast of SE VA and NE NC due to strong NE winds (with gusts over 50 mph at times).
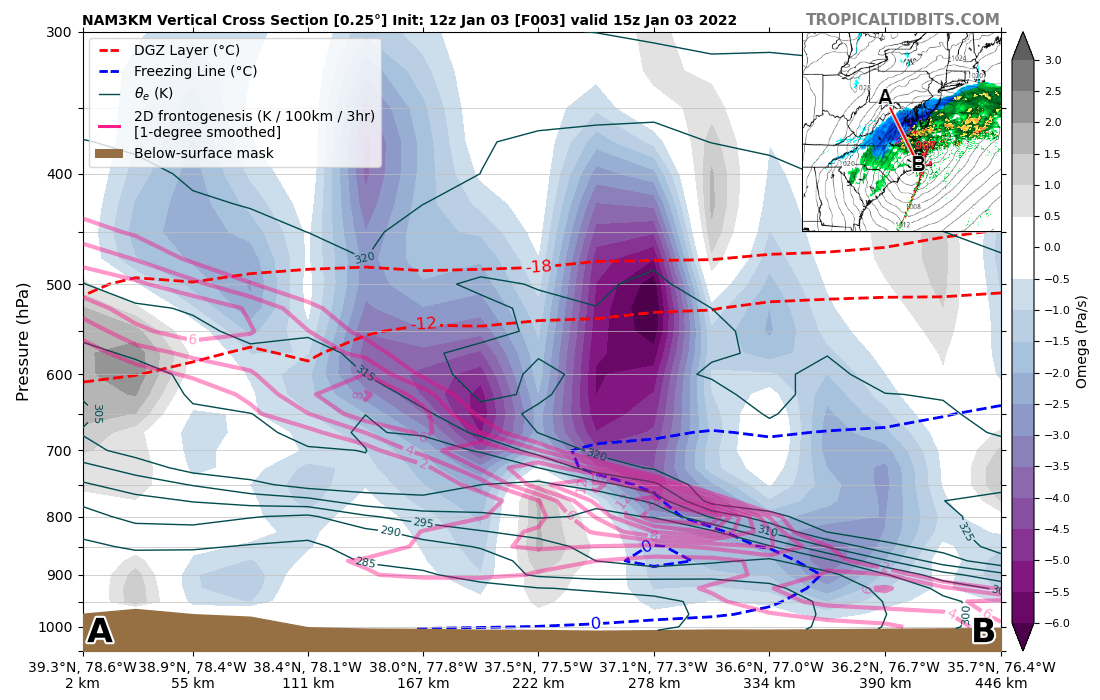
Snow: A strong band of frontogenetic forcing around 700 mb, along with plenty of slantwise instability (as evidenced by negative EPV and model cross sections). In addition there was even a little bit of elevated CAPE in the area where it was snowing during the morning. This led to intense banded snowfall that produced rates in excess of 1-2" per hour at times. While the best frontogenetic forcing generally stayed just to the NW of the Richmond Metro (and extended into Dorchester County, MD) through much of the morning, it gradually moved into the metro area during the late morning-early afternoon, allowing for some areas to pick up a quick few inches of snow. The bands of snow weakened as they moved into SE VA as the low pressure system quickly exited to the northeast. The weight of the heavy, wet snow downed several trees across the NW portion of our area, resulting in widespread power outages. There were several counties where 70-90% of residents were without power. At the peak of the event, nearly 450,000 residents were estimated to be without power in the state of Virginia. For many parts of our area, this was the largest snow event since 12/9/2018. In Louisa and Goochland Counties, the tree/infrastructure damage was on par with what occurred during Hurricane Isabel. The excessive amounts of heavy, wet snow were largely responsible for a closure of a portion of I-95 from Caroline County to north of the CWA border that lasted over 24 hours.
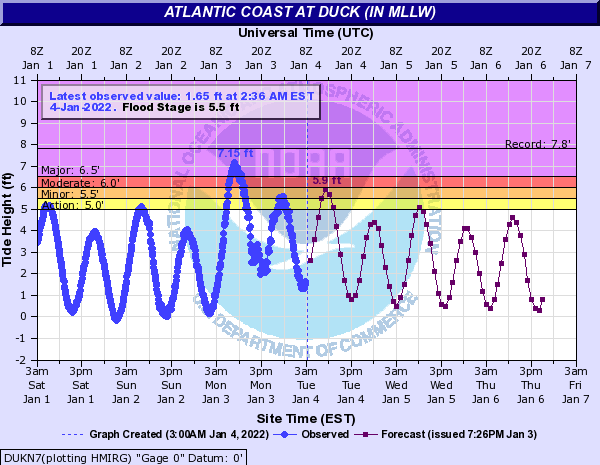
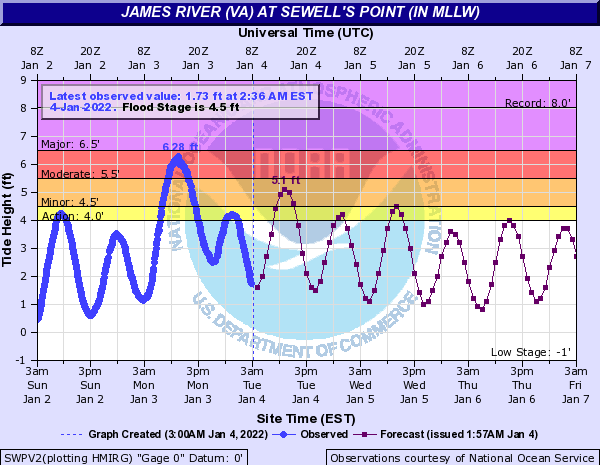
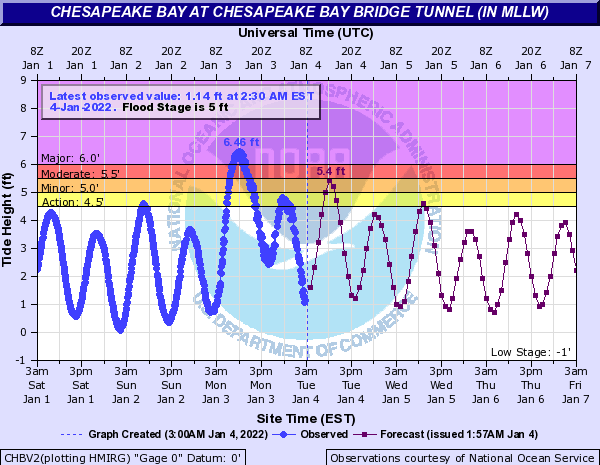
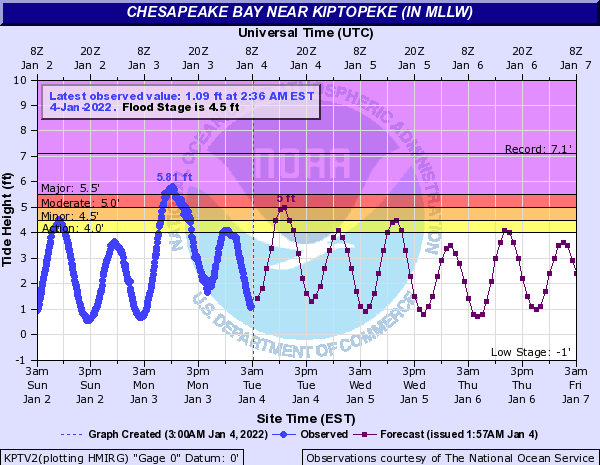
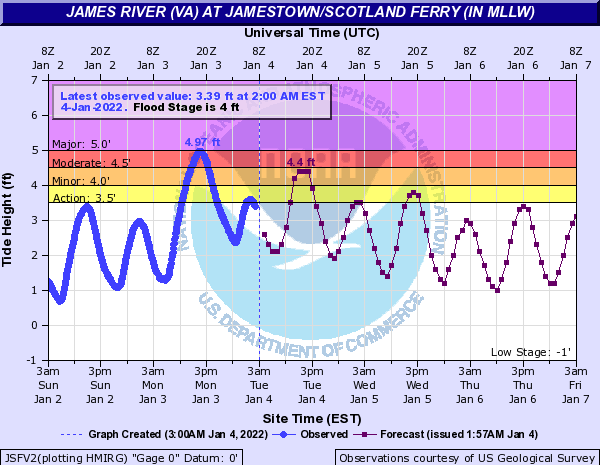
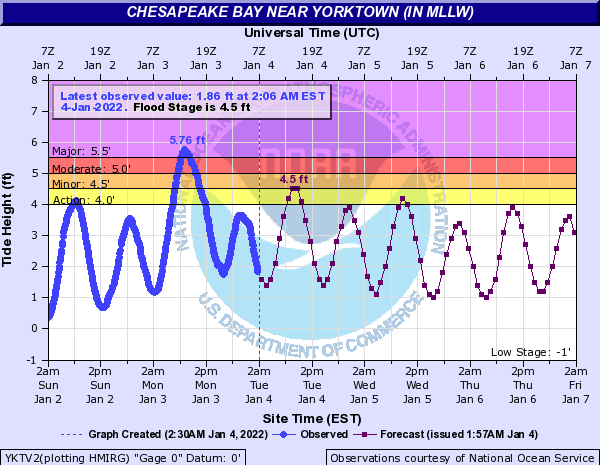
Tidal Flooding/Wind: The tightening pressure gradient just to the north of the surface low allowed for northeast winds to gust to 50+ mph during the morning through afternoon on 1/3, with occasional gusts of 60-70+ mph in a few locations. This allowed for water to rapidly surge into the Lower Chesapeake Bay and Atlantic coast of VA and NC. As mentioned above, moderate to major tidal flooding was observed in these areas. In fact, water levels at Sewell's Point (and other locations) eclipsed levels seen during recent tropical events (such as Hurricane Dorian).
Tidal Flooding
Hydrographs
 |
 |
 |
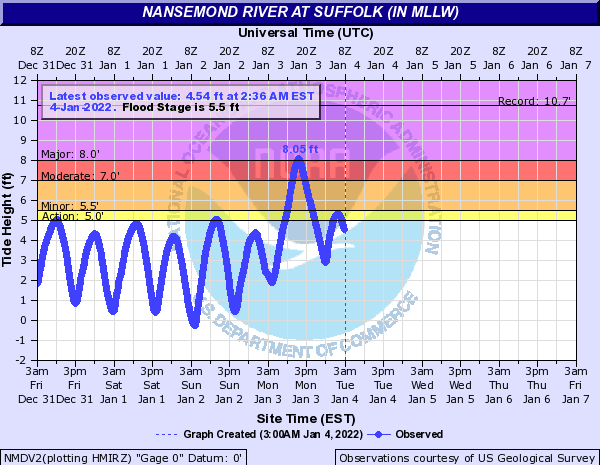 |
| Duck, NC | Sewell's Point, VA | Chespeake Bay Bridge Tunnel, VA | Nansemond River at Suffolk, VA |
 |
 |
 |
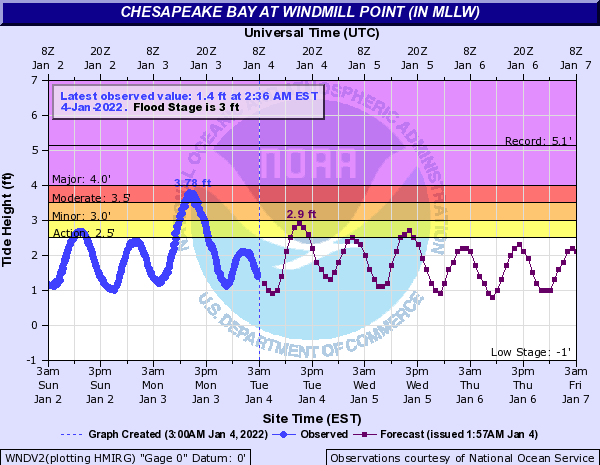 |
| Kiptopeke, VA | Jamestown, VA | Yorktown USCG, VA | Windmill Point, VA |
Snowfall Totals
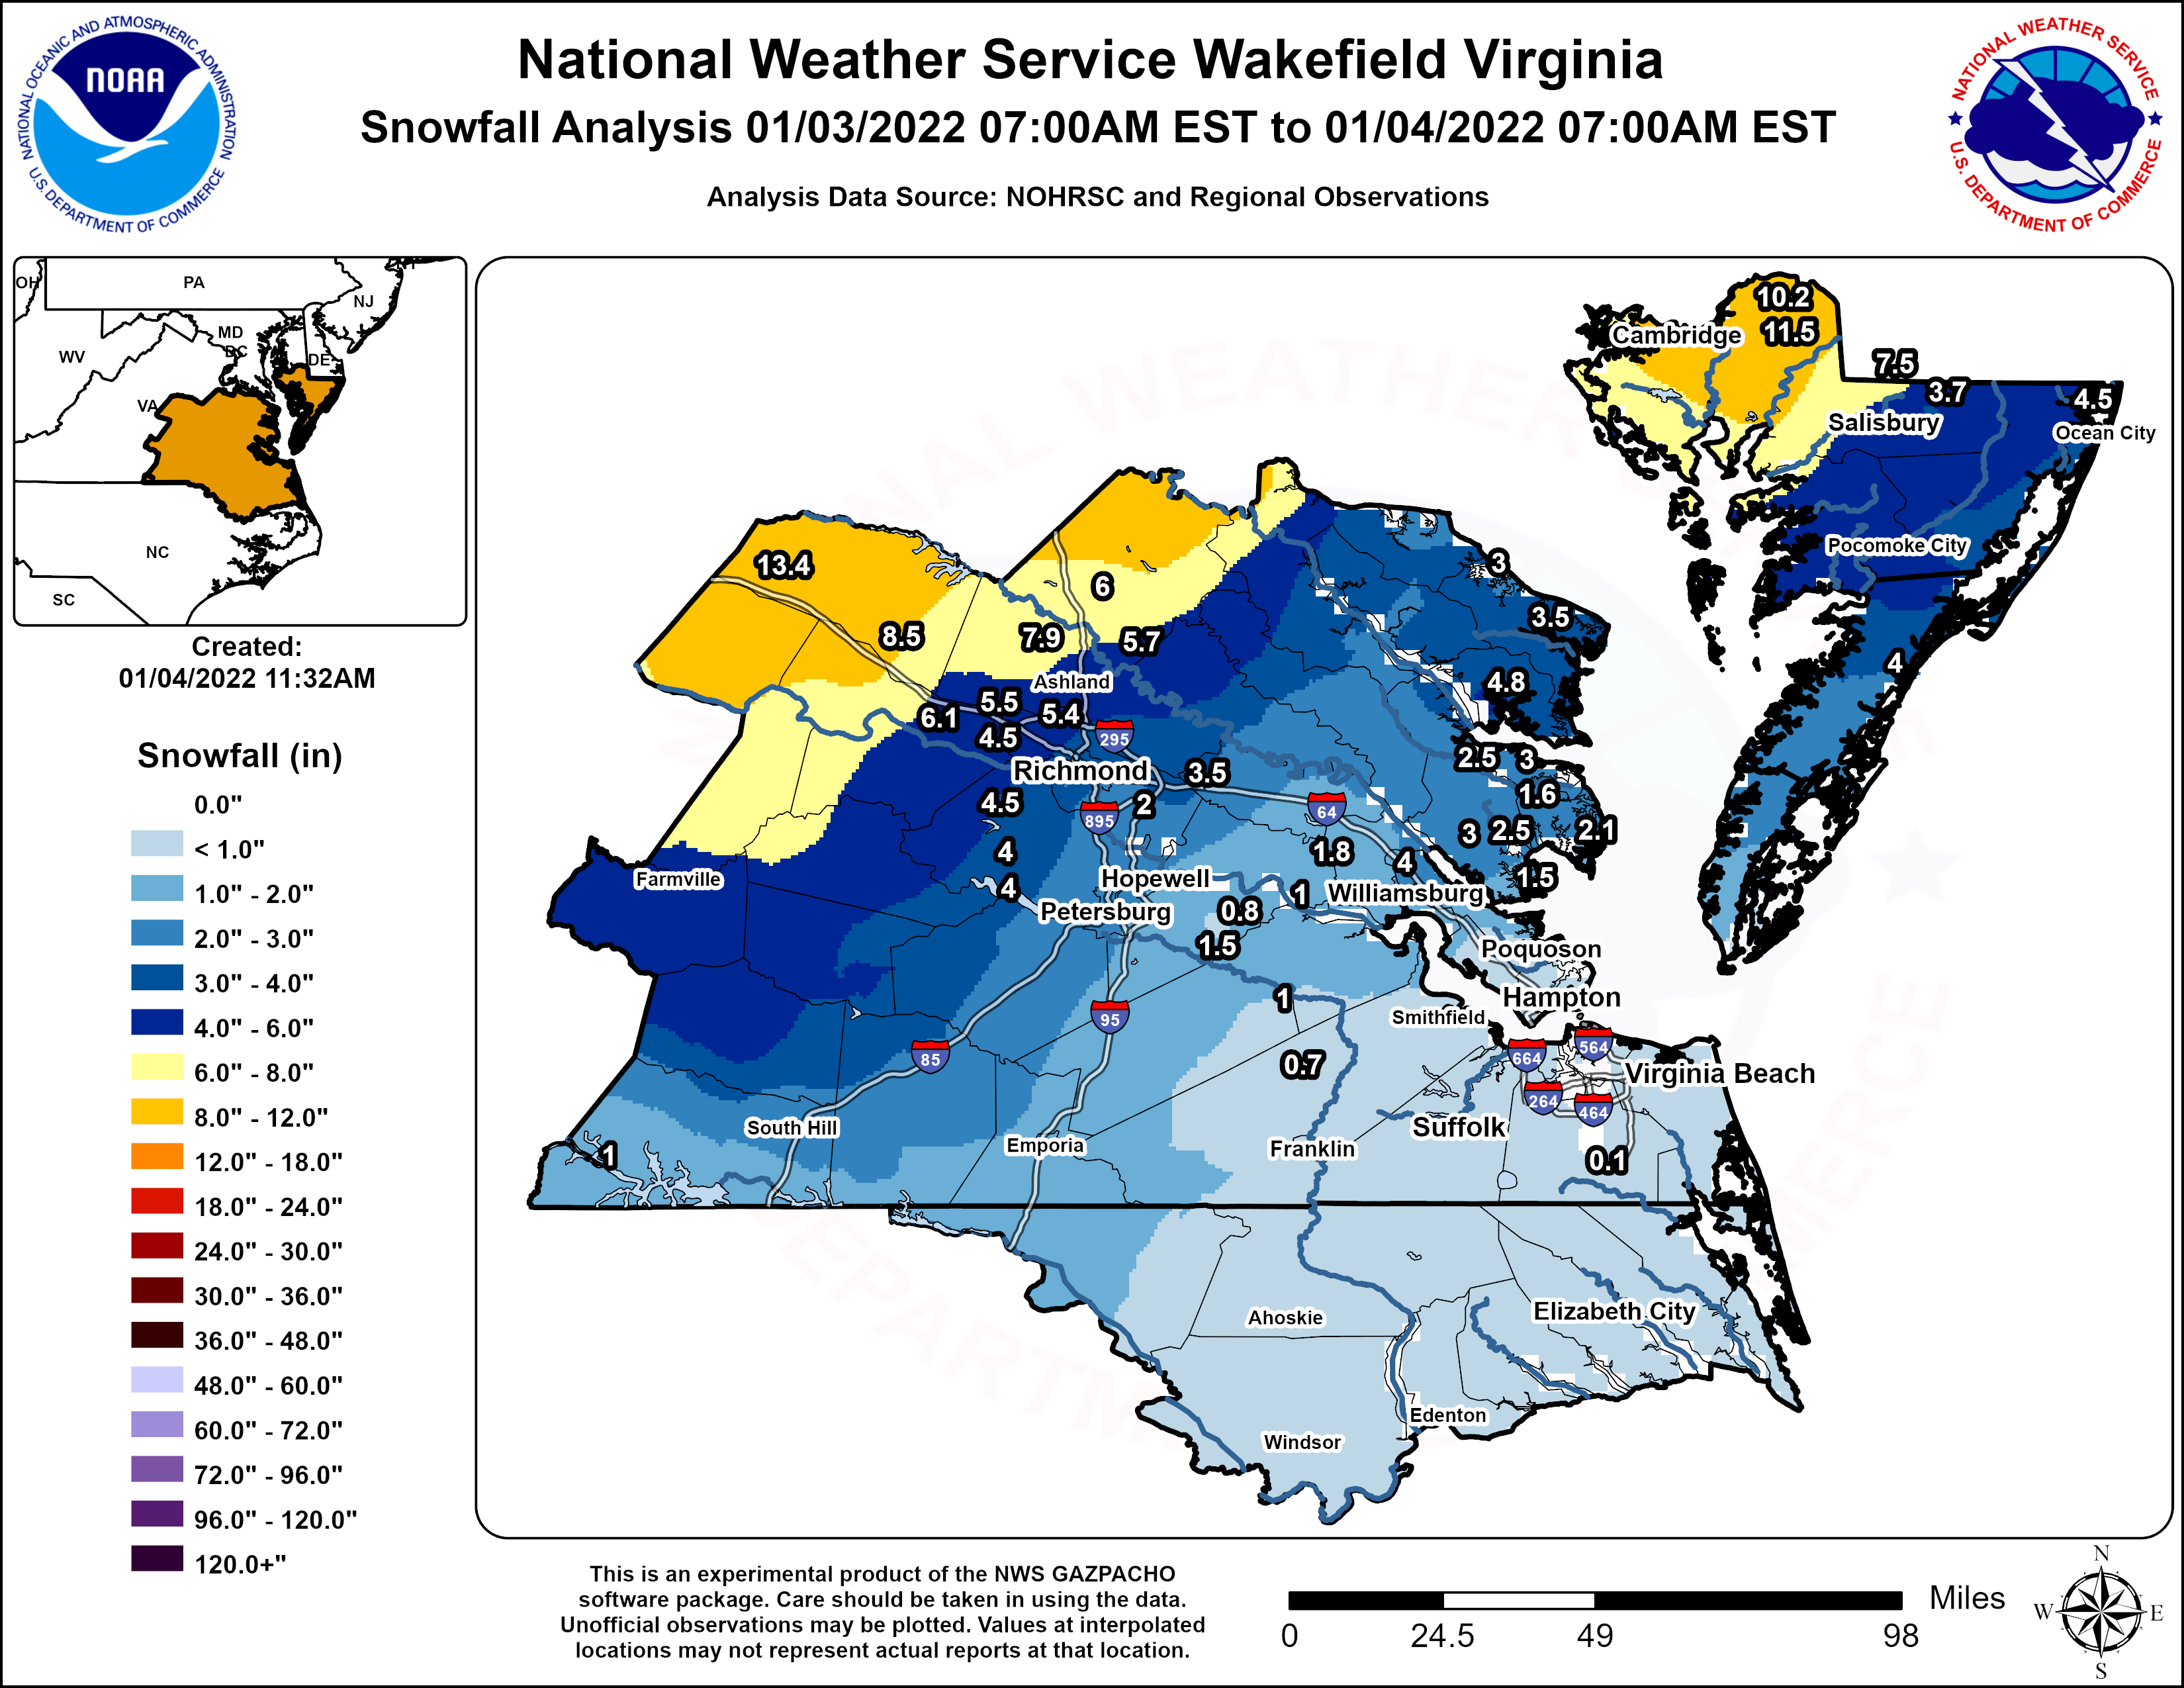

Public Information Statement
National Weather Service Wakefield VA
1124 AM EST Tue Jan 4 2022

...SNOWFALL REPORTS...

Location                     Amount    Time/Date       Lat/Lon

...Maryland...

...Dorchester County...
East New Market 1.9 SE       11.5 in   0400 AM 01/04   38.58N/75.90W
Hurlock 1.9 SW               10.2 in   0600 AM 01/04   38.61N/75.89W

...Wicomico County...
Delmar 0.2 NE                7.5 in    0530 AM 01/04   38.45N/75.57W
Lakewood                     4.5 in    0500 PM 01/03   38.33N/75.60W
Parsonsburg 1.6 WNW          3.7 in    0700 AM 01/04   38.39N/75.50W

...Worcester County...
Ocean Pines 0.9 SSW          4.5 in    0800 AM 01/04   38.37N/75.16W

...Virginia...

...Accomack County...
Metompkin 0.9 SE             4.0 in    0700 AM 01/04   37.76N/75.59W

...Caroline County...
Ruther Glen 1.7 ENE          6.0 in    0700 AM 01/04   37.94N/77.43W
Hanover 3.0 N                5.7 in    0700 AM 01/04   37.81N/77.36W

...Chesterfield County...
Moseley 1.7 NNE              4.5 in    0700 AM 01/04   37.44N/77.70W
3.9 SW Beach                 4.0 in    0700 AM 01/04   37.32N/77.65W
Chesterfield 8.5 WSW         4.0 in    0700 AM 01/04   37.33N/77.64W

...City of Chesapeake County...
Chesapeake 1.8 NE            0.1 in    0700 AM 01/04   36.69N/76.28W

...City of Newport News County...
Newport News 5.8 N           1.0 in    0700 AM 01/04   37.16N/76.52W
Newport News 2.5 ESE         0.3 in    0700 AM 01/04   37.06N/76.47W

...City of Norfolk County...
Norfolk 5.0 SSW               T in     0700 AM 01/04   36.86N/76.29W

...City of Portsmouth County...
Portsmouth 4.1 SSE           0.1 in    0700 AM 01/04   36.80N/76.33W

...City of Richmond County...
Richmond 3.9 NW              3.5 in    0615 AM 01/04   37.58N/77.52W
Richmond 2.2 N               3.5 in    0730 AM 01/04   37.56N/77.47W
Richmond 1.1 SE              3.5 in    0730 AM 01/04   37.52N/77.46W
Richmond 4.2 NNE             3.4 in    0700 AM 01/04   37.59N/77.45W
Richmond 1.7 N               3.3 in    0700 AM 01/04   37.56N/77.47W
Richmond 1.1 WSW             3.0 in    0700 AM 01/04   37.52N/77.49W

...City of Williamsburg County...
Williamsburg 1.4 ENE         2.0 in    0700 AM 01/04   37.28N/76.68W

...Gloucester County...
Gloucester Courthouse 3.3 SS 3.0 in    0700 AM 01/04   37.37N/76.55W
Gloucester Courthouse 2.1 S  2.5 in    0700 AM 01/04   37.38N/76.52W
Gloucester Courthouse 7.1 NN 1.6 in    0800 AM 01/04   37.50N/76.47W
Gloucester Point 2.4 E       1.5 in    0700 AM 01/04   37.26N/76.45W

...Goochland County...
Manakin-Sabot 1.6 SW         6.1 in    0700 AM 01/04   37.63N/77.74W

...Hanover County...
Montpelier 4.8 E             7.9 in    0745 AM 01/04   37.82N/77.59W

...Henrico County...
Glen Allen 6.6 W             5.5 in    0700 AM 01/04   37.67N/77.60W
Glen Allen 4.6 W             5.4 in    0759 AM 01/04   37.66N/77.57W
Henrico 5.8 W                4.5 in    0830 AM 01/04   37.64N/77.65W
Richmond 5.3 NW              4.3 in    0700 AM 01/04   37.59N/77.54W
Sandston 5.9 ESE             3.5 in    0717 AM 01/04   37.51N/77.21W
Montrose 4.7 SSE             2.0 in    0700 AM 01/04   37.46N/77.35W

...James City County...
Toano 1.1 SSW                1.8 in    0700 AM 01/04   37.37N/76.81W
Williamsburg 6.5 NW          1.5 in    0700 AM 01/04   37.35N/76.77W
Williamsburg 3.2 NW          1.3 in    0800 AM 01/04   37.30N/76.75W

...Lancaster County...
Urbanna 6.2 NNE              4.8 in    0700 AM 01/04   37.72N/76.52W

...Louisa County...
Gordonsville 10.4 S          13.4 in   0700 AM 01/04   37.99N/78.21W
Gum Spring 3.5 NNW           8.5 in    0600 AM 01/04   37.82N/77.92W

...Mathews County...
Port Haywood 1.0 SE          2.1 in    0700 AM 01/04   37.37N/76.31W

...Mecklenburg County...
Clarksville                  1.0 in    0700 AM 01/04   36.62N/78.57W

...Middlesex County...
White Stone 8.0 SSW          3.0 in    0700 AM 01/04   37.54N/76.44W
Hartfield 2.9 W              2.5 in    0700 AM 01/04   37.54N/76.50W

...Northumberland County...
Heathsville 4.6 SE           3.5 in    0700 AM 01/04   37.87N/76.42W
Lottsburg 2.3 NNE            3.0 in    0700 AM 01/04   37.99N/76.51W

...Prince George County...
1.6 SE Disputanta            1.5 in    0700 AM 01/04   37.11N/77.20W
Disputanta 6.3 NE            0.8 in    0700 AM 01/04   37.19N/77.15W

...Southampton County...
Sedley 3.7 N                 0.7 in    0700 AM 01/04   36.83N/76.99W

...Surry County...
Claremont 0.2 SW             1.0 in    0700 AM 01/04   37.23N/76.97W

...Sussex County...
1.5 NW Wakefield             1.0 in    1200 AM 01/04   36.98N/77.01W

...York County...
2.1 N Williamsburg           4.0 in    1200 AM 01/04   37.30N/76.70W
&&

**METADATA**
:1/04/2022,0600 AM, MD, Dorchester, Hurlock 1.9 SW, , , 38.6086, -75.8949, SNOW_24, 10.2, Inch, COCORAHS, 24 hour snowfall,
:1/04/2022,0400 AM, MD, Dorchester, East New Market 1.9 SE, , , 38.5795, -75.8988, SNOW_24, 11.5, Inch, COCORAHS, 24 hour snowfall,
:1/04/2022,0700 AM, MD, Wicomico, Parsonsburg 1.6 WNW, , , 38.3904, -75.5027, SNOW_24, 3.7, Inch, COCORAHS, 24 hour snowfall,
:1/03/2022,0500 PM, MD, Wicomico, Lakewood, , , 38.331862756577, -75.595625731252, SNOW, 4.5, Inch, Cocorahs, Storm total snowfall,
:1/04/2022,0530 AM, MD, Wicomico, Delmar 0.2 NE, , , 38.4543, -75.573, SNOW_24, 7.5, Inch, COCORAHS, 24 hour snowfall,
:1/04/2022,0800 AM, MD, Worcester, Ocean Pines 0.9 SSW, , , 38.3722, -75.1585, SNOW_24, 4.5, Inch, COCORAHS, 24 hour snowfall,
:1/04/2022,0700 AM, VA, Accomack, Metompkin 0.9 SE, , , 37.7608, -75.5908, SNOW_24, 4, Inch, COCORAHS, 24 hour snowfall,
:1/04/2022,0700 AM, VA, Caroline, Hanover 3.0 N, , , 37.81, -77.3631, SNOW_48, 5.7, Inch, COCORAHS, 48 hour snowfall,
:1/04/2022,0700 AM, VA, Caroline, Ruther Glen 1.7 ENE, , , 37.9382, -77.427, SNOW_24, 6, Inch, COCORAHS, 24 hour snowfall,
:1/04/2022,0700 AM, VA, Chesterfield, 3.9 SW Beach, , , 37.3242, -77.6517, SNOW_48, 4, Inch, COOP, 48 hour snowfall,
:1/04/2022,0700 AM, VA, Chesterfield, Chesterfield 8.5 WSW, , , 37.3252, -77.6443, SNOW_48, 4, Inch, COCORAHS, 48 hour snowfall,
:1/04/2022,0700 AM, VA, Chesterfield, Moseley 1.7 NNE, , , 37.4393, -77.6976, SNOW_48, 4.5, Inch, COCORAHS, 48 hour snowfall,
:1/04/2022,0700 AM, VA, City of Chesapeake, Chesapeake 1.8 NE, , , 36.6938, -76.282, SNOW_24, 0.1, Inch, COCORAHS, 24 hour snowfall,
:1/04/2022,0700 AM, VA, City of Newport News, Newport News 2.5 ESE, , , 37.0633, -76.4712, SNOW_24, 0.3, Inch, COCORAHS, 24 hour snowfall,
:1/04/2022,0700 AM, VA, City of Newport News, Newport News 5.8 N, , , 37.1603, -76.5179, SNOW_24, 1, Inch, COCORAHS, 24 hour snowfall,
:1/04/2022,0700 AM, VA, City of Norfolk, Norfolk 5.0 SSW, , , 36.8617, -76.2923, SNOW_72, 0.001, Inch, COCORAHS, 72 hour snowfall,
:1/04/2022,0700 AM, VA, City of Portsmouth, Portsmouth 4.1 SSE, , , 36.801, -76.327, SNOW_48, 0.1, Inch, COCORAHS, 48 hour snowfall,
:1/04/2022,0700 AM, VA, City of Richmond, Richmond 1.1 WSW, , , 37.5235, -77.4923, SNOW_24, 3, Inch, COCORAHS, 24 hour snowfall,
:1/04/2022,0700 AM, VA, City of Richmond, Richmond 1.7 N, , , 37.5554, -77.4693, SNOW_48, 3.3, Inch, COCORAHS, 48 hour snowfall,
:1/04/2022,0700 AM, VA, City of Richmond, Richmond 4.2 NNE, , , 37.5877, -77.4485, SNOW_48, 3.4, Inch, COCORAHS, 48 hour snowfall,
:1/04/2022,0615 AM, VA, City of Richmond, Richmond 3.9 NW, , , 37.5769, -77.5171, SNOW_24, 3.5, Inch, COCORAHS, 24 hour snowfall,
:1/04/2022,0730 AM, VA, City of Richmond, Richmond 2.2 N, , , 37.5632, -77.4675, SNOW_24, 3.5, Inch, COCORAHS, 24 hour snowfall,
:1/04/2022,0730 AM, VA, City of Richmond, Richmond 1.1 SE, , , 37.519, -77.4605, SNOW_24, 3.5, Inch, COCORAHS, 24 hour snowfall,
:1/04/2022,0700 AM, VA, City of Williamsburg, Williamsburg 1.4 ENE, , , 37.278, -76.6839, SNOW_48, 2, Inch, COCORAHS, 48 hour snowfall,
:1/04/2022,0700 AM, VA, Gloucester, Gloucester Point 2.4 E, , , 37.264, -76.4517, SNOW_24, 1.5, Inch, COCORAHS, 24 hour snowfall,
:1/04/2022,0800 AM, VA, Gloucester, Gloucester Courthouse 7.1 NNE, , , 37.5004, -76.4662, SNOW_24, 1.6, Inch, COCORAHS, 24 hour snowfall,
:1/04/2022,0700 AM, VA, Gloucester, Gloucester Courthouse 2.1 S, , , 37.3792, -76.5209, SNOW_24, 2.5, Inch, COCORAHS, 24 hour snowfall,
:1/04/2022,0700 AM, VA, Gloucester, Gloucester Courthouse 3.3 SSW, , , 37.3657, -76.5504, SNOW_24, 3, Inch, COCORAHS, 24 hour snowfall,
:1/04/2022,0700 AM, VA, Goochland, Manakin-Sabot 1.6 SW, , , 37.6341, -77.7422, SNOW_48, 6.1, Inch, COCORAHS, 48 hour snowfall,
:1/04/2022,0745 AM, VA, Hanover, Montpelier 4.8 E, , , 37.8197, -77.5948, SNOW_48, 7.9, Inch, COCORAHS, 48 hour snowfall,
:1/04/2022,0700 AM, VA, Henrico, Montrose 4.7 SSE, , , 37.4561, -77.3498, SNOW_24, 2, Inch, COCORAHS, 24 hour snowfall,
:1/04/2022,0717 AM, VA, Henrico, Sandston 5.9 ESE, , , 37.5064, -77.2108, SNOW_24, 3.5, Inch, COCORAHS, 24 hour snowfall,
:1/04/2022,0700 AM, VA, Henrico, Richmond 5.3 NW, , , 37.5877, -77.539, SNOW_48, 4.3, Inch, COCORAHS, 48 hour snowfall,
:1/04/2022,0830 AM, VA, Henrico, Henrico 5.8 W, , , 37.6362, -77.6506, SNOW_48, 4.5, Inch, COCORAHS, 48 hour snowfall,
:1/04/2022,0759 AM, VA, Henrico, Glen Allen 4.6 W, , , 37.6554, -77.5687, SNOW_48, 5.4, Inch, COCORAHS, 48 hour snowfall,
:1/04/2022,0700 AM, VA, Henrico, Glen Allen 6.6 W, , , 37.6705, -77.6044, SNOW_48, 5.5, Inch, COCORAHS, 48 hour snowfall,
:1/04/2022,0800 AM, VA, James City, Williamsburg 3.2 NW, , , 37.2975, -76.7532, SNOW_24, 1.3, Inch, COCORAHS, 24 hour snowfall,
:1/04/2022,0700 AM, VA, James City, Williamsburg 6.5 NW, , , 37.3478, -76.7745, SNOW_48, 1.5, Inch, COCORAHS, 48 hour snowfall,
:1/04/2022,0700 AM, VA, James City, Toano 1.1 SSW, , , 37.3664, -76.8145, SNOW_24, 1.8, Inch, COCORAHS, 24 hour snowfall,
:1/04/2022,0700 AM, VA, Lancaster, Urbanna 6.2 NNE, , , 37.717, -76.5177, SNOW_24, 4.8, Inch, COCORAHS, 24 hour snowfall,
:1/04/2022,0600 AM, VA, Louisa, Gum Spring 3.5 NNW, , , 37.8229, -77.9192, SNOW_24, 8.5, Inch, COCORAHS, 24 hour snowfall,
:1/04/2022,0700 AM, VA, Louisa, Gordonsville 10.4 S, , , 37.9876, -78.2109, SNOW_48, 13.4, Inch, COCORAHS, 48 hour snowfall,
:1/04/2022,0700 AM, VA, Mathews, Port Haywood 1.0 SE, , , 37.3743, -76.3071, SNOW_48, 2.1, Inch, COCORAHS, 48 hour snowfall,
:1/04/2022,0700 AM, VA, Mecklenburg, Clarksville, , , 36.6197, -78.5703, SNOW_24, 1, Inch, COOP, 24 hour snowfall,
:1/04/2022,0700 AM, VA, Middlesex, Hartfield 2.9 W, , , 37.5426, -76.4971, SNOW_24, 2.5, Inch, COCORAHS, 24 hour snowfall,
:1/04/2022,0700 AM, VA, Middlesex, White Stone 8.0 SSW, , , 37.537, -76.4437, SNOW_24, 3, Inch, COCORAHS, 24 hour snowfall,
:1/04/2022,0700 AM, VA, Northumberland, Lottsburg 2.3 NNE, , , 37.9928, -76.5092, SNOW_24, 3, Inch, COCORAHS, 24 hour snowfall,
:1/04/2022,0700 AM, VA, Northumberland, Heathsville 4.6 SE, , , 37.8675, -76.4161, SNOW_24, 3.5, Inch, COCORAHS, 24 hour snowfall,
:1/04/2022,0700 AM, VA, Prince George, Disputanta 6.3 NE, , , 37.1926, -77.1491, SNOW_24, 0.8, Inch, COCORAHS, 24 hour snowfall,
:1/04/2022,0700 AM, VA, Prince George, 1.6 SE Disputanta, , , 37.1122, -77.2016, SNOW_24, 1.5, Inch, COOP, 24 hour snowfall,
:1/04/2022,0700 AM, VA, Southampton, Sedley 3.7 N, , , 36.8302, -76.9892, SNOW_24, 0.7, Inch, COCORAHS, 24 hour snowfall,
:1/04/2022,0700 AM, VA, Surry, Claremont 0.2 SW, , , 37.225, -76.9677, SNOW_24, 1, Inch, COCORAHS, 24 hour snowfall,
:1/04/2022,1200 AM, VA, Sussex, 1.5 NW Wakefield, , , 36.9839, -77.0078, SNOW_24, 1, Inch, COOP, 24 hour snowfall,
:1/04/2022,1200 AM, VA, York, 2.1 N Williamsburg, , , 37.3, -76.7, SNOW_24, 4.0, Inch, COOP, 24 hour snowfall,

Observations are collected from a variety of sources with varying
equipment and exposures. We thank all volunteer weather observers
for their dedication. Not all data listed are considered official.

$$
Wind Reports
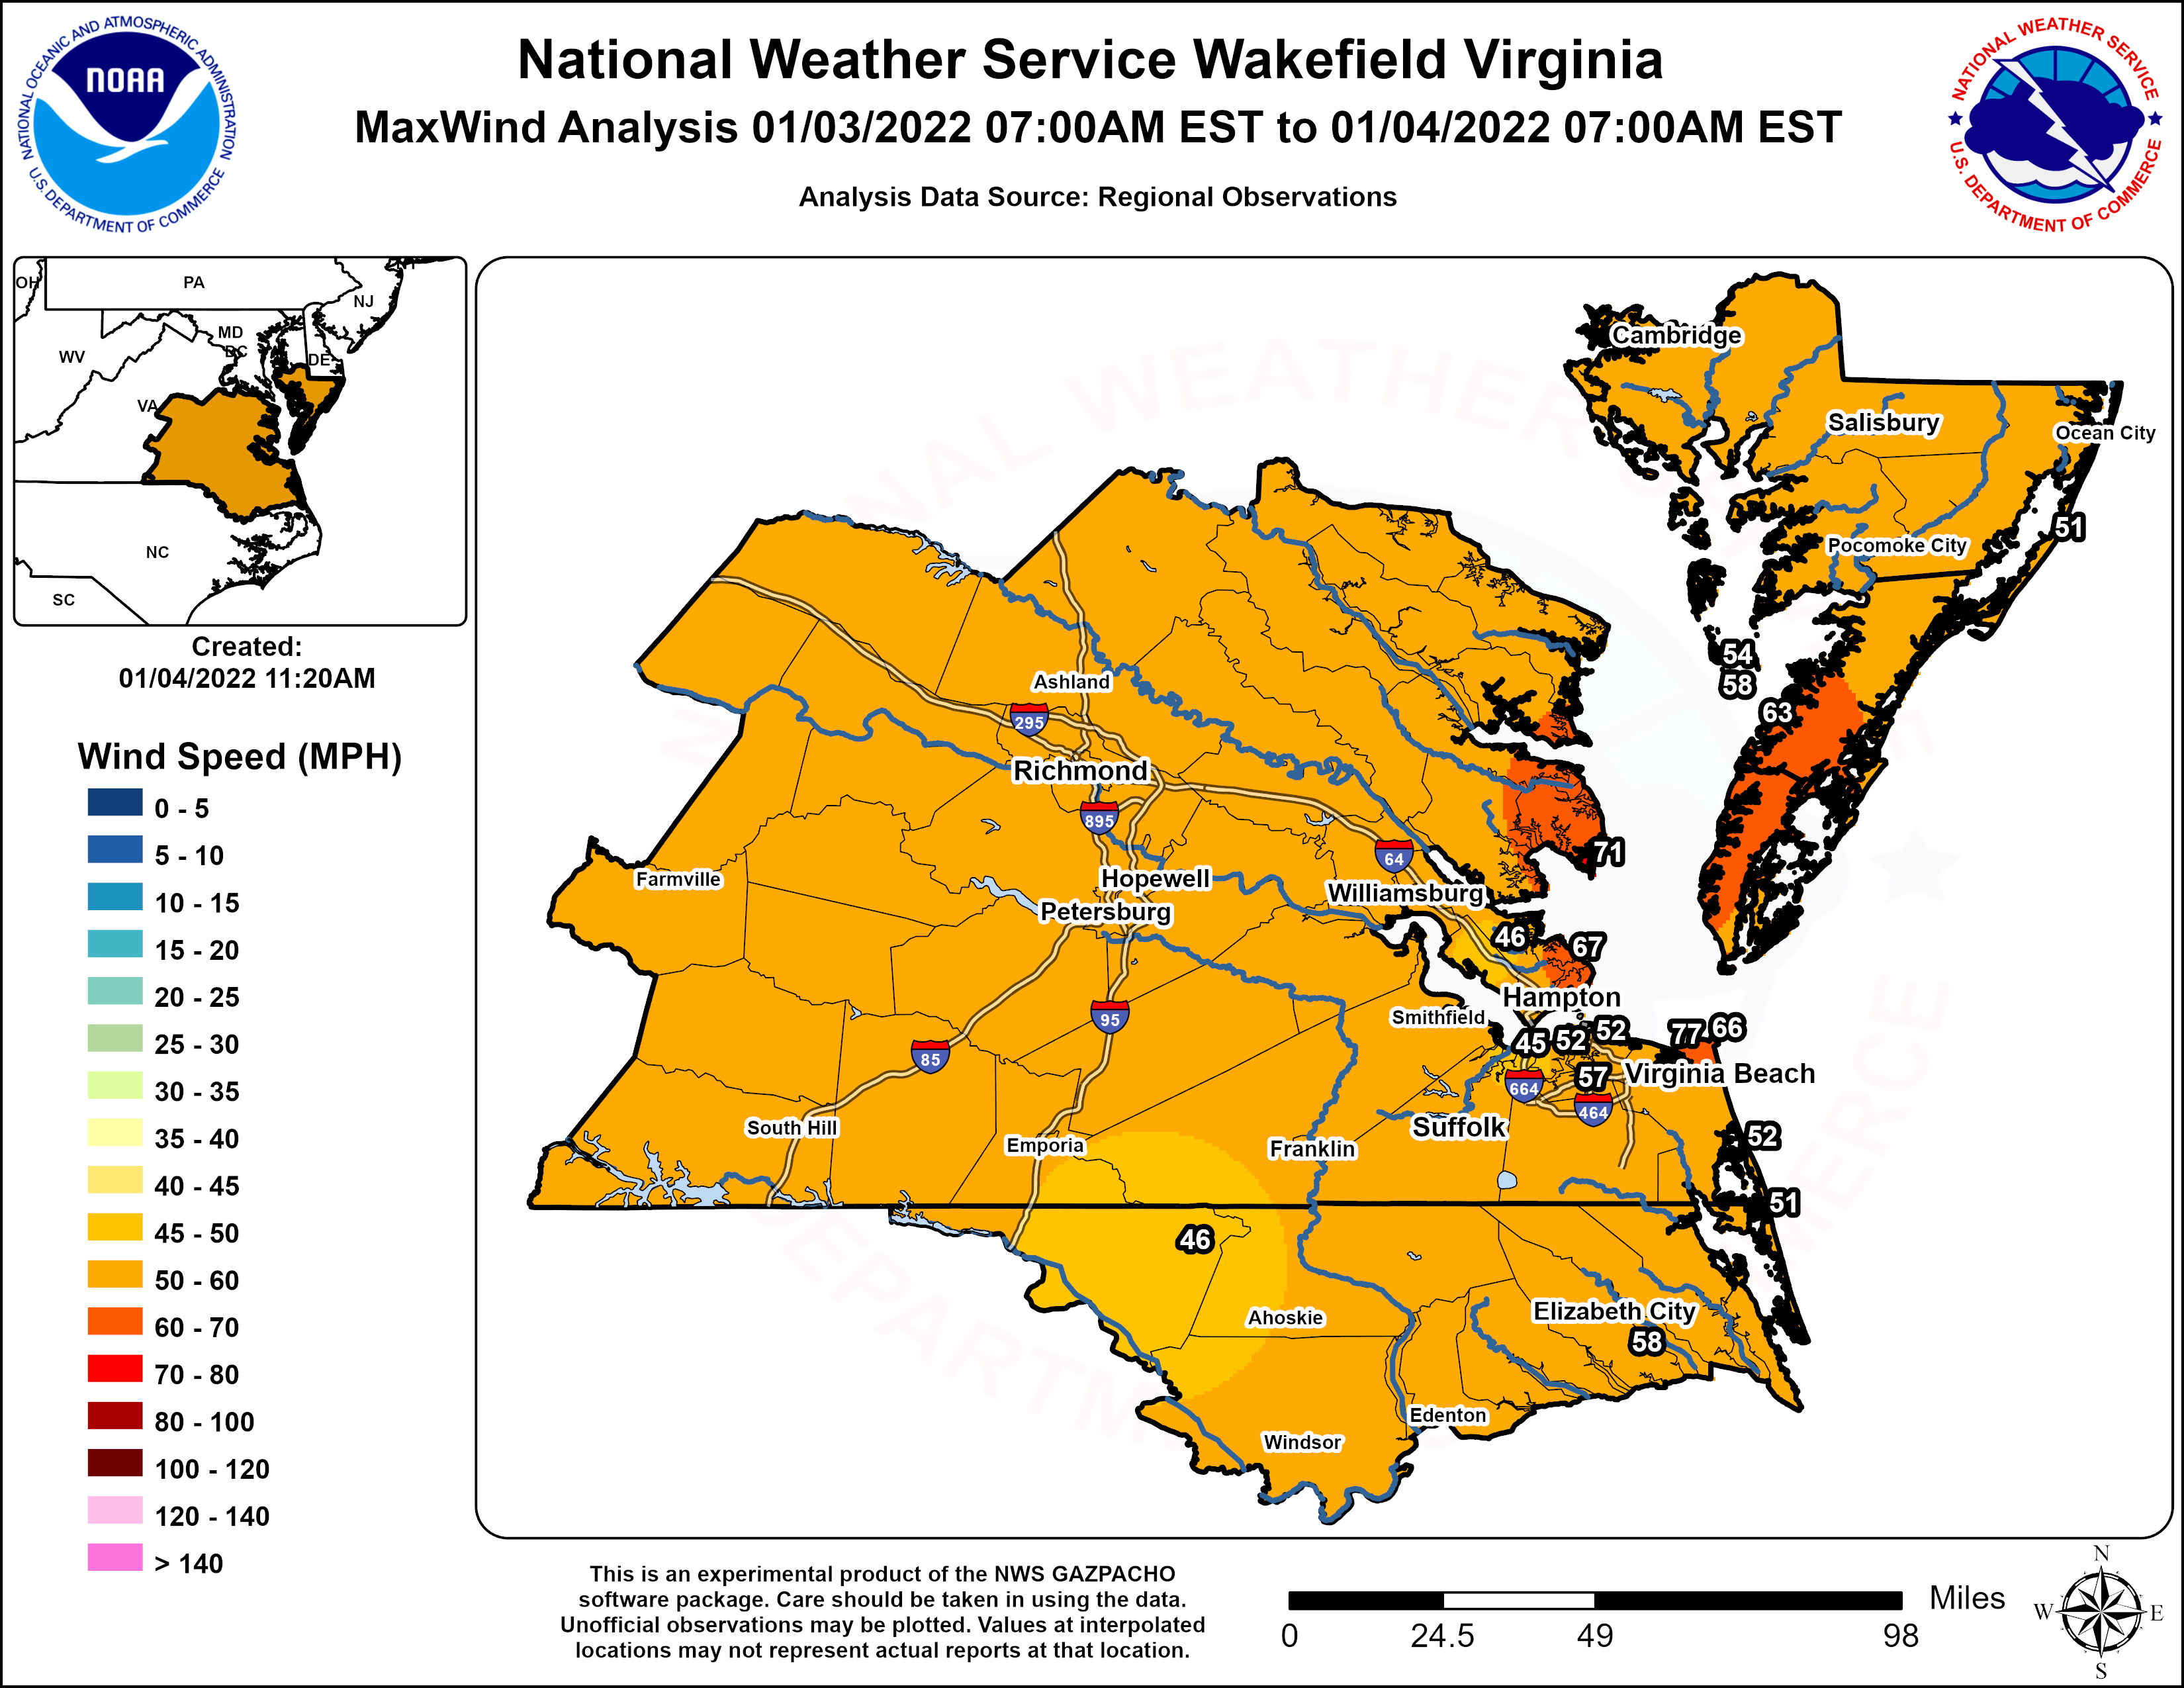
Public Information Statement
National Weather Service Wakefield VA
418 PM EST Mon Jan 3 2022

...HIGHEST WIND REPORTS...

Location                     Speed     Time/Date       Lat/Lon
Chesapeake Light Tower       87 MPH    1115 AM 01/03   36.90N/75.71W
Chesapeake Light Tower       79 MPH    0900 AM 01/03   36.90N/75.71W
Third Island                 78 MPH    0341 PM 01/03   37.04N/76.08W
Cape Henry                   77 MPH    0951 AM 01/03   36.93N/76.01W
Third Island                 75 MPH    0136 PM 01/03   37.04N/76.08W
New Point Comfort            71 MPH    1216 PM 01/03   37.33N/76.27W
Plantation Flats             70 MPH    0321 PM 01/03   37.26N/76.03W
2 E Stingray Point           69 MPH    1106 AM 01/03   37.57N/76.26W
Ocean City                   68 MPH    1104 AM 01/03   38.33N/75.08W
Poquoson                     67 MPH    1138 AM 01/03   37.11N/76.32W
Cape Henry                   66 MPH    0936 AM 01/03   36.93N/76.01W
Rudee Inlet                  64 MPH    1129 AM 01/03   36.83N/75.97W
Onancock                     63 MPH    1048 AM 01/03   37.65N/75.88W
Third Island                 63 MPH    1004 AM 01/03   36.95N/76.39W
Thimble Shoals               61 MPH    1206 PM 01/03   37.05N/76.26W
Sandbridge                   60 MPH    0342 PM 01/03   36.70N/75.93W
Deltaville                   59 MPH    1131 AM 01/03   37.56N/76.31W
Lynnhaven Inlet Light 1L     59 MPH    0948 AM 01/03   36.92N/76.09W
Elizabeth City Airport       58 MPH    1003 AM 01/03   36.27N/76.18W
Tangier Sound Light          58 MPH    0330 PM 01/03   37.79N/75.97W
5 NE Plum Tree Island Refuge 58 MPH    1212 PM 01/03   37.20N/76.27W
Rappahannock Light           58 MPH    0348 PM 01/03   37.54N/76.02W
South Norfolk Jordan Bridge  57 MPH    0937 AM 01/03   36.81N/76.29W
Silver Beach                 56 MPH    1232 PM 01/03   37.49N/75.97W
Tangier Sound Light          54 MPH    1250 PM 01/03   37.79N/75.97W
Back Bay                     52 MPH    0954 AM 01/03   36.67N/75.92W
Lafayette River              52 MPH    0958 AM 01/03   36.89N/76.32W
Norfolk NAS Cham             52 MPH    1052 AM 01/03   36.92N/76.27W
3.0 E Knotts Island (WEATHER 51 MPH    1140 AM 01/03   36.52N/75.87W
Assateague Island            51 MPH    1240 PM 01/03   38.08N/75.20W
Kiptopeke, VA                51 MPH    0330 PM 01/03   37.17N/75.99W
Yorktown USCG Training Cente 50 MPH    1112 AM 01/03   37.23N/76.48W
Newport News                 46 MPH    1026 AM 01/03   37.13N/76.50W
Conway                       46 MPH    0130 PM 01/03   36.43N/77.23W
Suffolk                      45 MPH    1025 AM 01/03   36.89N/76.42W
Ocean City Inlet             45 MPH    1254 PM 01/03   38.33N/75.09W
&&

**METADATA**
:1/03/2022,1240 PM, MD, Worcester, Assateague Island, , , 38.0817, -75.2044, PKGUST, 51, mph, RAWS, Peak Wind Gust,
:1/03/2022,1140 AM, NC, Currituck, 3.0 E Knotts Island (WEATHERSTEM), , , 36.5172, -75.8655, PKGUST, 51, mph, MESOWEST, Peak Wind Gust,
:1/03/2022,0130 PM, NC, Northampton, Conway, , , 36.4322, -77.2297, PKGUST, 46, mph, CWOP, Peak Wind Gust,
:1/03/2022,1003 AM, NC, Pasquotank, Elizabeth City Airport, , , 36.2667, -76.1833, PKGUST, 58, mph, ASOS, Peak Wind Gust,
:1/03/2022,1250 PM, VA, Accomack, Tangier Sound Light, , , 37.788, -75.9735, PKGUST, 54, mph, WXFLOW, Peak Wind Gust,
:1/03/2022,0330 PM, VA, Accomack, Tangier Sound Light, , , 37.788, -75.9735, PKGUST, 58, mph, WXFLOW, Peak Wind Gust,
:1/03/2022,1048 AM, VA, Accomack, Onancock, , , 37.6525, -75.8809, PKGUST, 63, mph, WXFLOW, Peak Wind Gust,
:1/03/2022,1026 AM, VA, City of Newport News, Newport News, , , 37.1333, -76.5, PKGUST, 46, mph, ASOS, Peak Wind Gust,
:1/03/2022,0958 AM, VA, City of Norfolk, Lafayette River, , , 36.8933, -76.3241, PKGUST, 52, mph, WXFLOW, Peak Wind Gust,
:1/03/2022,1052 AM, VA, City of Norfolk, Norfolk NAS Cham, , , 36.9167, -76.2667, PKGUST, 52, mph, AWOS, Peak Wind Gust,
:1/03/2022,1138 AM, VA, City of Poquoson, Poquoson, , , 37.1099, -76.3209, PKGUST, 67, mph, WXFLOW, Peak Wind Gust,
:1/03/2022,0937 AM, VA, City of Portsmouth, South Norfolk Jordan Bridge, , , 36.8083, -76.2906, PKGUST, 57, mph, WXFLOW, Peak Wind Gust,
:1/03/2022,1025 AM, VA, City of Suffolk, Suffolk, , , 36.8865, -76.417, PKGUST, 45, mph, CWOP, Peak Wind Gust,
:1/03/2022,0954 AM, VA, City of Virginia Beach, Back Bay, , , 36.672, -75.9163, PKGUST, 52, mph, RAWS, Peak Wind Gust,
:1/03/2022,0936 AM, VA, City of Virginia Beach, Cape Henry, , , 36.9271, -76.0067, PKGUST, 66, mph, WXFLOW, Peak Wind Gust,
:1/03/2022,0951 AM, VA, City of Virginia Beach, Cape Henry, , , 36.9271, -76.0067, PKGUST, 77, mph, WXFLOW, Peak Wind Gust,
:1/03/2022,1216 PM, VA, Mathews, New Point Comfort, , , 37.3295, -76.2719, PKGUST, 71, mph, WXFLOW, Peak Wind Gust,
:1/03/2022,0330 PM, VA, Northampton, Kiptopeke, VA, , , 37.1652, -75.9884, PKGUST, 51, mph, NOS-NWLON, Peak Wind Gust,

Observations are collected from a variety of sources with varying
equipment and exposures. We thank all volunteer weather observers
for their dedication. Not all data listed are considered official.
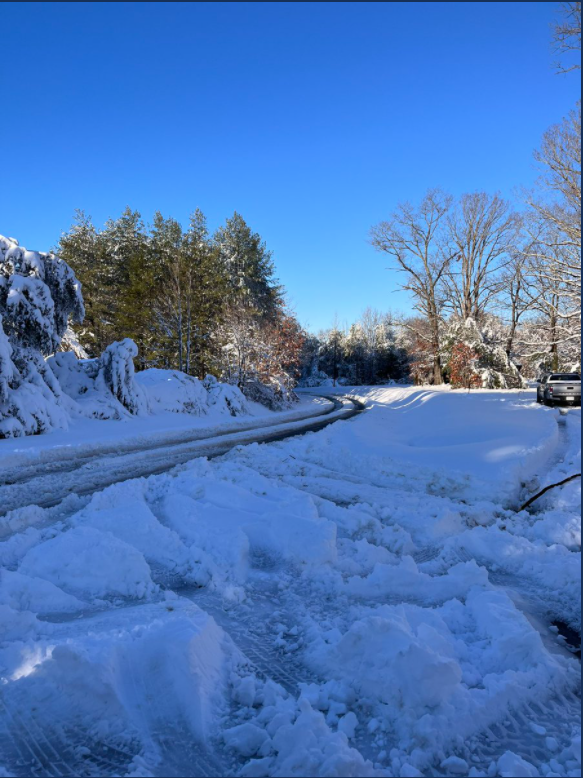
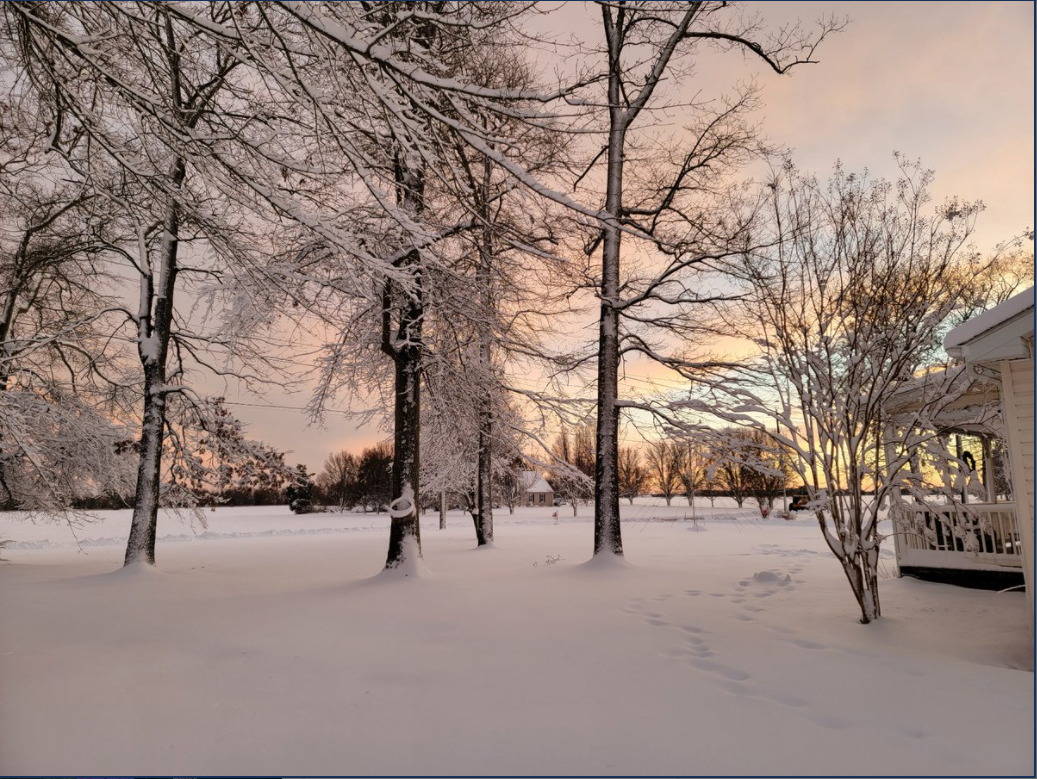
Photos
Selected Photos
 |
 |
 |
 |
| Snow in western Louisa County (credit: Brayden James) |
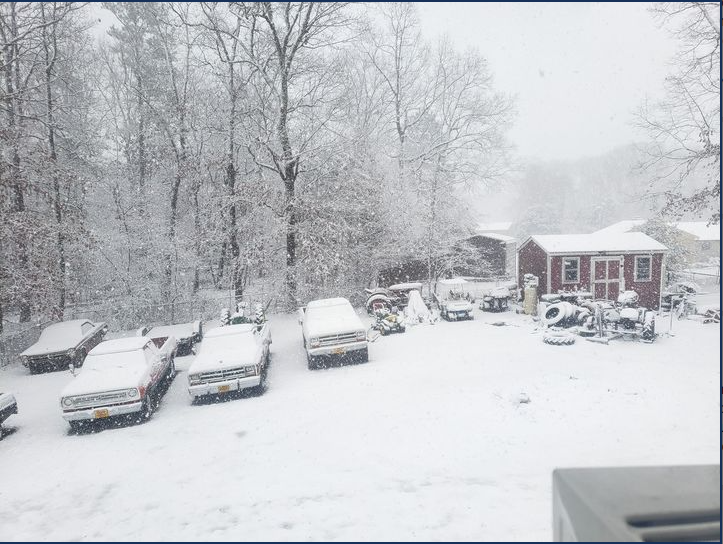
Snow in Hurlock, MD (credit: Reece Todd) |
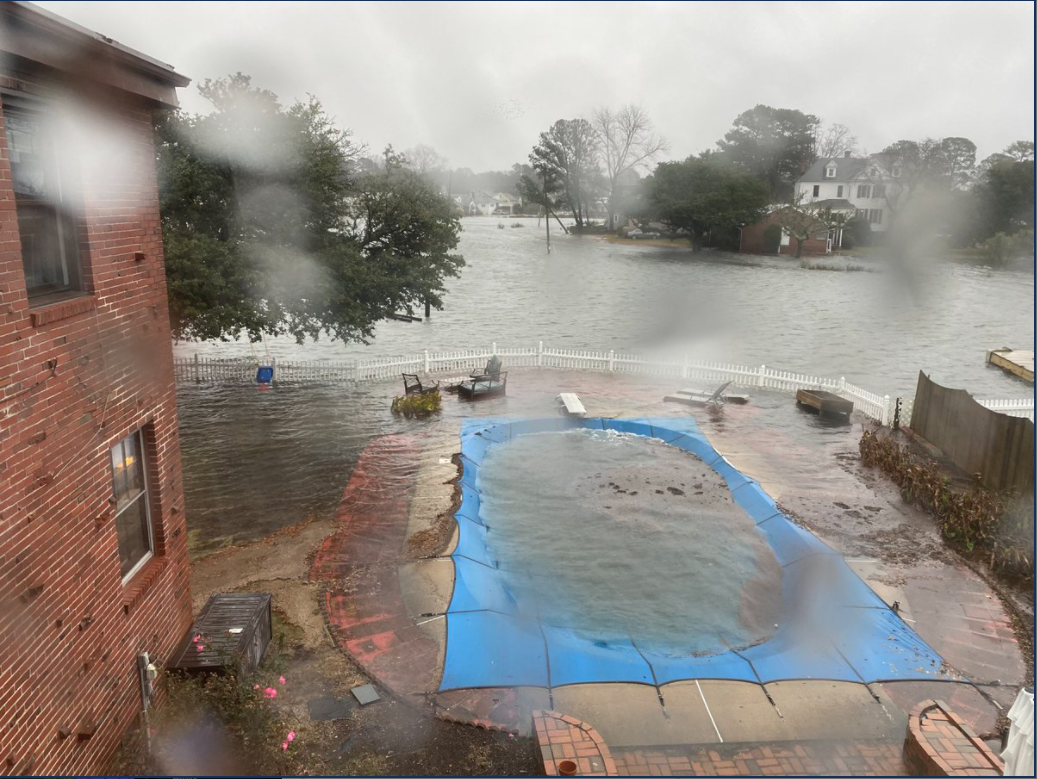
Coastal Flooding in Norfolk (credit: Hoytcast) |
Snow in Prince George County near Fort Lee (credit: Austin Simonsen) |
Radar and Satellite Imagery
Satellite and Radar Loops
 |
 |
| Radar Loop of 0.5° Reflectivity (left) and CC (right) from 7 AM to 3:30 PM in 30 minute increments. The bright colors in the CC loop roughly represent the rain/snow transition zone (where there was a mix of sleet, snow, and rain). To the W/NW of this precipitation was all snow with all rain to the SE. | 24 Hour loop of Mid-Level GOES-16 Water Vapor Satellite imagery from 7 PM on 1/2 to 7 PM on 1/3. The rapid intensification of this system is clearly evident as it approached and crossed the local area. |
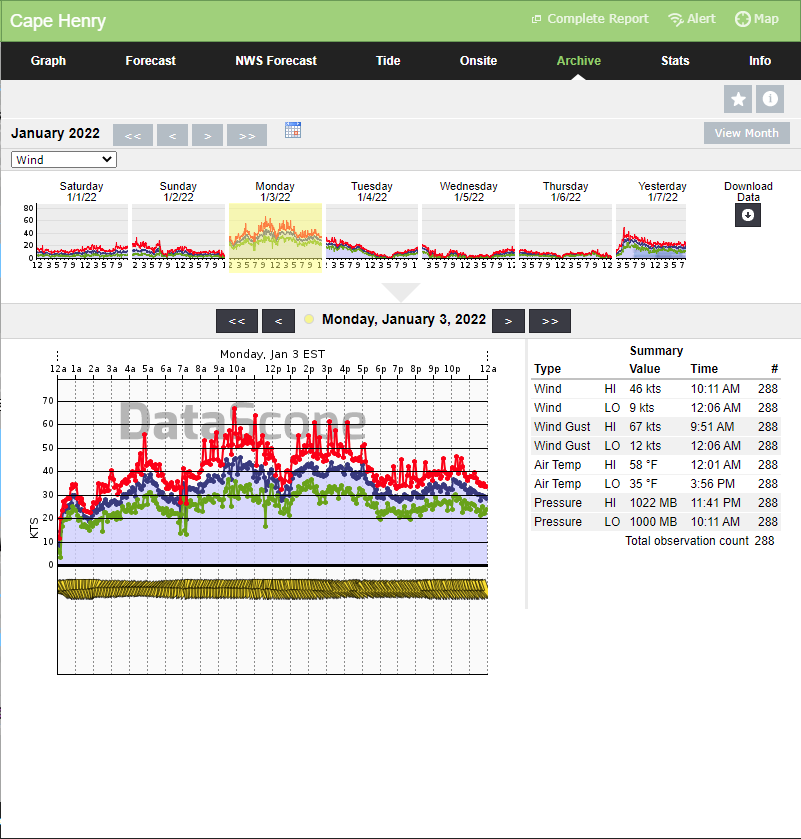
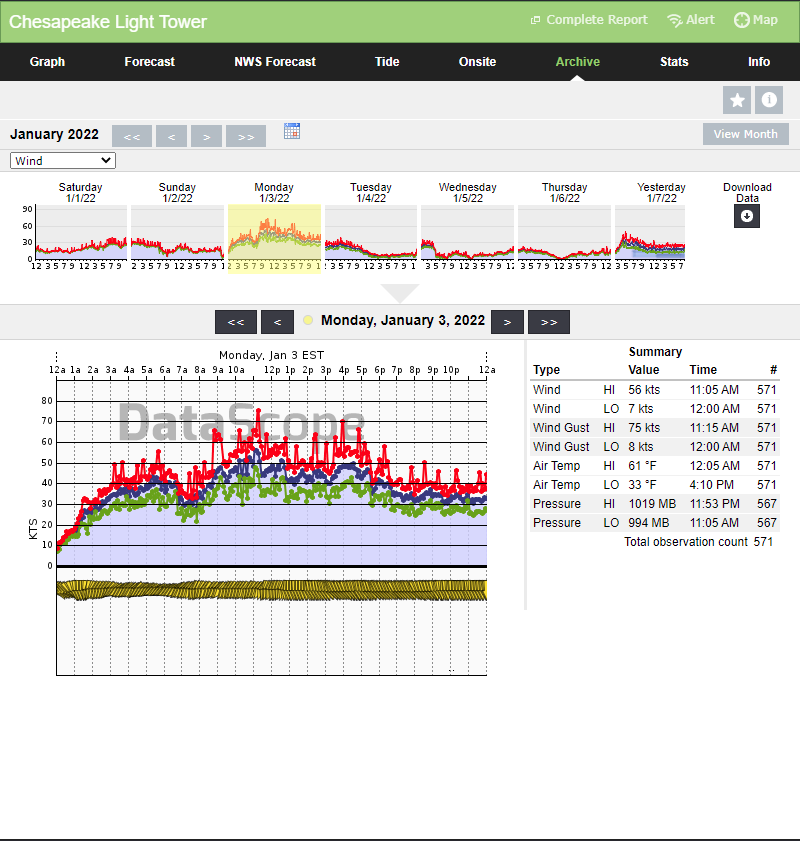
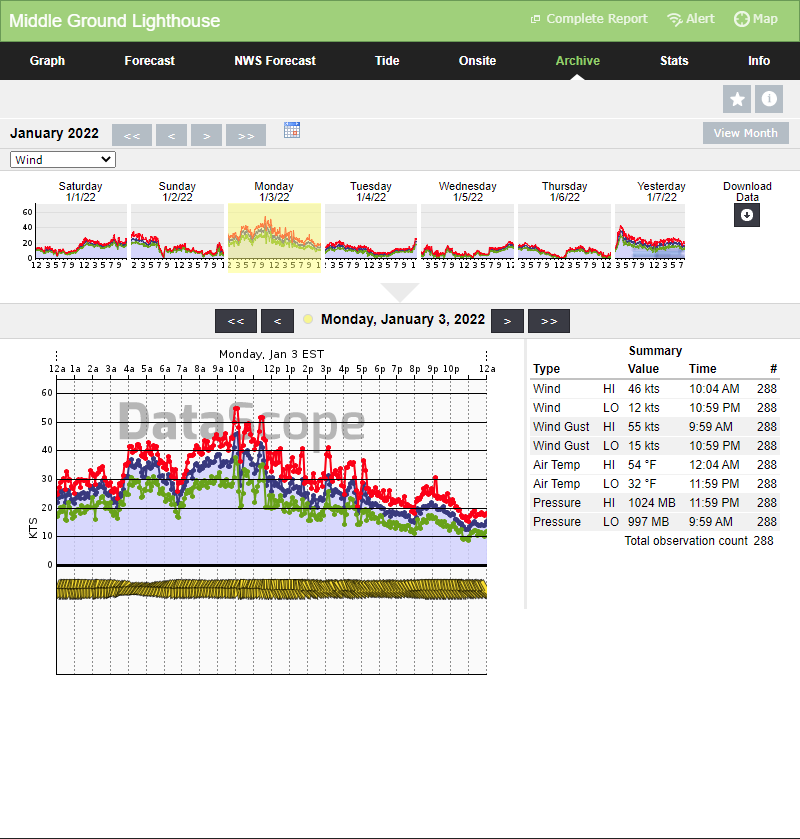
Marine Wind Observations (credit: WeatherFlow)
 |
 |
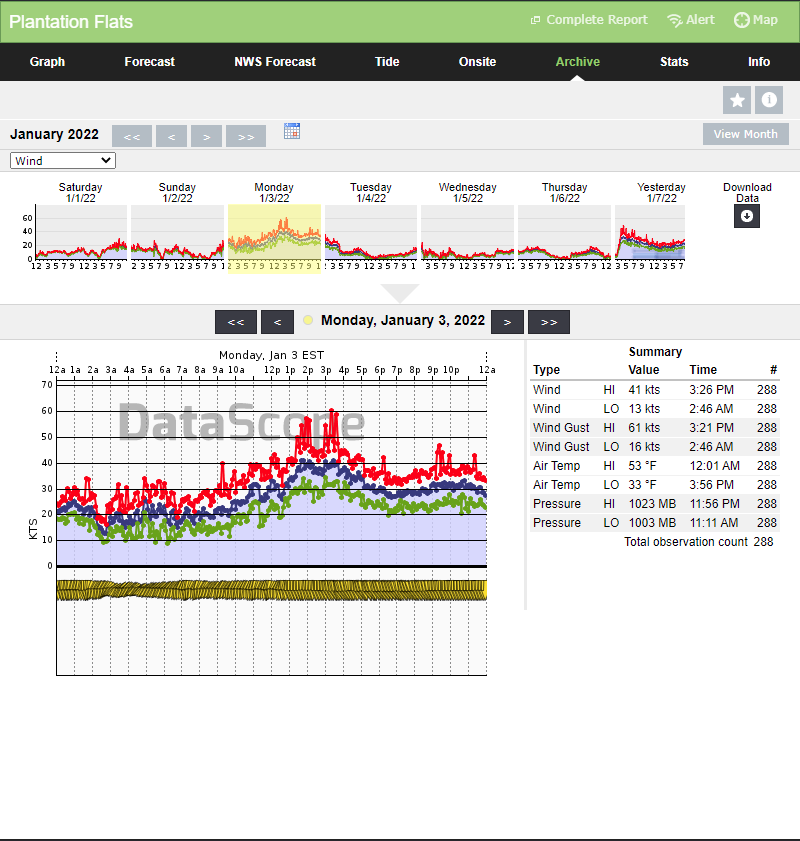 |
| Cape Henry, VA | Chesapeake Light Tower (east of Cape Henry) | Plantation Flats, VA (Lower Chesapeake Bay) |
 |
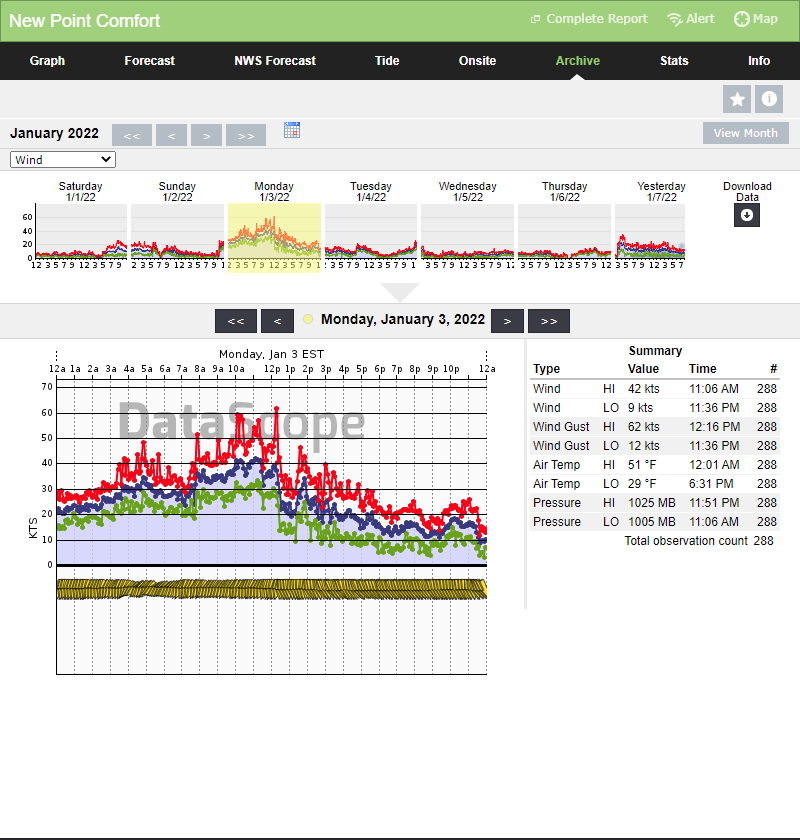 |
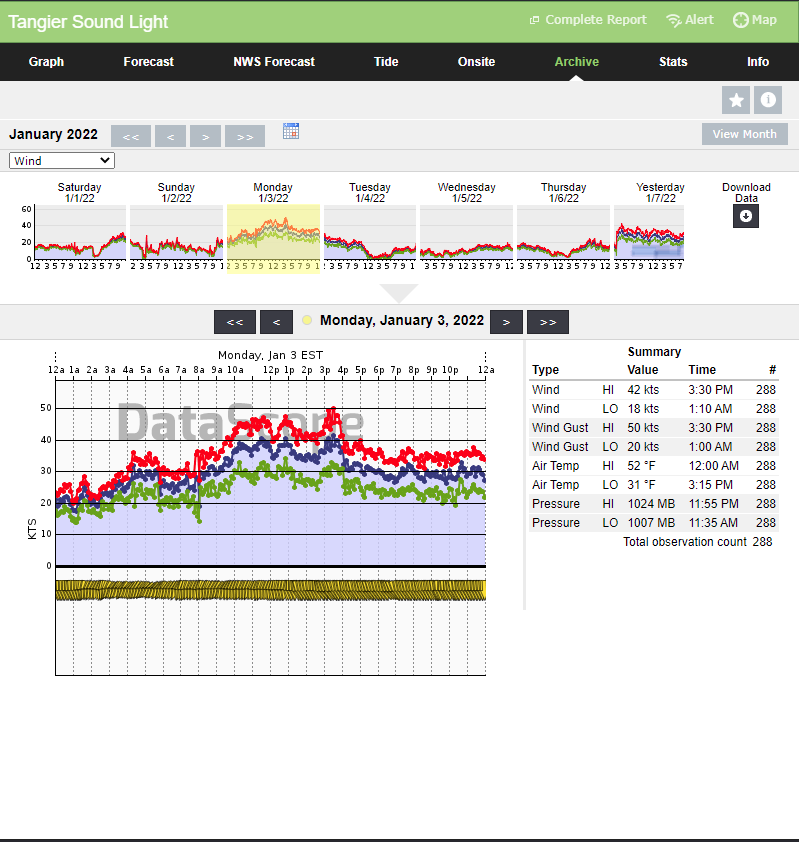 |
| Middle Ground Lighthouse (Lower James River) | New Point Comfort, VA (Mathews County) | Tangier Sound Light, VA |
Environment
Synoptic summary.
 |
 |
 |
| Loop of WPC Surface Analysis from 7 PM on 1/2 to 7 PM on 1/3 in 3-h increments | 12z/7 AM 500mb Analysis on 1/2 | 12z/7 AM 500mb Analysis on 1/3 |
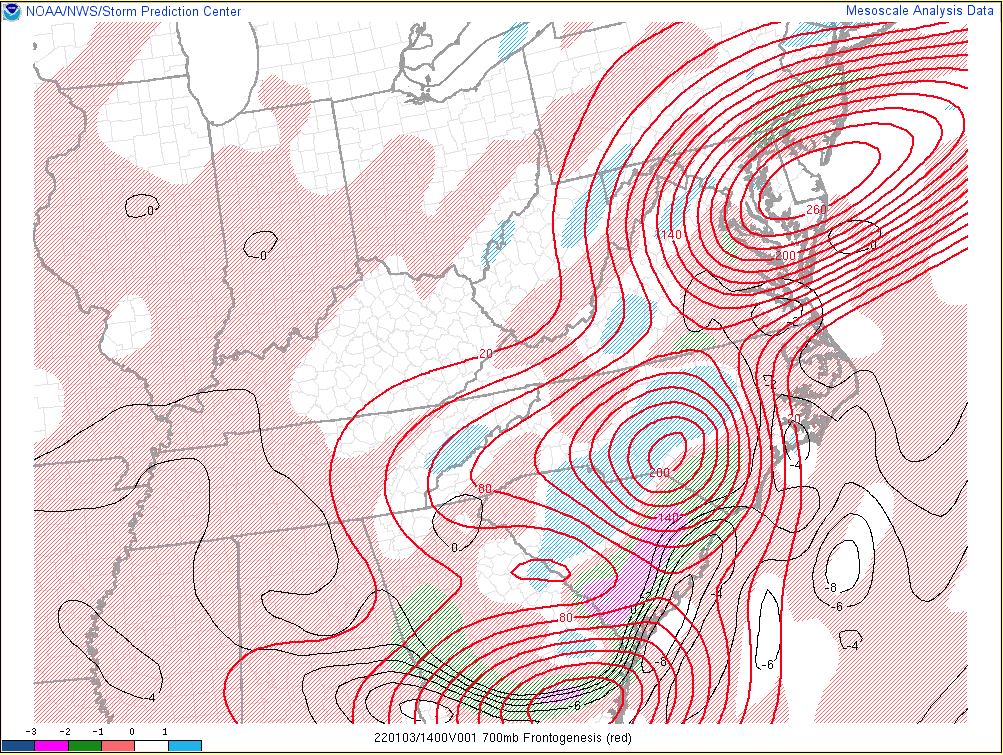
Near-storm environment summary.
 |
 |
 |
 |
| Loop of 700mb Frontogenesis from 13 to 21z (8 to 4 PM) in 2-h increments | Cross section of frontogenesis/omega/theta-e at 15z/10 AM from the NAM Nest | 15z/10 AM 650-500mb Equivalent Potential Vorticity (EPV) and 700mb Frontogenesis | Loop of RAP Analysis Soundings from Richmond Int'l (KRIC) from 12 to 18z (7 AM to 1 PM) in 3-h increments |
Additional environmental data...coming soon.
| Figure 7: Caption | Figure 8: Caption | Figure 9: Caption |
 |
Media use of NWS Web News Stories is encouraged! Please acknowledge the NWS as the source of any news information accessed from this site. |
|


 Coastal Flood
 Heat
Heat