|
Marine Weather Briefing (pdf) Latest Marine Briefing Created: Sun Jun 28 09:12:01 EDT 2026 |
|
Main (Land) Weather Briefing (pdf) Latest Briefing Created: Sun Jun 28 11:50:02 EDT 2026 |
 |
 |
 |
|
|
Current Weather
| NOAA Ports | Port Weather | Buoy Data |
 |
 |
 |
| Marine Observations as of 5:00 PM EDT Tue Jul 21 2026 | |||||||
| Location | UTC TIME | Air Temp (°F) |
Water Temp (°F) |
Wind (DIR/SP/Gust) |
Pres (mb) |
Wave&Swell (HT/PER) |
|
| Baltimore Harbor | 2030 | 240/ 2/ 10 | N/A | ||||
| Tolchester Beach | 2030 | 84 | 83 | 160/ 3/ 8 | 1006.4 | ||
| Francis S Key Br | 2030 | 88 | 240/ 6/ 7 | 1006.3 | |||
| Cambridge MD | 2030 | 87 | 84 | 200/ 9/ 14 | 1008.0 | ||
| Thomas Pt, MD | 2100 | 86 | 200/ 14/ 15 | 1007.3 | |||
| Gooses Reef, MD | 2048 | 79 | 82 | 240/ 23/ 31 | N/A | 1 | |
| Cove Pt, MD | 2030 | 83 | 190/ 20/ 28 | 1009.3 | |||
| Piney Pt, MD | 2030 | 210/ 10/ 16 | N/A | ||||
| Bishops Head, MD | 2030 | 83 | 85 | 230/ 27/ 31 | 1008.9 | ||
| Potomac, MD | 2048 | 74 | 83 | 240/ 16/ 21 | N/A | 2 | |
| Solomons Island, MD | N/A | N/A | N/A | N/A | N/A | N/A | N/A |
| Lewisetta, VA | 2030 | 76 | 85 | 270/ 12/ 15 | 1009.9 | ||
| Dahlgren, VA | 2030 | 76 | 87 | 240/ 11/ 14 | 1007.3 | ||
| Rappahannock Light | 2030 | 180/ 9/ 10 | 1009.6 | ||||
| StingRay Pt | 2048 | 82 | 83 | 180/ 6/ 8 | N/A | ||
| Yorktown, VA | 2030 | 89 | 84 | 200/ 10/ 16 | 1009.4 | ||
| Buoy 44072 York | 2042 | 84 | 83 | 220/ 16/ 19 | N/A | 3 | |
| Jamestown, VA | N/A | N/A | N/A | N/A | N/A | N/A | N/A |
| Willouby Stn, VA | 2030 | 89 | 220/ 24/ 30 | 1009.4 | |||
| Dominion Term Stn | 2030 | 87 | 210/ 15/ 18 | 1010.0 | |||
| Money Pt | 2030 | 89 | 85 | 220/ 7/ 13 | 1010.2 | ||
| Sewells Pt | 2030 | 89 | 83 | 1009.3 | |||
| Kiptopeke, VA | 2030 | 85 | 82 | 210/ 12/ 15 | 1011.1 | ||
| Ches Bay Bridge | 2030 | 88 | 220/ 17/ 22 | 1009.1 | |||
| Cape Henry,VA | 2030 | 88 | 220/ 13/ 21 | 1008.5 | |||
| Lewes, DE | 2030 | 86 | 74 | 190/ 9/ 15 | 1007.7 | ||
| Buoy 44009 | 2050 | 78 | 76 | 210/ 17/ 21 | 1008.9 | ||
| Brandywine Light | 2030 | 82 | 200/ 17/ 19 | 1006.8 | |||
| Ocean City Inlet | 2030 | 78 | 76 | 200/ 15/ 19 | 1009.2 | ||
| Wachapreague, VA | 2030 | 84 | 83 | 250/ 5/ 8 | 1009.7 | ||
| Wallops Island Buoy | N/A | N/A | N/A | N/A | N/A | N/A | N/A |
| Cape Henry Buoy | 2056 | 79 | N/A | 3 | |||
| Cape Charles Buoy | N/A | N/A | N/A | N/A | N/A | N/A | N/A |
| 1st Landing Buoy | N/A | N/A | N/A | N/A | N/A | N/A | N/A |
| Buoy 44014 | 2050 | 82 | N/A | 5 | |||
| Duck Pier | N/A | N/A | N/A | N/A | N/A | N/A | N/A |
| Buoy 44056 | N/A | N/A | N/A | N/A | N/A | N/A | N/A |
| Buoy 44100 | 2030 | 85 | 74 | 220/ 21/ 25 | 1012.9 | ||
| Oregon Inlet, NC | 2030 | 84 | 83 | 220/ 22/ 26 | 1013.5 | ||
| Buoy 41025 | 2050 | 85 | 84 | 210/ 19/ 23 | 1014.3 | 4 | |
| Cape Lookout, NC | 2050 | 85 | 210/ 15/ 22 | 1014.4 | |||
 |
 Northeast Regional Radar Loop |
 NWS Wakefield, VA Radar Loop |
 Dover, AFB |
 Newport/Morehead City, NC |
 Raleigh, NC |
 Sterling, VA |
 Blacksburg, VA |
 Fort Dix, NJ |
||
| Click Here for Interactive Radar Display | ||||
 Atlantic Coast Visible Loop |
 Atlantic Coast IR Loop |
 Tropical Atlantic Loop |
| LATEST FORECAST DISCUSSION |
DAILY MARINE THREAT
| TODAY | TOMORROW | DAY 3 | DAY 4 | DAY 5 |
 |
 |
 |
 |
 |
 |
||||
HOURLY WEATHER GRAPHS
WIND/WAVE FORECASTS
| MAX WIND GUST | SIG WAVE HGT | OCCASIONAL WAVE HGT | ||
| DAY 1 |  |
 |
 |
|
| DAY 2 |  |
 |
 |
|
| DAY 3 |  |
 |
 |
|
|
|
| Complete Wind Gust Likelihood and Probabilities Page |
LIKELIHOOD OF WIND GUSTS
| 25 KT LIKELYHOOD | 34 KT LIKELYHOOD | 43 KT LIKELYHOOD | 48 KT LIKELYHOOD | FORECAST WIND GUST | HIGH END WIND GUST |
 |
 |
 |
 |
 |
 |
SUSTAINED WIND PROBABILITY
| Chesapeake Light VA | Cape Charles Light VA | Pilot Area | Sewells Point |
 |
 |
 |
 |
WIND GUST PROBABILITY
| Chesapeake Light VA | Cape Charles Light VA | Pilot Area | Sewells Point |
 |
 |
 |
 |
DETAILED MODEL WAVE FORECAST
| Cape Charles Wave Plot | Cape Henry Wave Plot | CBBT Wave Plot | Chesapeake Light Wave Plot |
 |
 |
 |
 |
NEAR SHORE WAVE MODEL
| WAVES | CURRENTS | WAVE PERIOD/DIRECTION |
 |
 |
 |
|
|
|
|
509 PM EDT TUE JUL 21 2026 TIDAL INFORMATION. FOR SEWELLS POINT. LOW TIDE AT 10:22 PM Tue. HIGH TIDE AT 03:44 PM Tue. LOW TIDE AT 09:19 AM Tue. HIGH TIDE AT 03:01 AM Tue. LOW TIDE AT 11:21 PM Wed. HIGH TIDE AT 04:40 PM Wed. LOW TIDE AT 10:07 AM Wed. HIGH TIDE AT 03:53 AM Wed. |
| SEWELLS POINT TIDE | CHESAPEAKE BAY BRIDGE TUNNEL TIDE | JAMES RIVER/JAMESTOWN SCOTLAND FERRY TIDE | ELIZABETH RIVER (MONEY POINT) TIDE |
| TIDAL IMPACT VS LEVEL BELOW | |||
 |
 |
 |
 |
| LYNNHAVEN INLET TIDE DATA | HRBT TIDE DATA | MIDTOWN TUNNEL TIDE DATA | YORKTOWN TIDE DATA |
| TIDAL IMPACT VS LEVEL BELOW | |||
 |
 |
 |
 |
COASTAL FLOOD THREATS NEXT SEVERAL DAYS
| TODAY | TOMORROW | DAY 3 | DAY 4 |
 |
 |
 |
 |
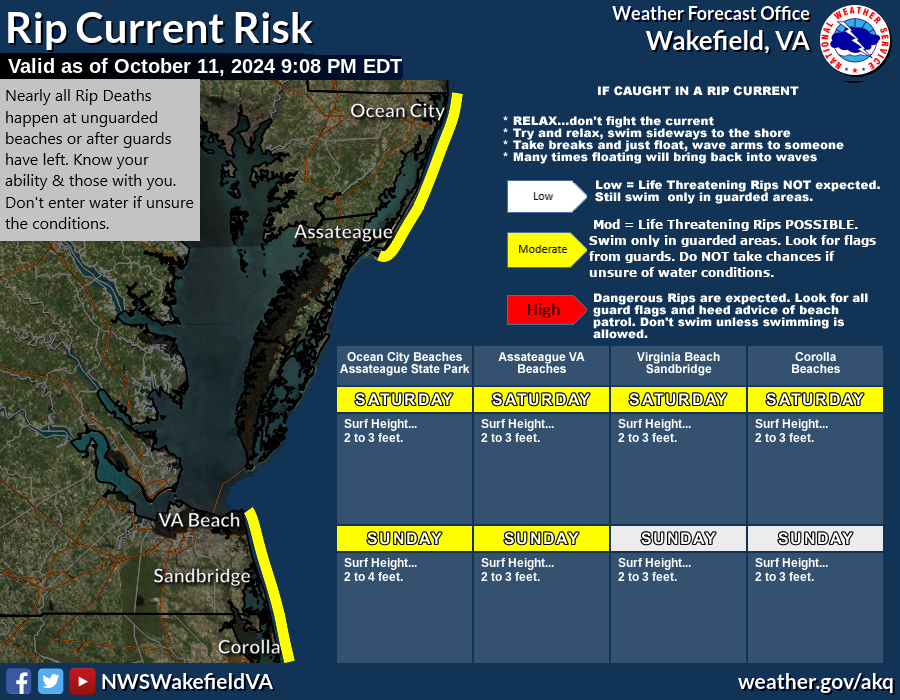
CLICK HERE FOR SURF ZONE/BEACH FORECAST |
 |
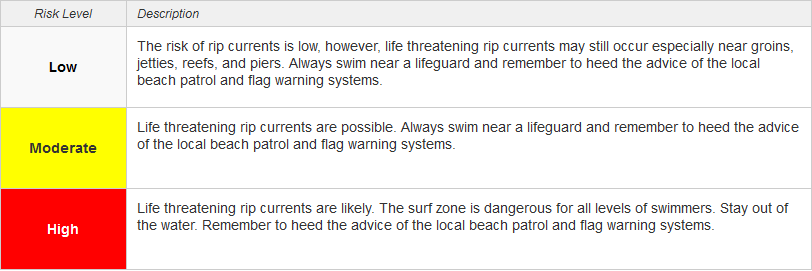 |
| Ocean City Rips | Assateague Rips | Virginia Beach Rips | Corolla Rips |
 |
 |
 |
 |


 Coastal Flood
 Heat
Heat