Gaylord, MI
Weather Forecast Office
 |
 |
 |
 |
|
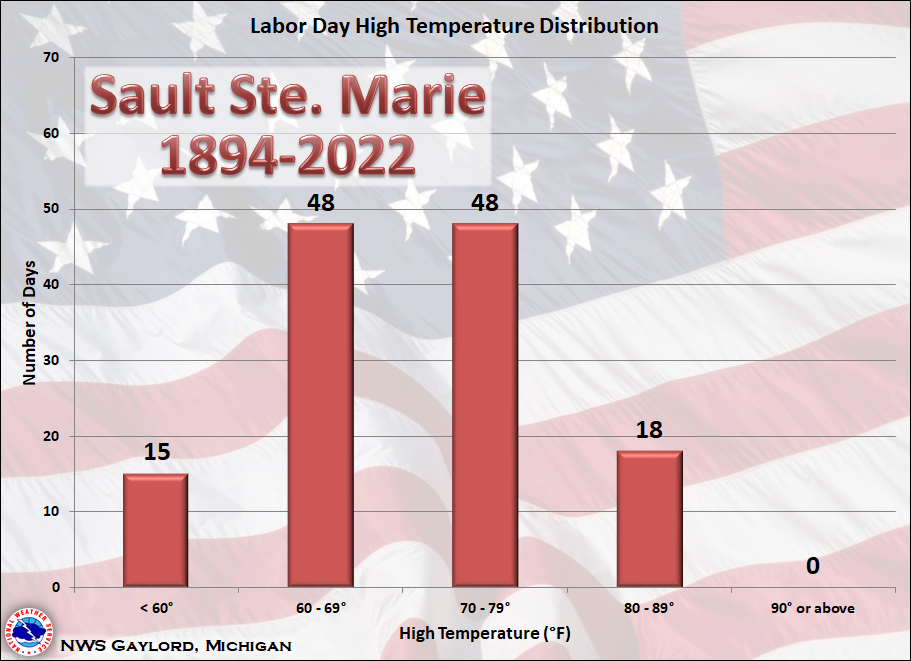
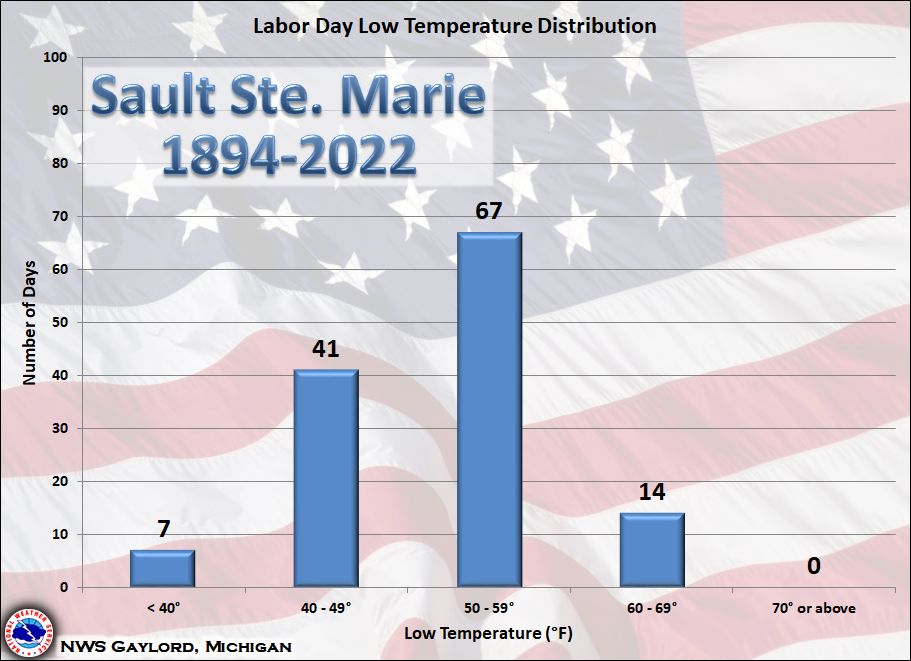
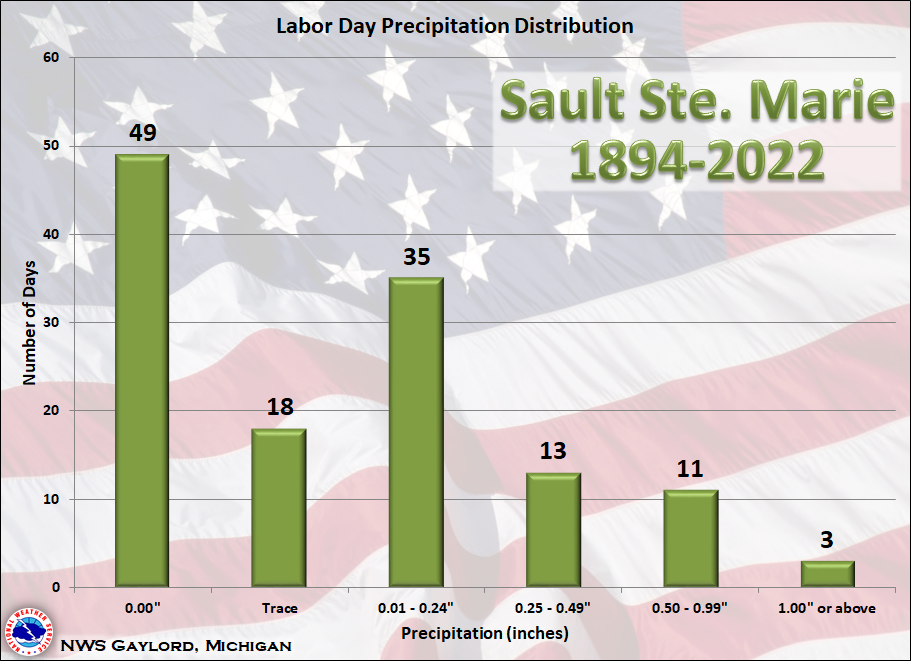
Labor Day became a federal holiday in 1894 to pay tribute to the contributions that workers have made to the strength, prosperity, and well-being of America. Here is a look at some Labor Day weather statistics for Sault Ste. Marie. As can be seen in the data below, there has been a wide spectrum of temperatures and rainfall on Labor Day in Sault Ste. Marie, but highs have generally been in the 60s/70s and lows in the 50s. It is also fairly common for Sault Ste. Marie to see some rain on Labor Day. |
Local Information
Area Information
Office Webcam
Forecast
Recreational
Great Lakes/Marine
NWS DSS Table
Beach/Surf
Text Products
US Dept of Commerce
National Oceanic and Atmospheric Administration
National Weather Service
Gaylord, MI
8800 Passenheim Road
Gaylord, MI 49735-9454
989-731-3384
Comments? Questions? Please Contact Us.