Daily/Seasonal Snowfall Information
| Seasonal Snowfall | Normal To Date | Normal For Entire Season |
|---|---|---|
| Site | Daily | Season to Date | Normal to Date | % of Normal | Normal for the Entire Season | Record/Year |
|---|---|---|---|---|---|---|
| Alpena |
|
|
|
|
|
166.3
1970-71
|
| Houghton Lake |
|
|
|
|
|
124.1
1970-71
|
| Sault Ste. Marie |
|
|
|
|
|
222.0
1995-96
|
| NWS Gaylord |
|
|
|
|
|
204.3
2024-25
|
| Traverse City |
|
|
|
|
|
191.5
1995-96
|
| West Branch |
|
|
|
|
|
95.0
1951-52
|
| Petoskey |
|
|
|
|
|
184.8
2013-14
|
| Site | Snow Depth | Days With >= 6 Inch Snow Depth This Season | Normal Days >= 6 Inch Snow Depth (Entire Season) |
|---|---|---|---|
| Alpena |
|
|
|
| Houghton Lake |
|
|
|
| Sault Ste. Marie |
|
|
|
| NWS Gaylord |
|
|
|
| Traverse City |
|
|
|
| West Branch |
|
|
|
| Petoskey* |
|
|
|
Local Daily Snowfall and Snow Depth
Maps below are updated daily between 11 am and noon.
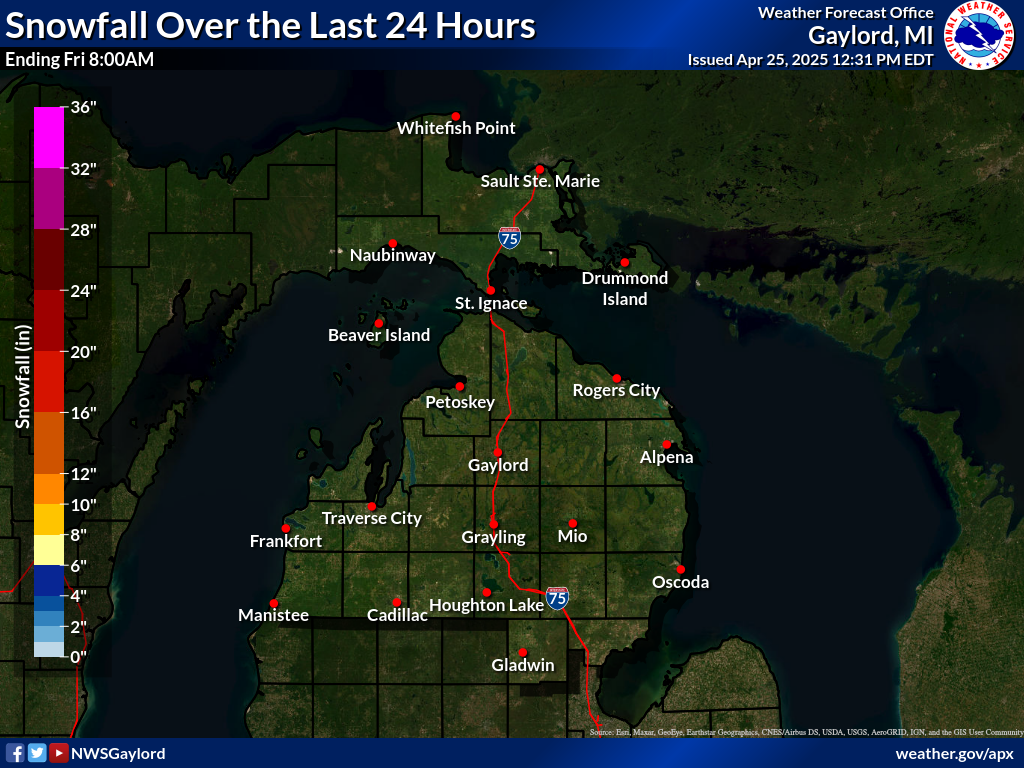 |
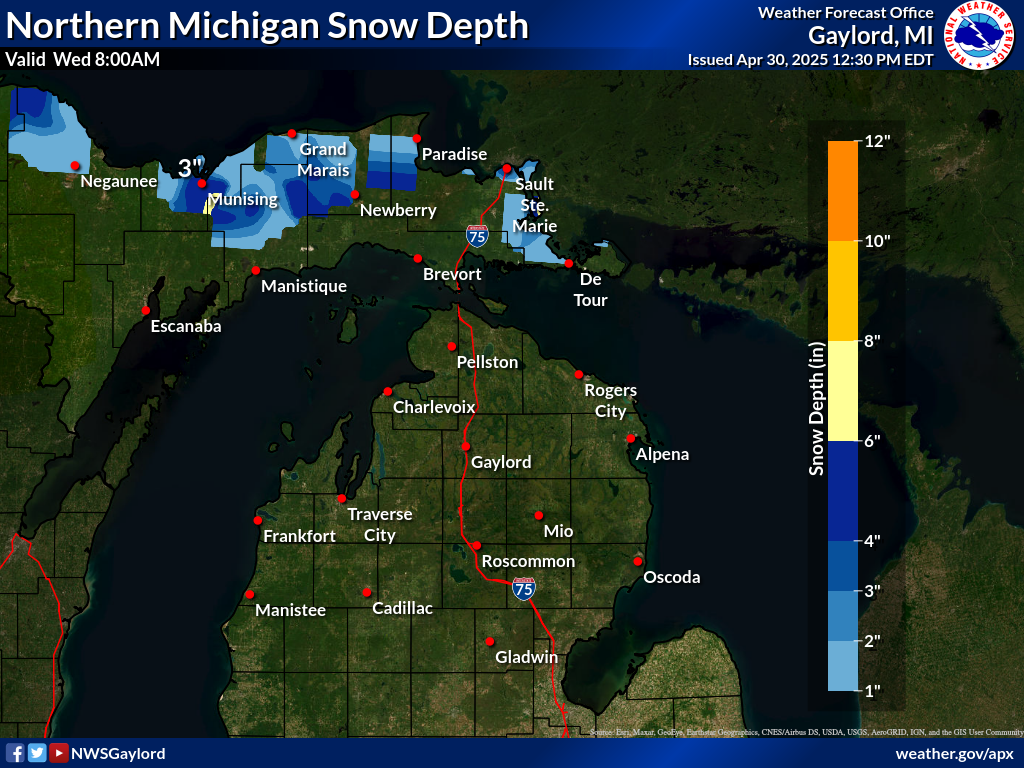 |
| This map is an interpolation of actual reports and should be considered an estimation only. Values are generally 24 hour reports ending around 7am EST. | This snow depth map is a satellite estimate of snow depth over the area. It may not reflect current actual conditions until skies are clear enough for a good satellite image. |
NWS Gaylord, MI Webcams
NWS Gaylord's 45th Parallel Snow Stake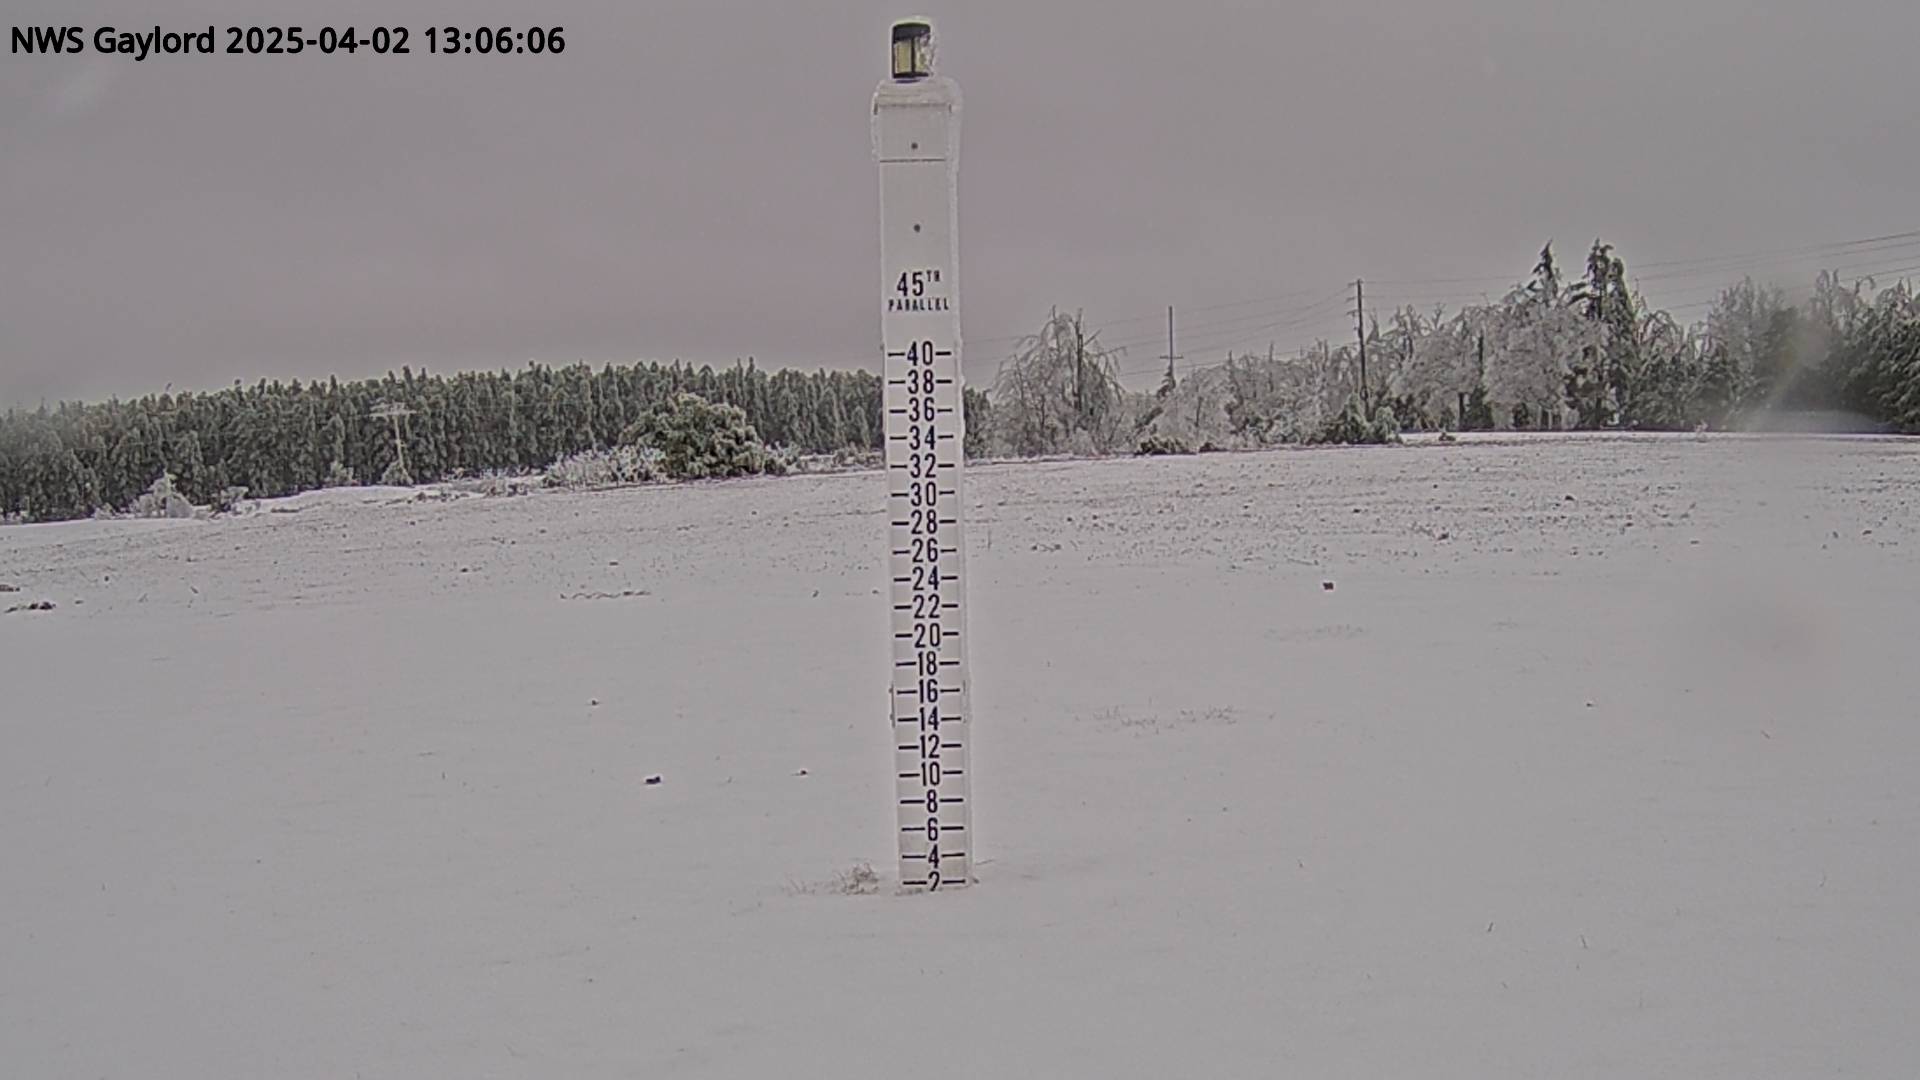 |
NWS Gaylord's Office Webcam |
*This snow stake may not necessarily reflect the official daily snow depth measurement for the NWS office in Gaylord.
Previous Season Snowfall Amounts and Average
| 2025-2026 | |
|---|---|
 |
|
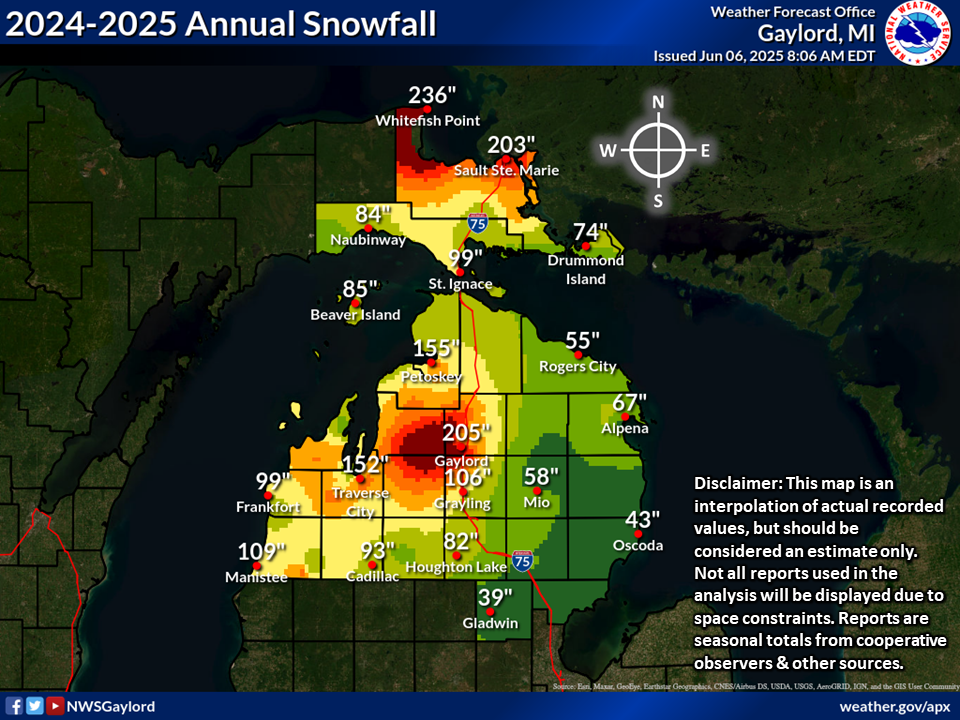
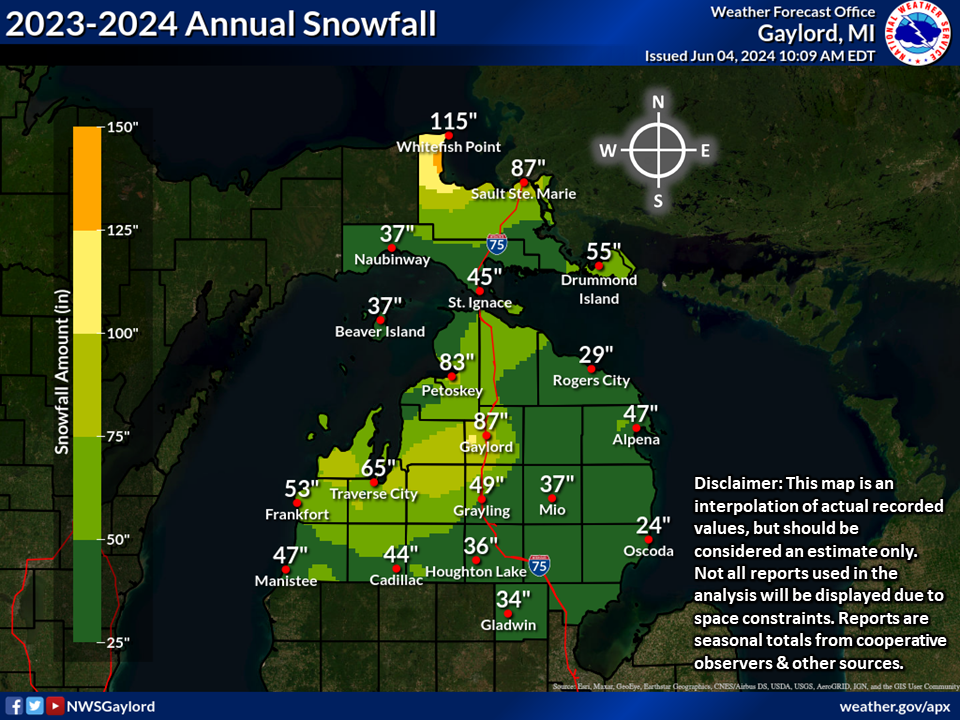
| 2024-2025 | 2023-2024 |
 |
 |
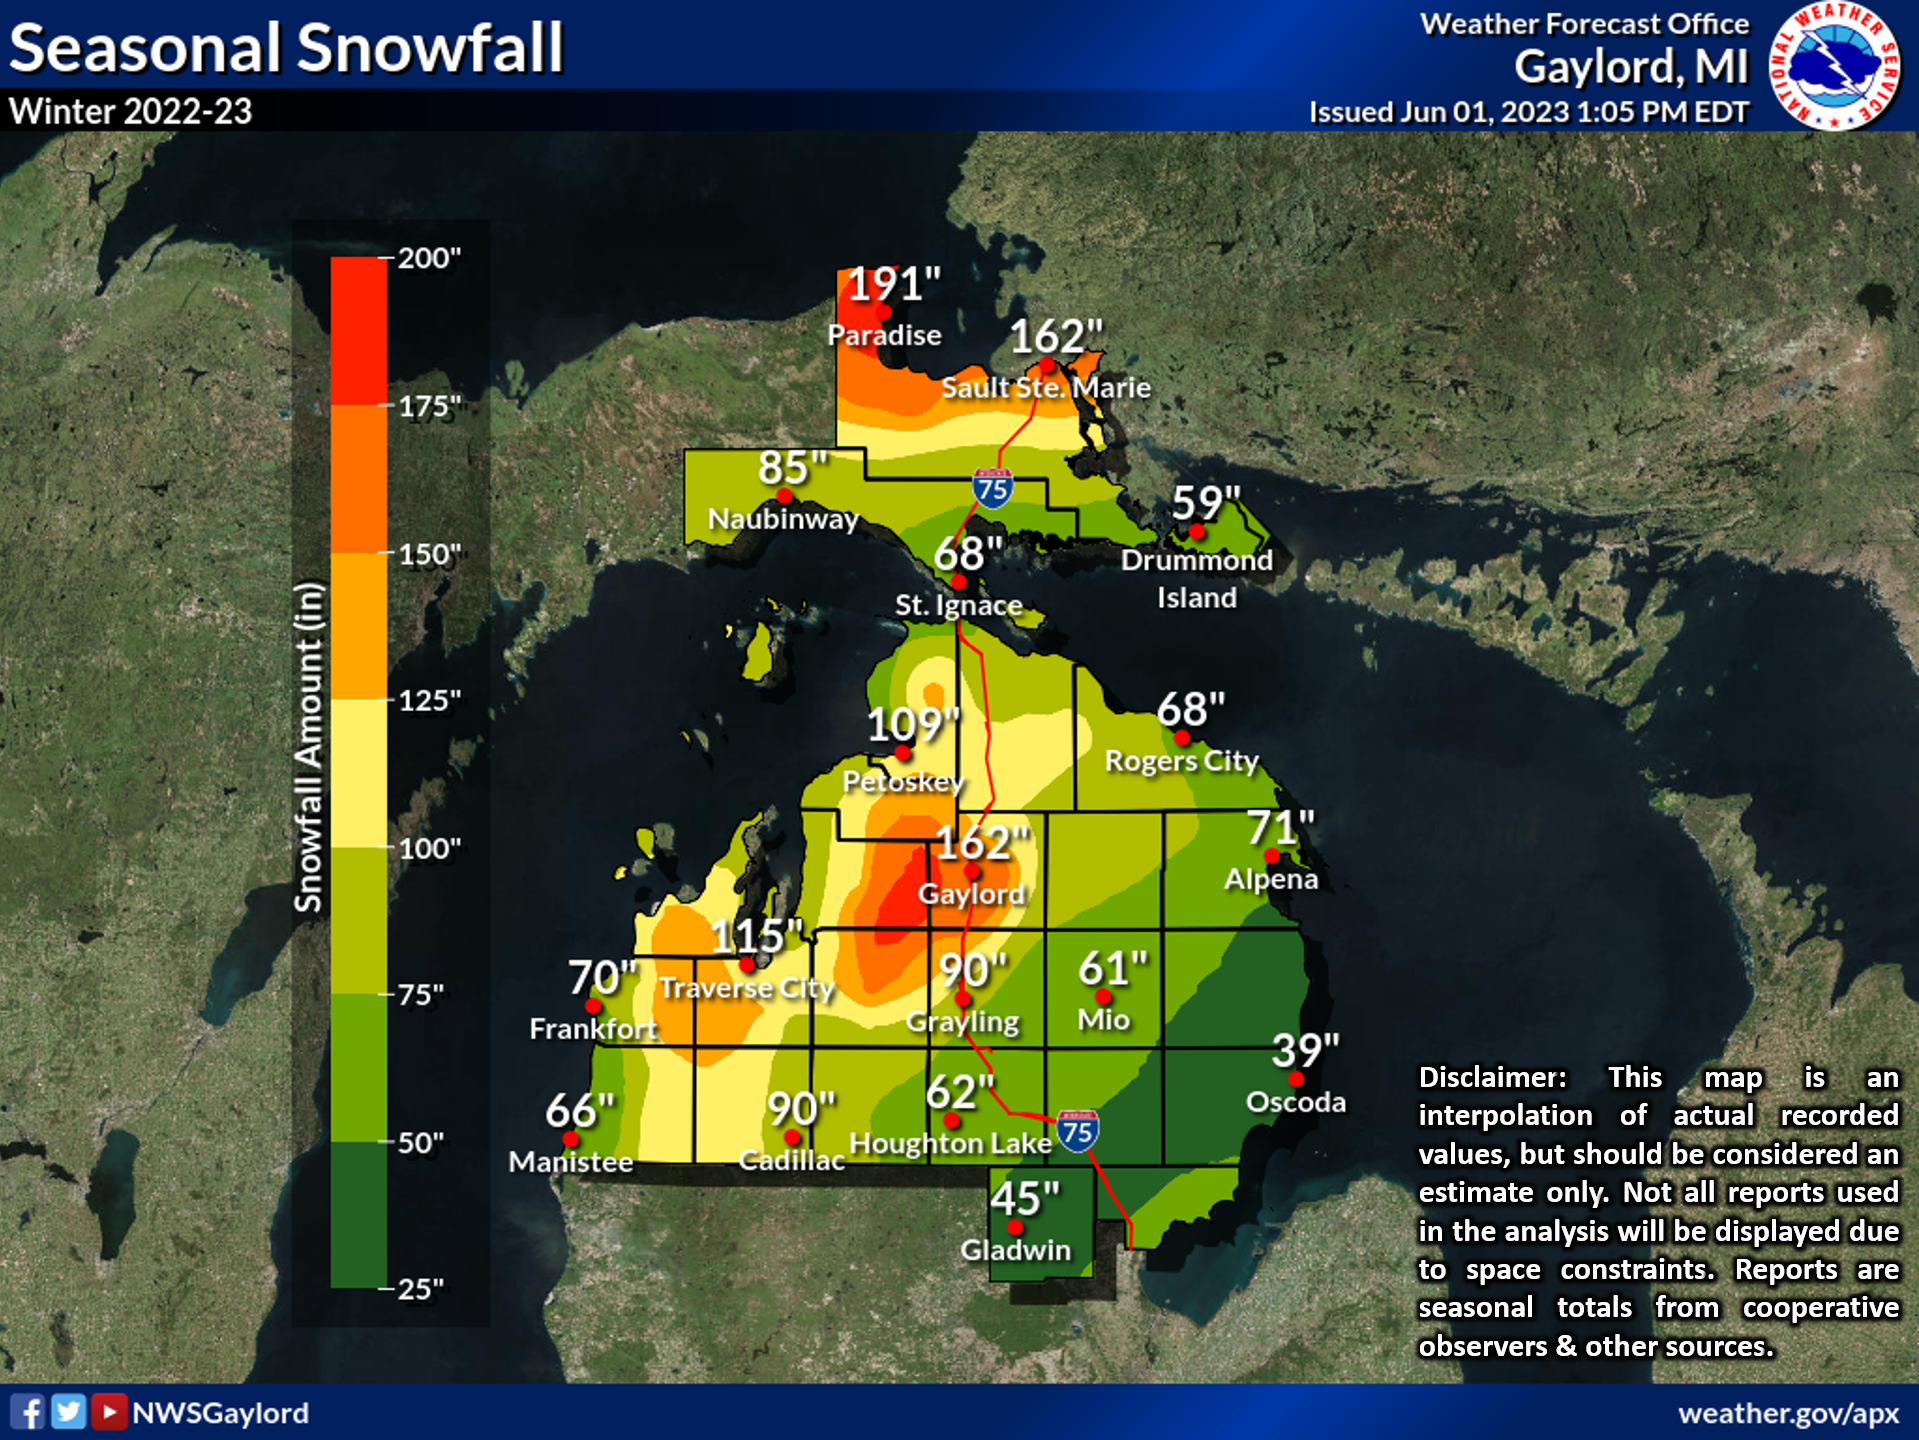
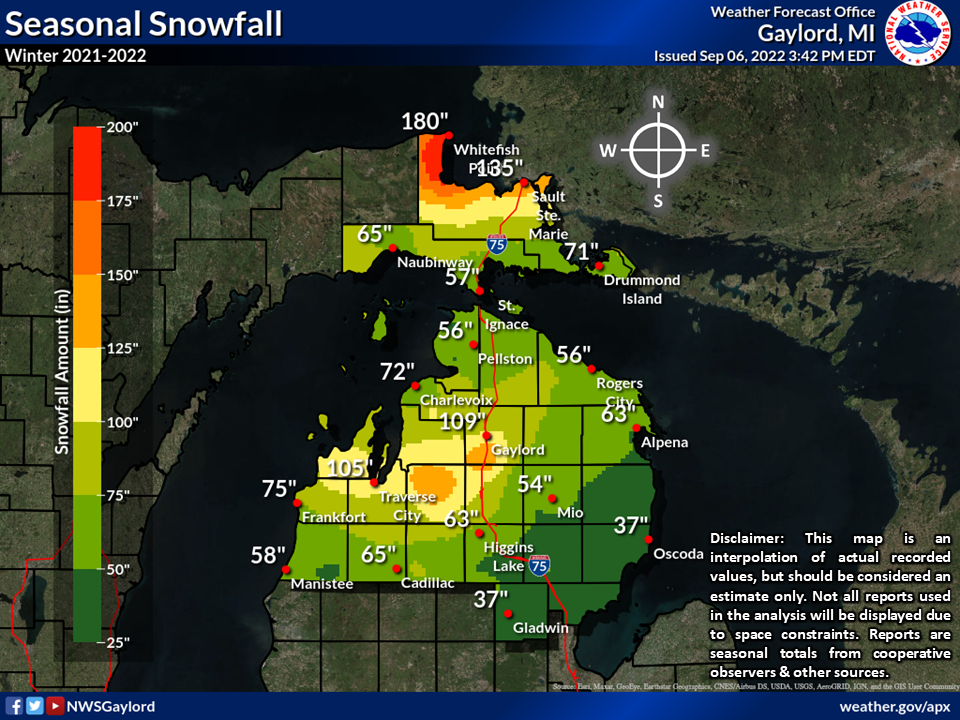
| 2022-2023 | 2021-2022 |
 |
 |
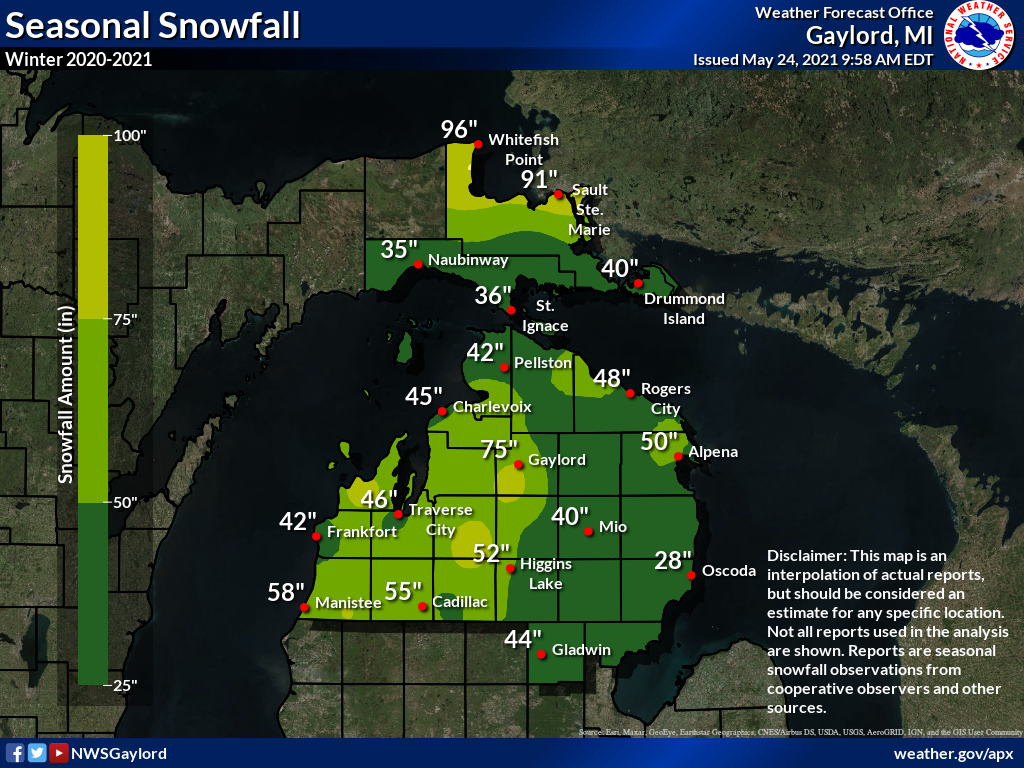
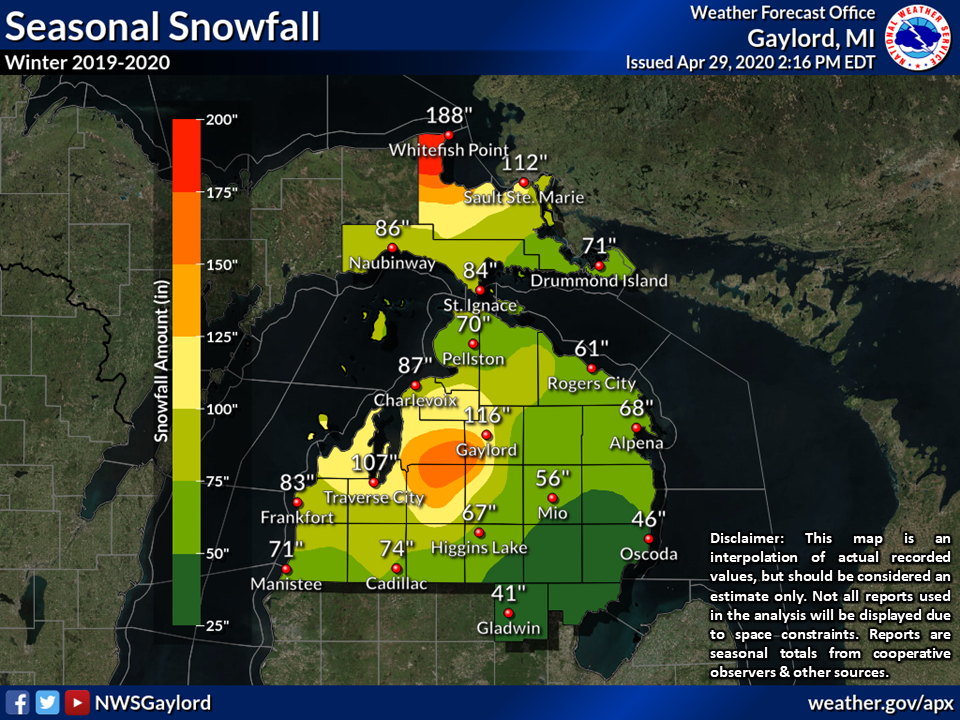
| 2020-2021 | 2019-2020 |
 |
 |
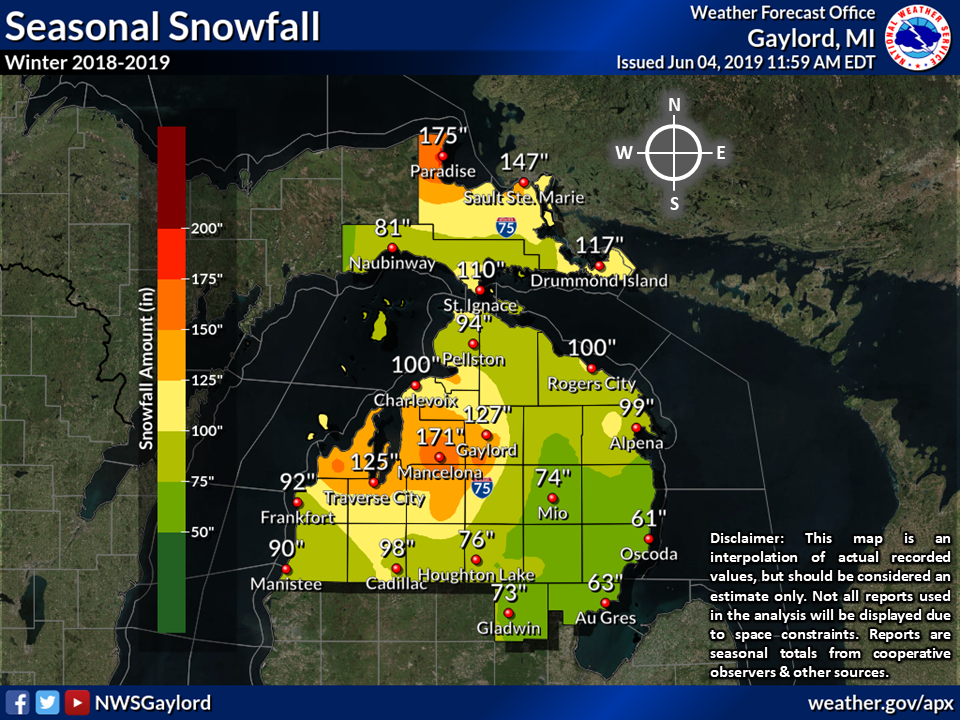
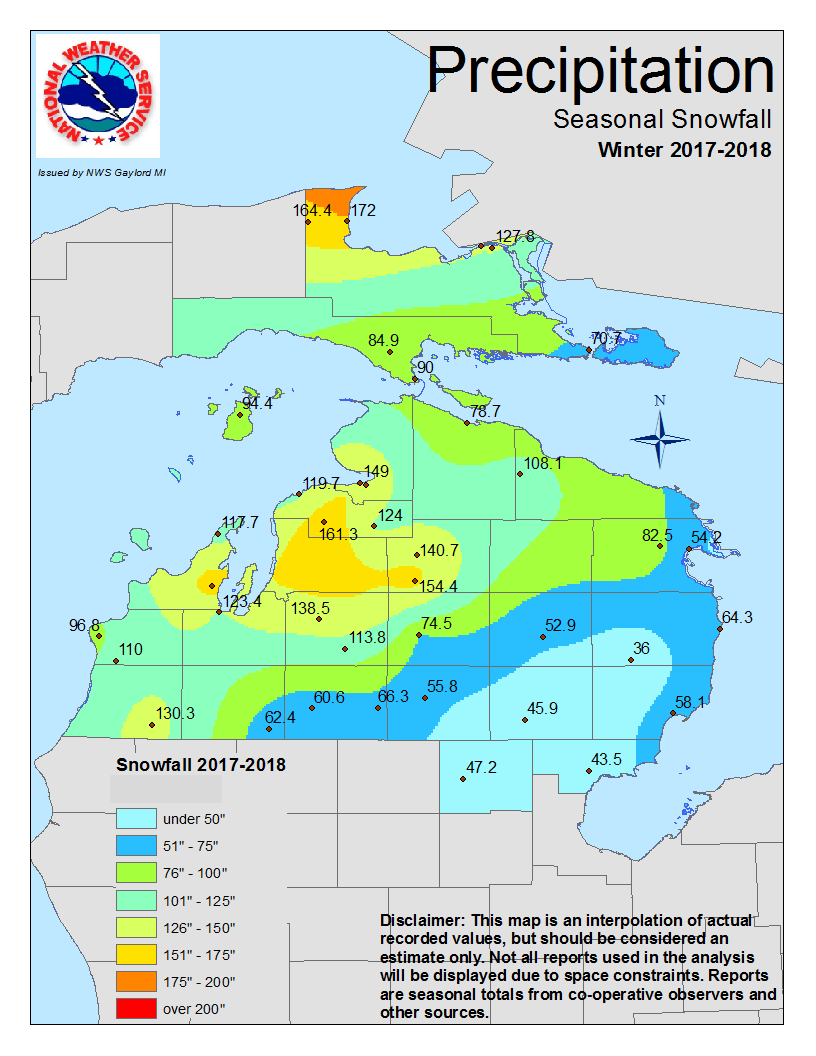
| 2018-2019 | 2017-2018 |
 |
 |
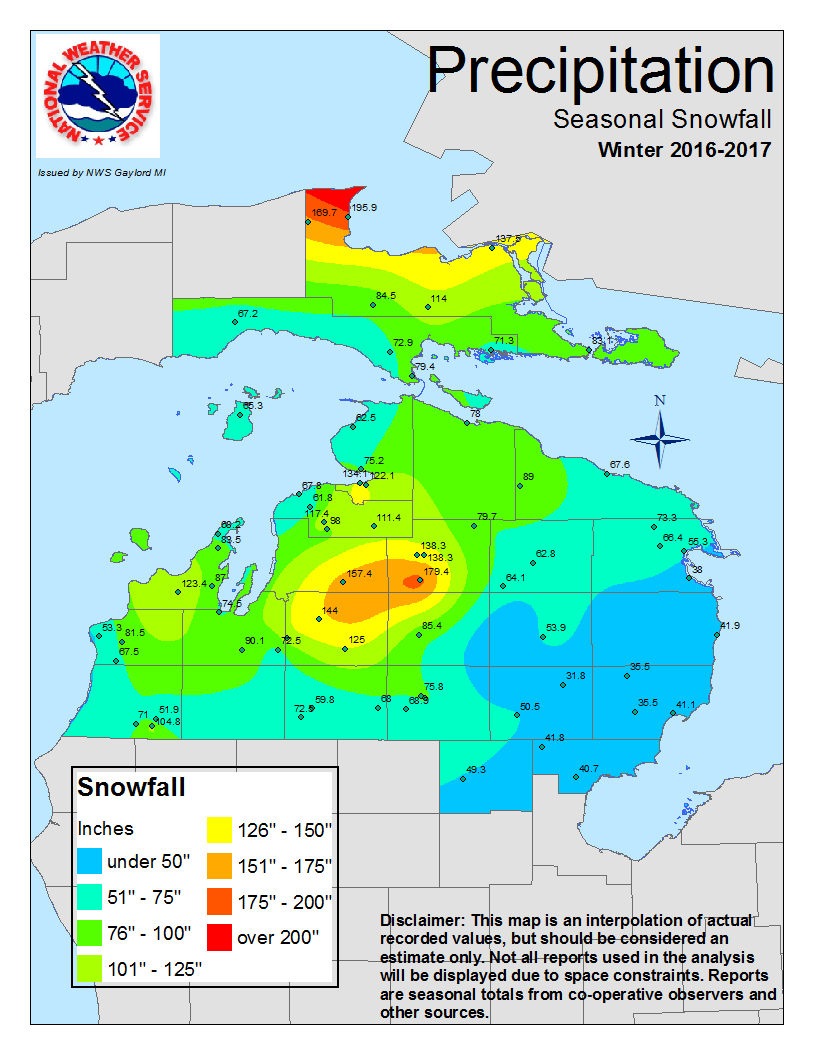
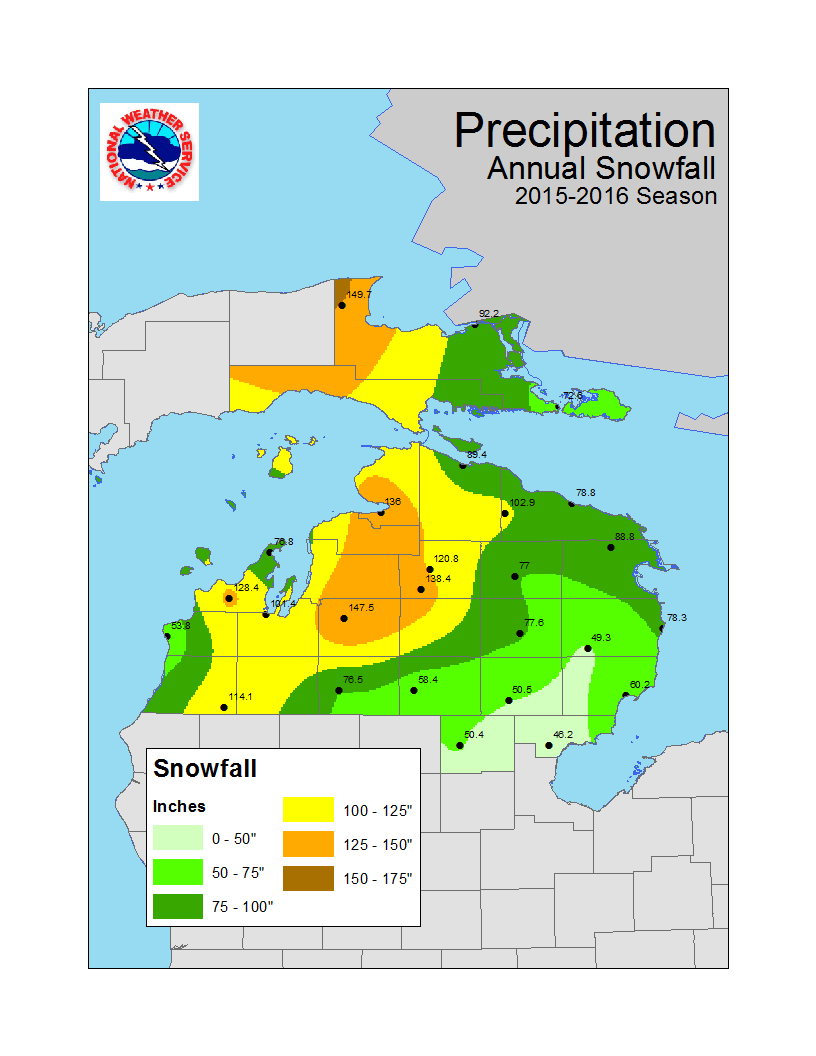
| 2016-2017 | 2015-2016 |
 |
 |
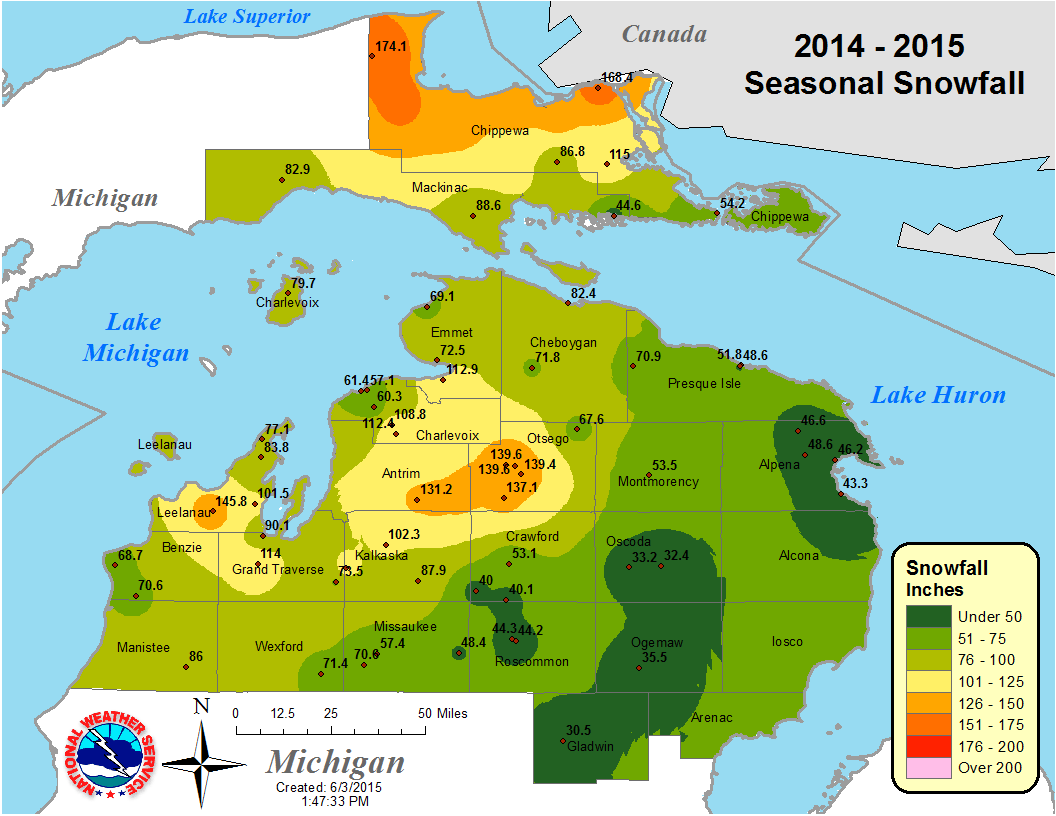
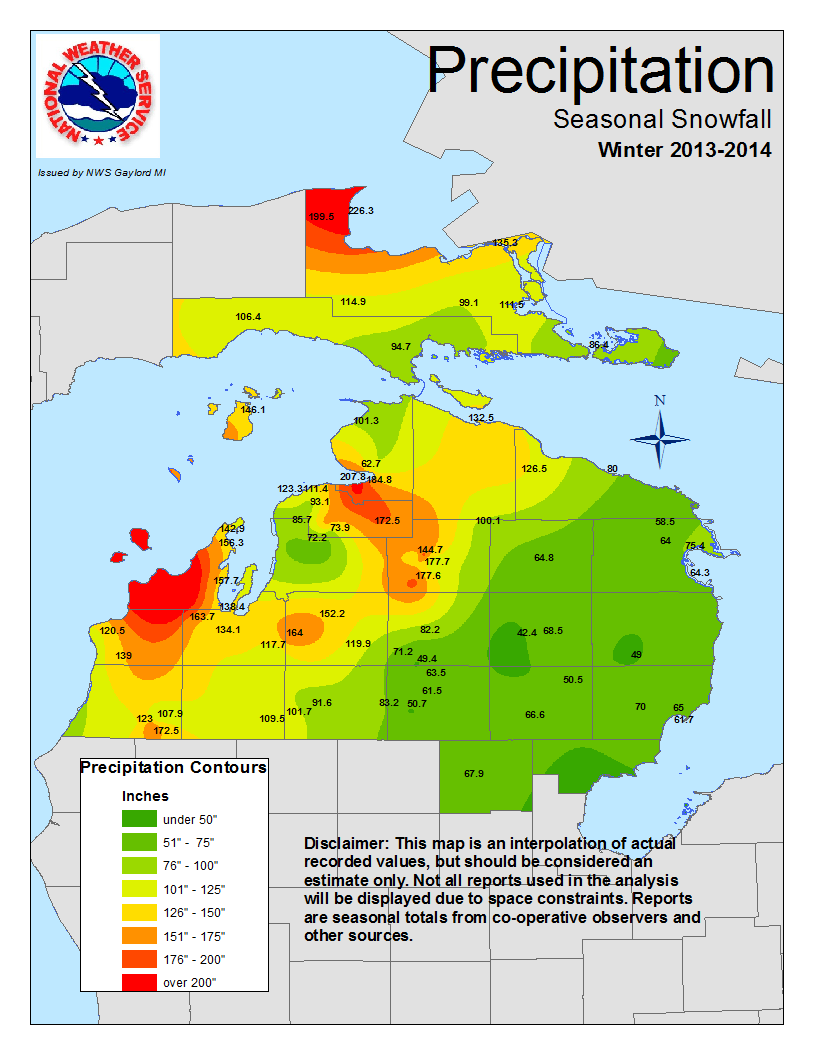
| 2014-2015 | 2013-2014 |
 |
 |
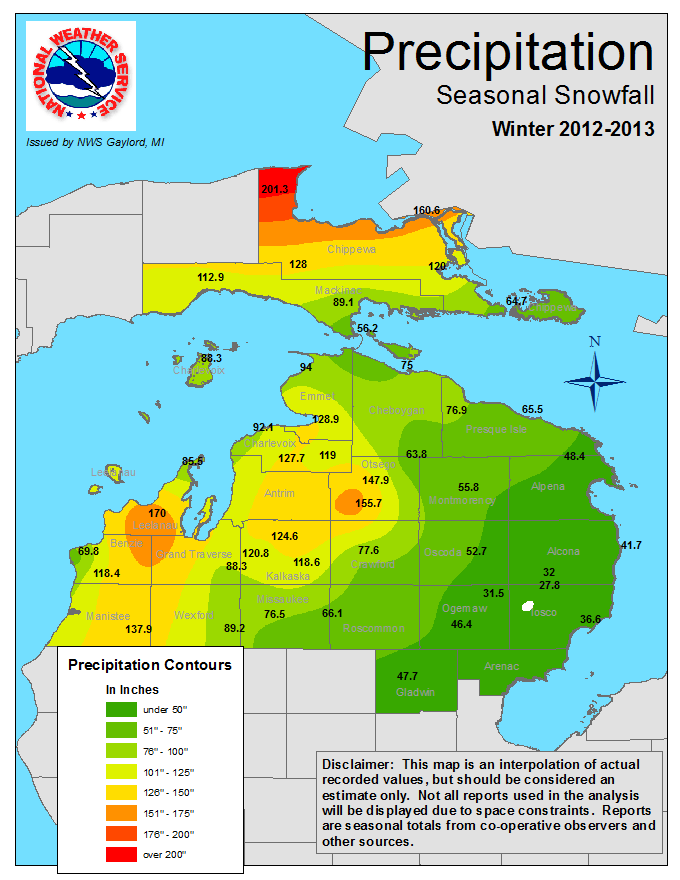
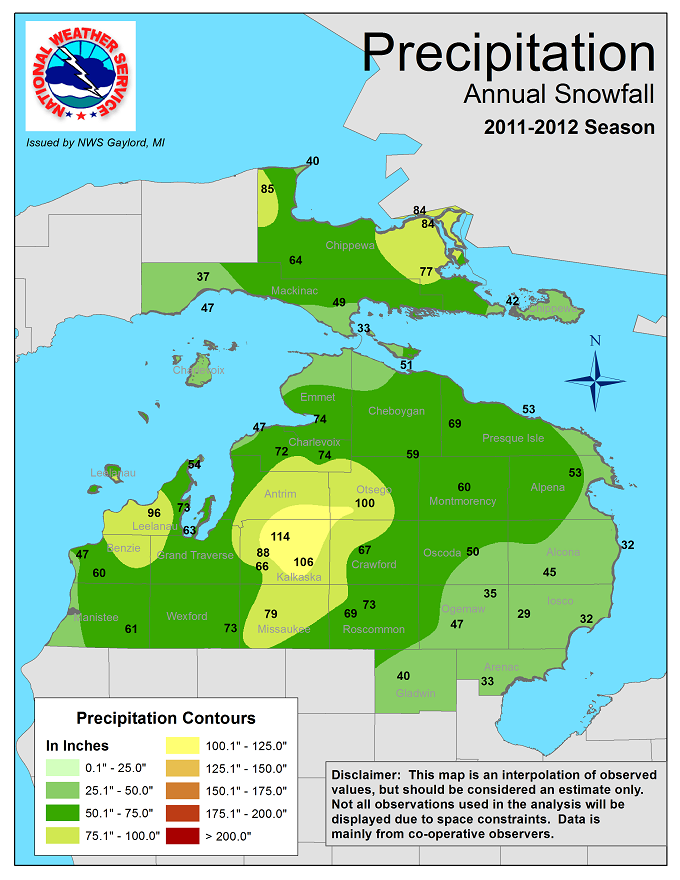
| 2011-2012 | 2012-2013 |
 |
 |
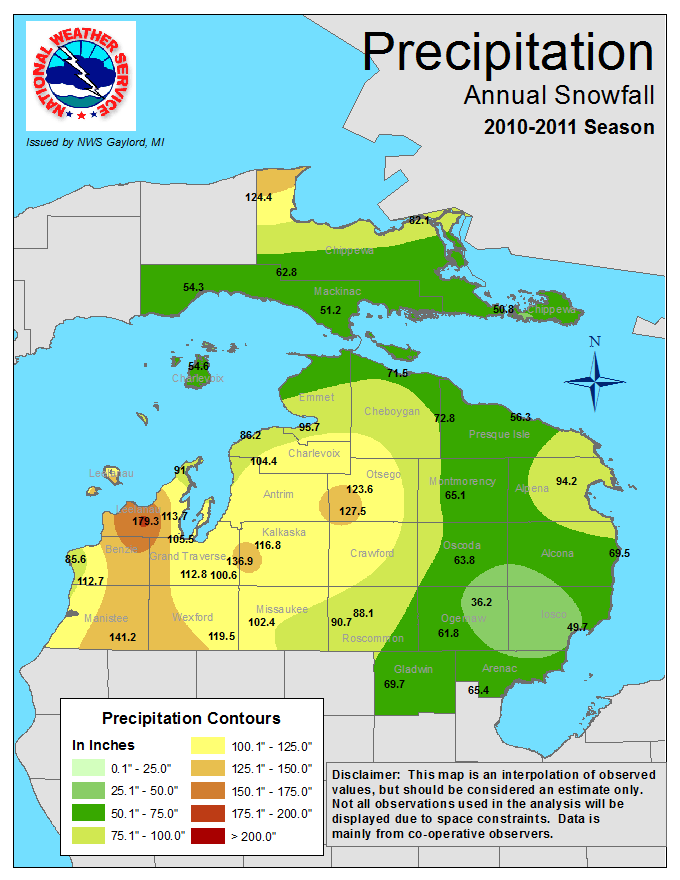
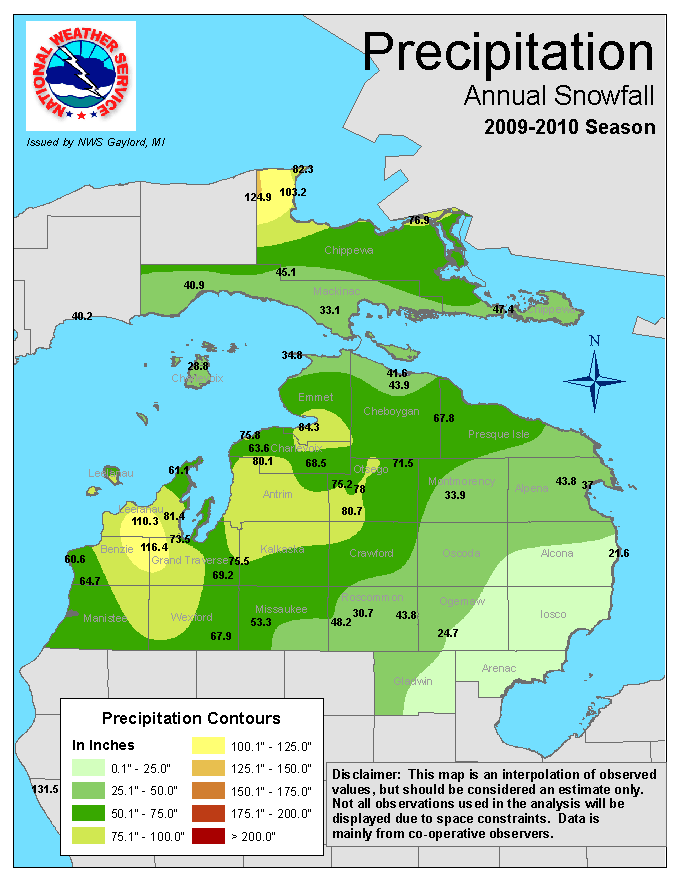
| 2010-2011 | 2009-2010 |
 |
 |
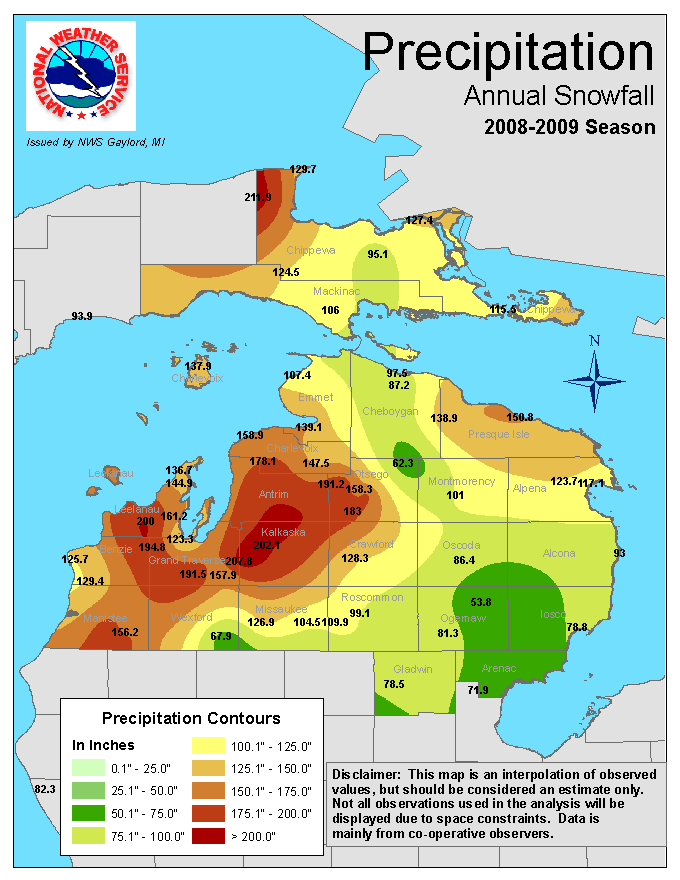
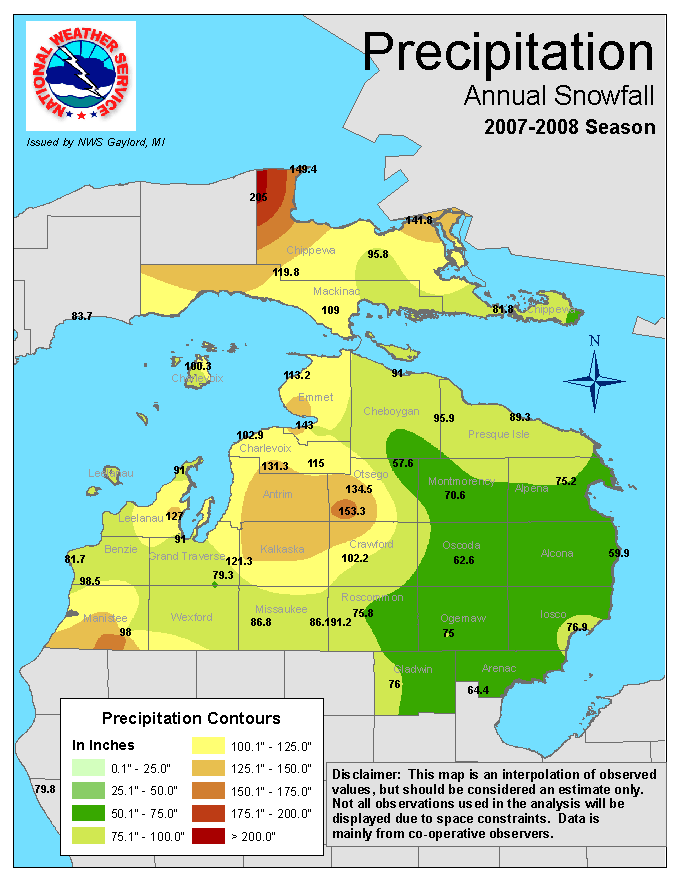
| 2008-2009 | 2007-2008 |
 |
 |
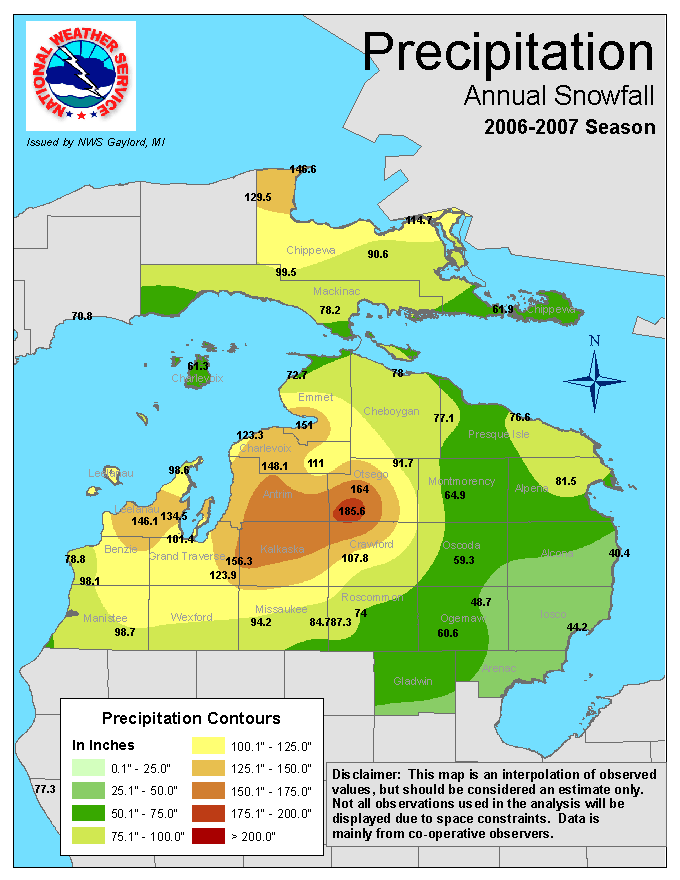
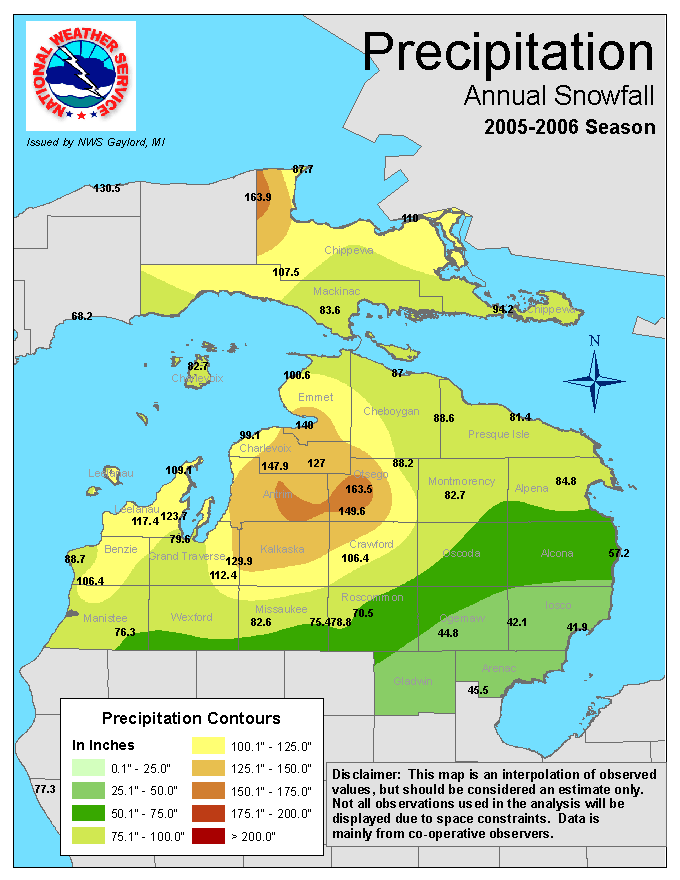
| 2006-2007 | 2005-2006 |
 |
 |
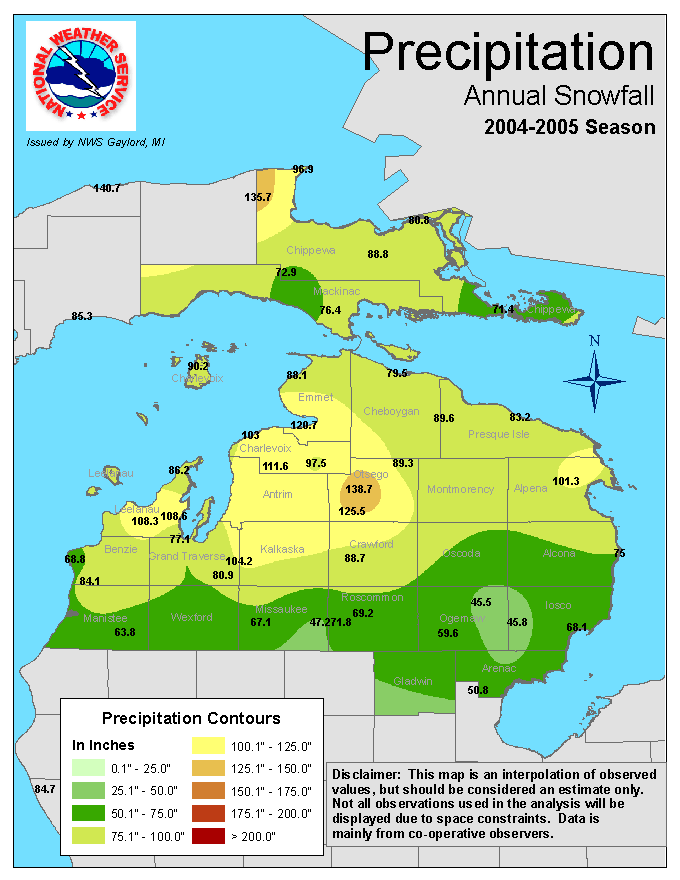
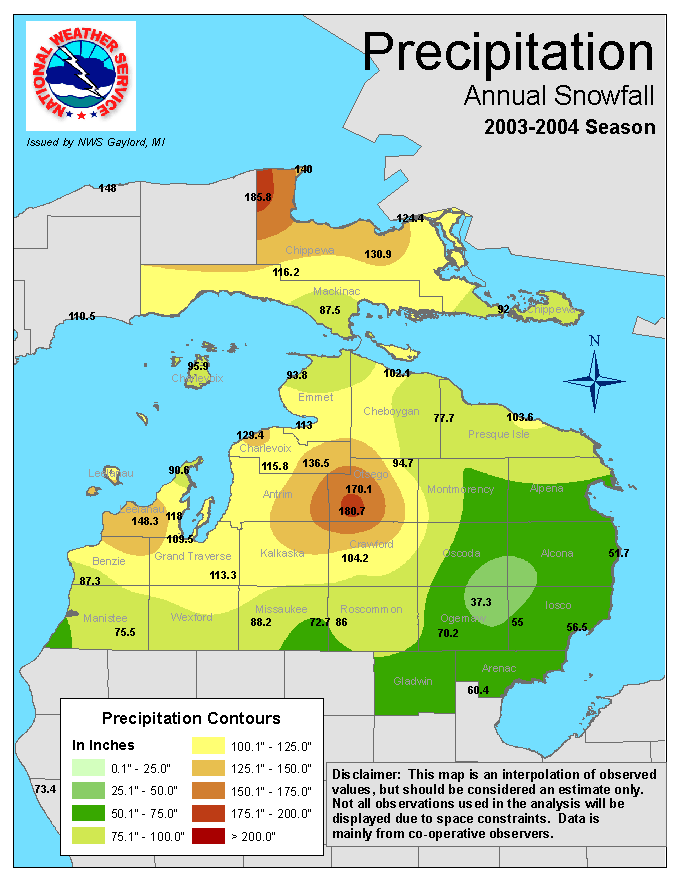
| 2004-2005 | 2003-2004 |
 |
 |
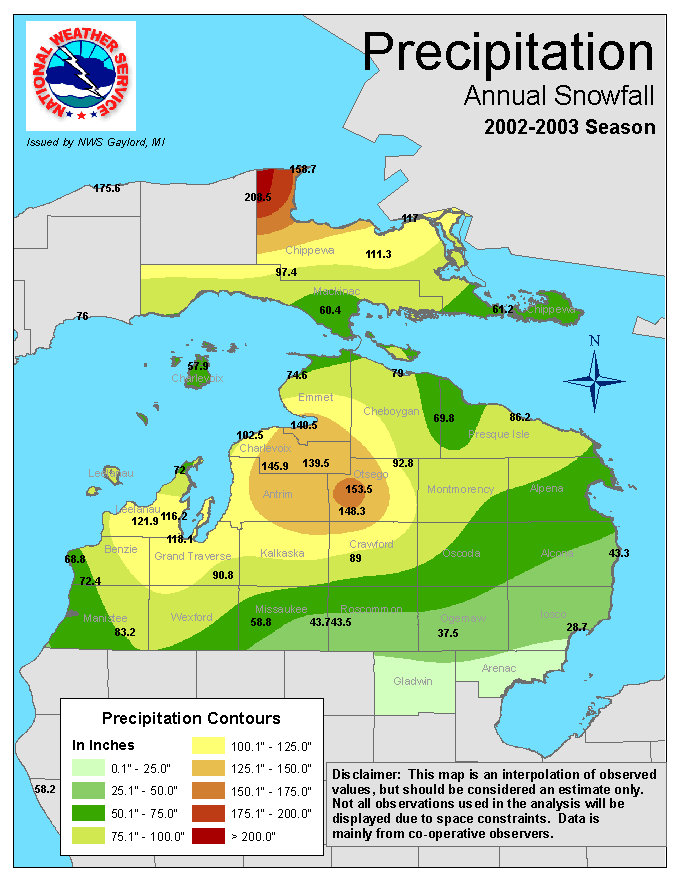
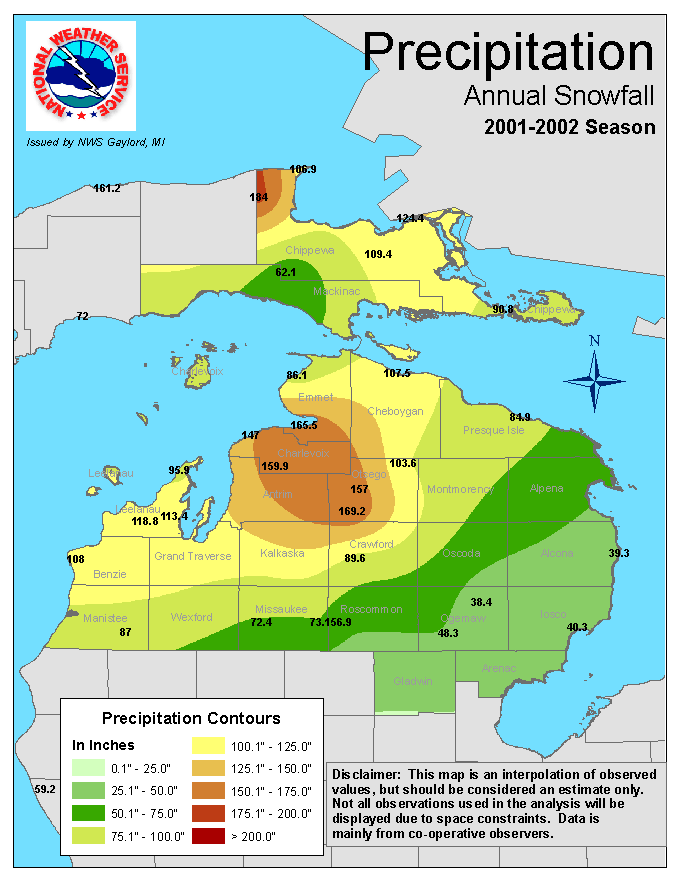
| 2002-2003 | 2001-2002 |
 |
 |
| 2000-2001 | Annual Average |
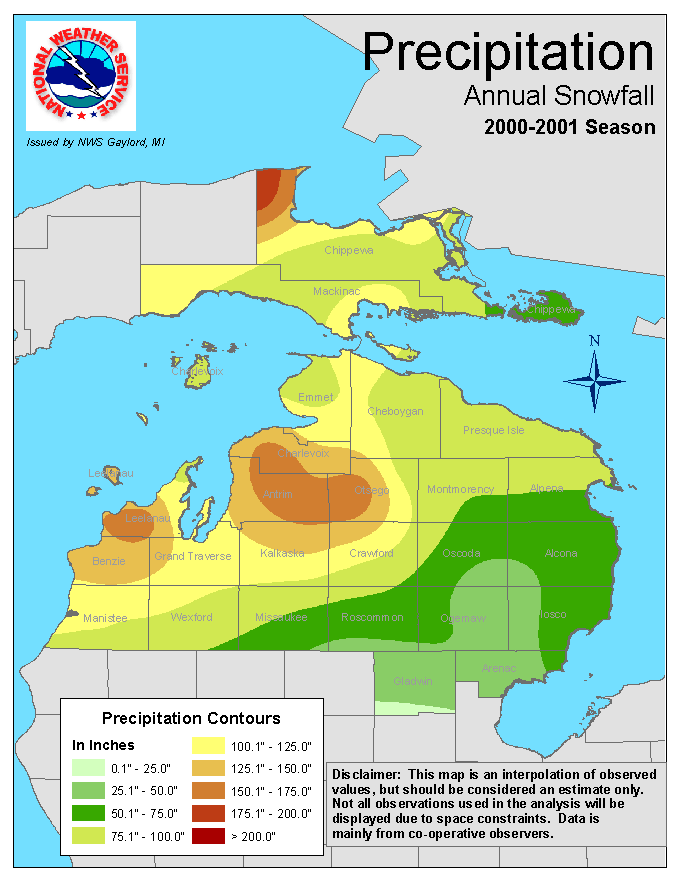 |
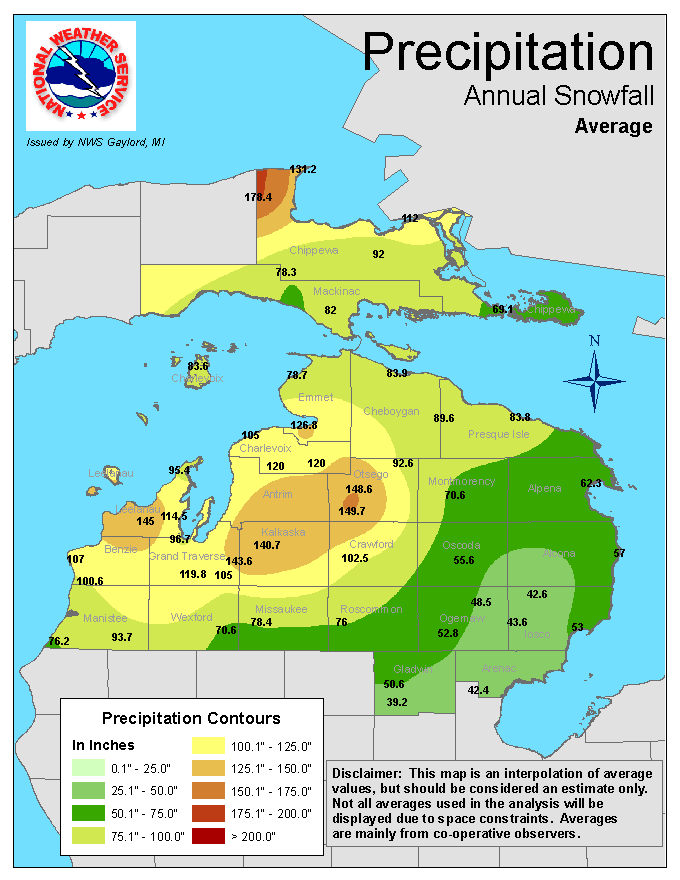 |
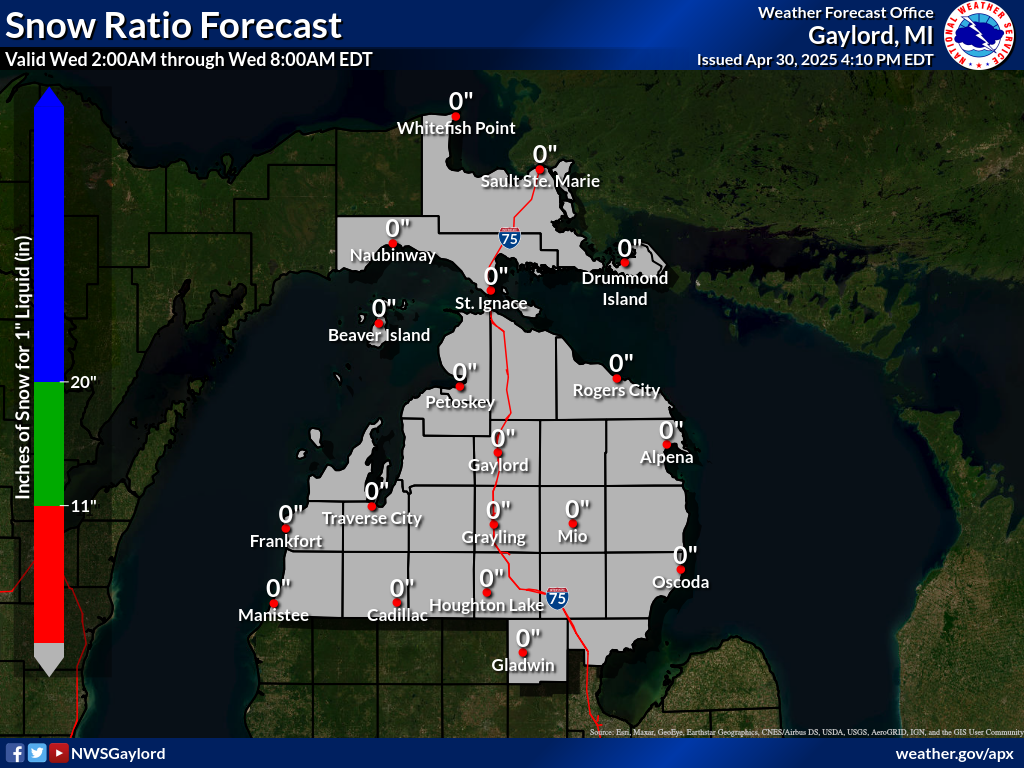
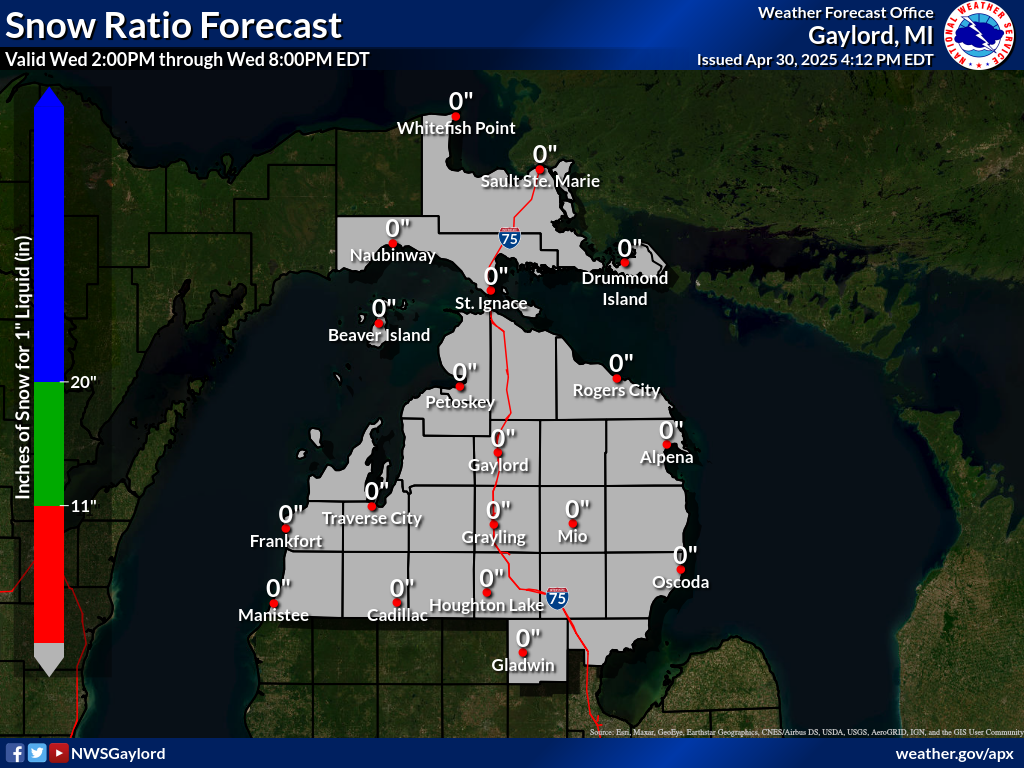
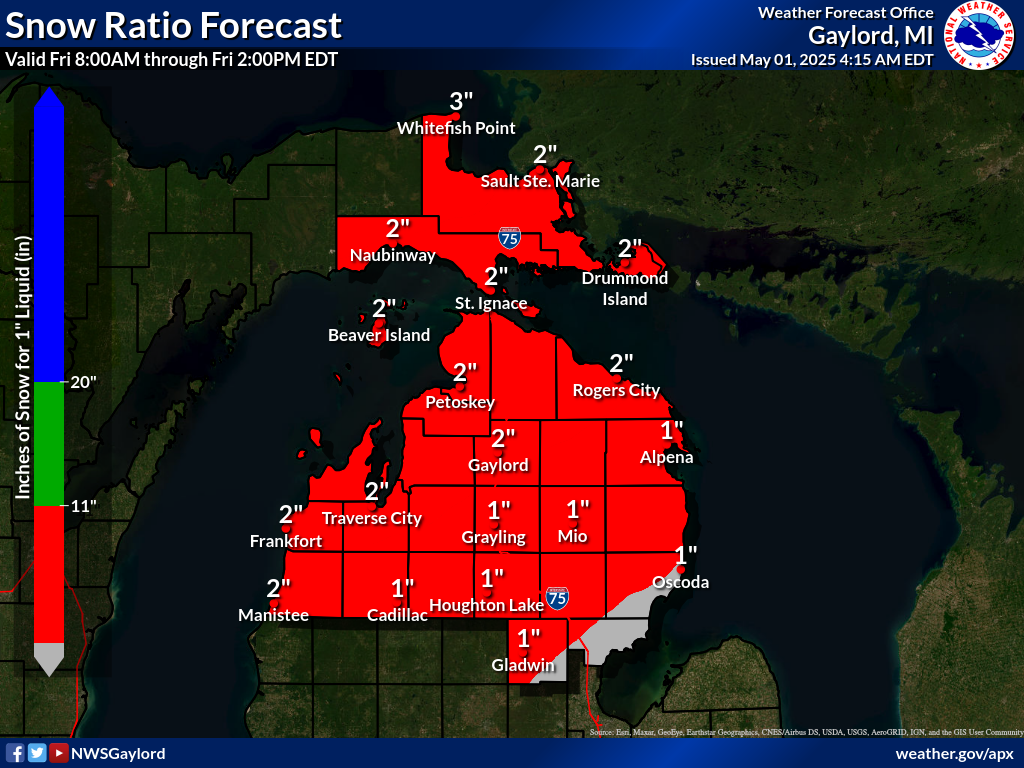
Snow Ratio and Other Snowfall Information
Red Shading (Wet Snow): Ratio of 1-11" of Snow to 1" Liquid
 |
 |
 |
 |
 |
 |
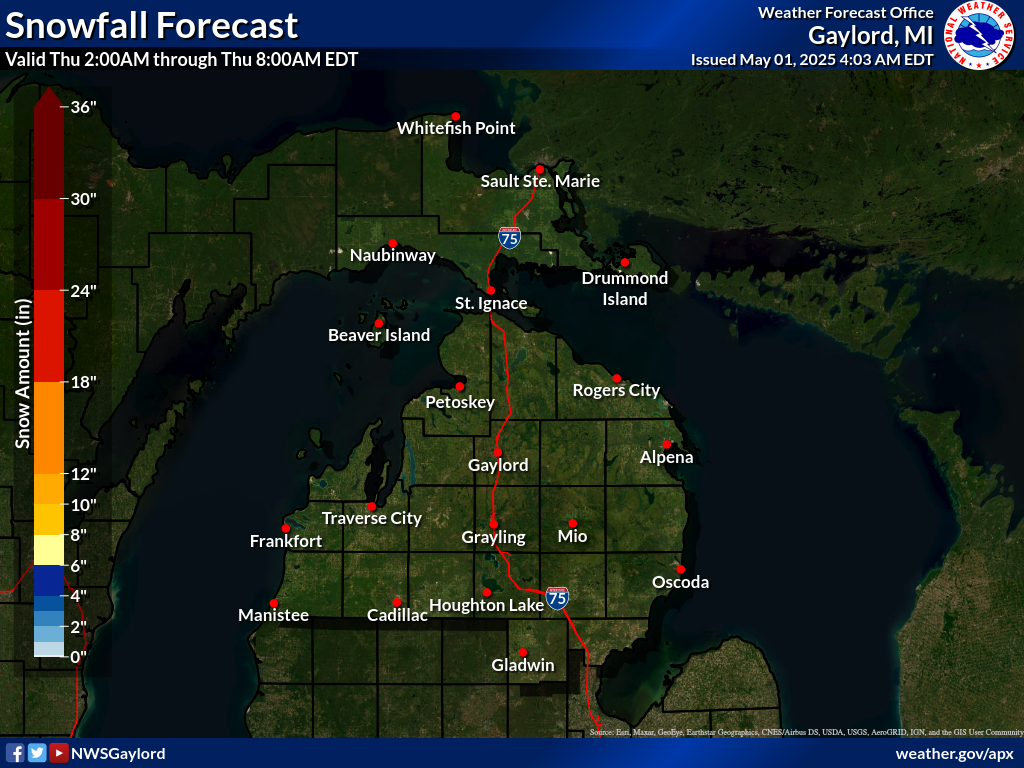
| 24 Hour Snowfall Outlook | 48 Hour Snowfall Outlook | 72 Hour Snowfall Outlook |
 |
 |
 |
| 6 To 10 Day Temperature Outlook | 6 To 10 Day Precipitation Outlook |
 |
 |
| One Month Temperature Outlook | One Month Precipitation Outlook |
 |
 |
| Three Month Temperature Outlook | Three Month Precipitation Outlook |
 |
 |
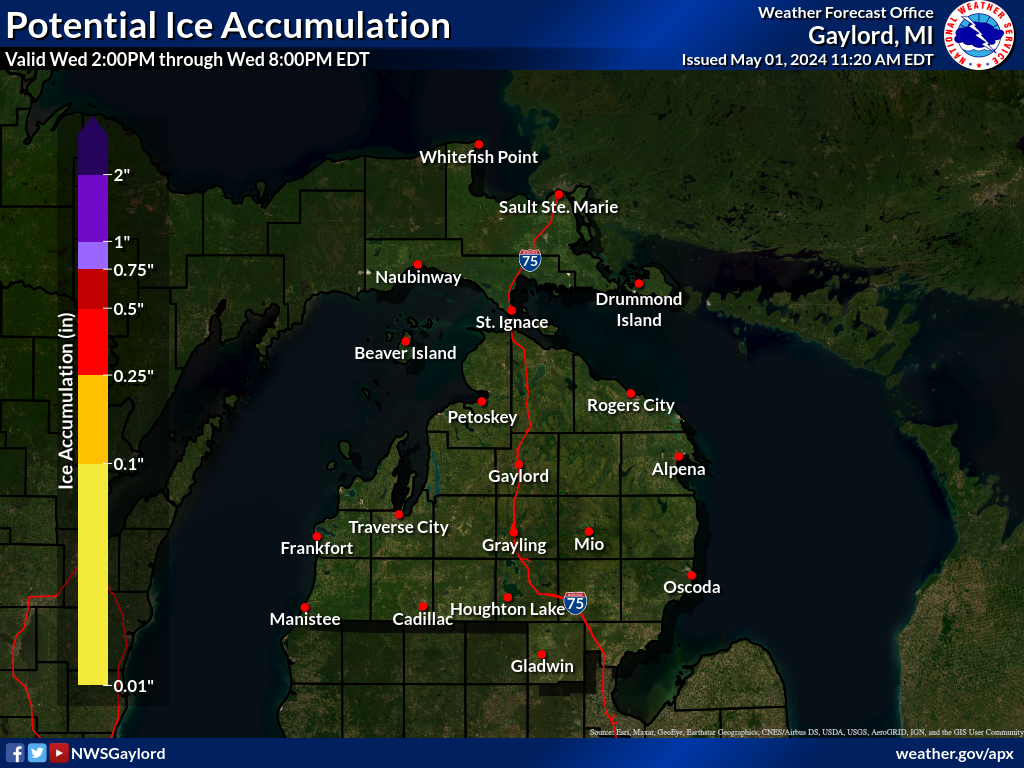
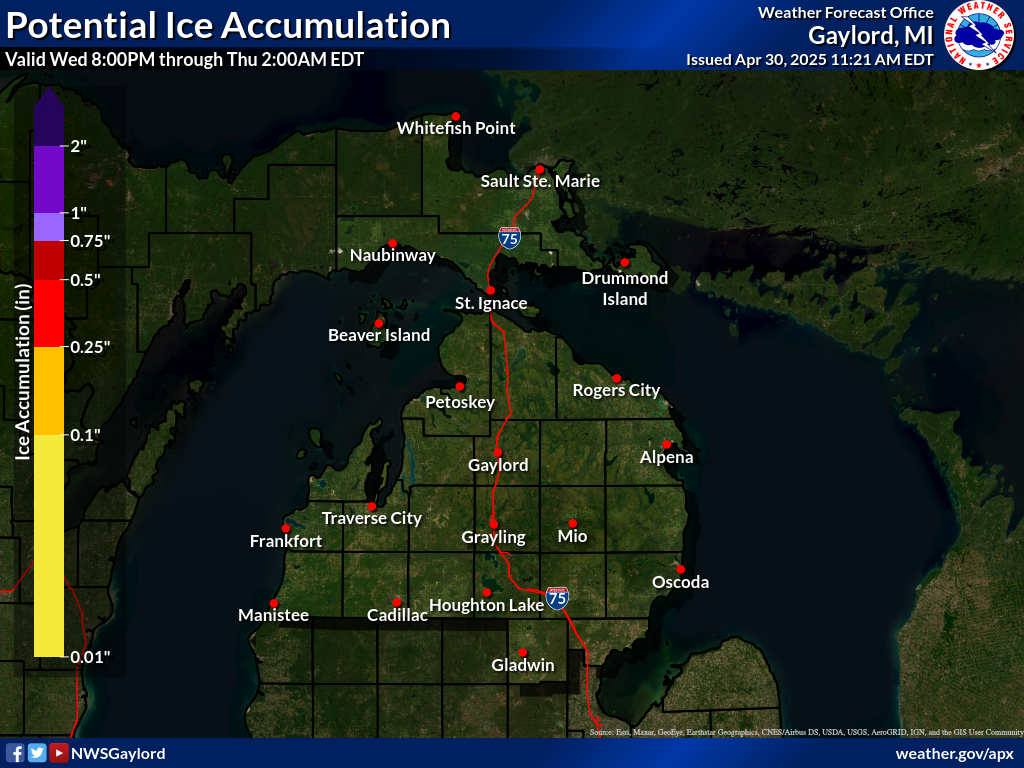
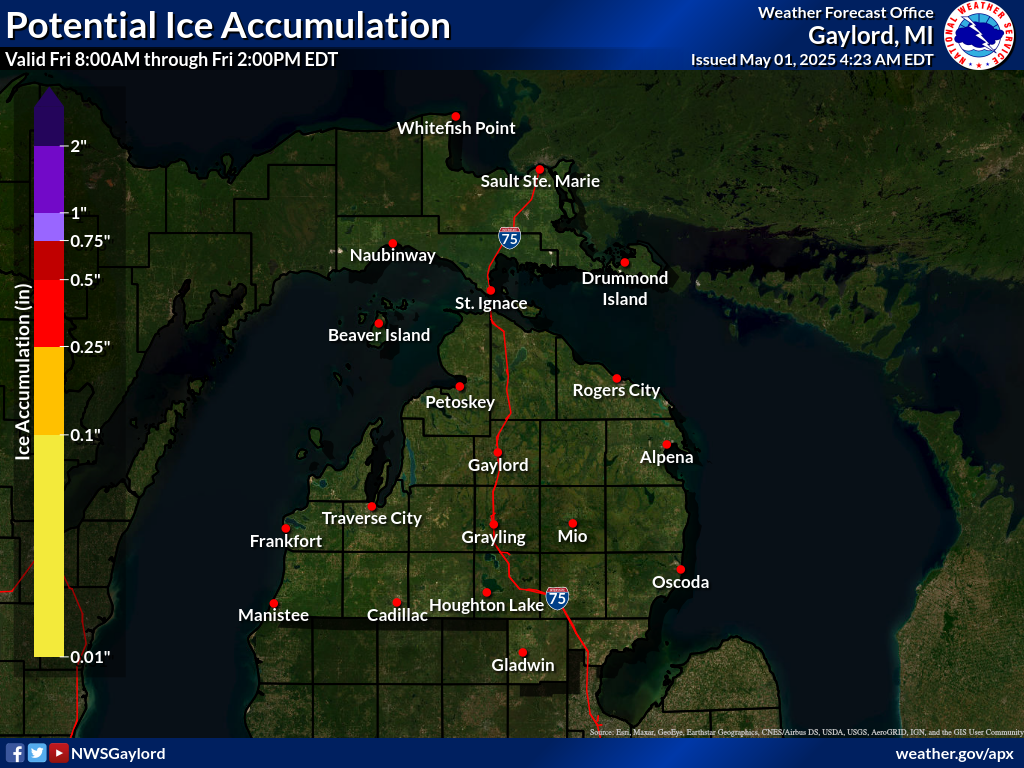
Probabilistic Snow and Ice Forecasts (separate page)
 |
 |