 |
 |
 |
 |
|
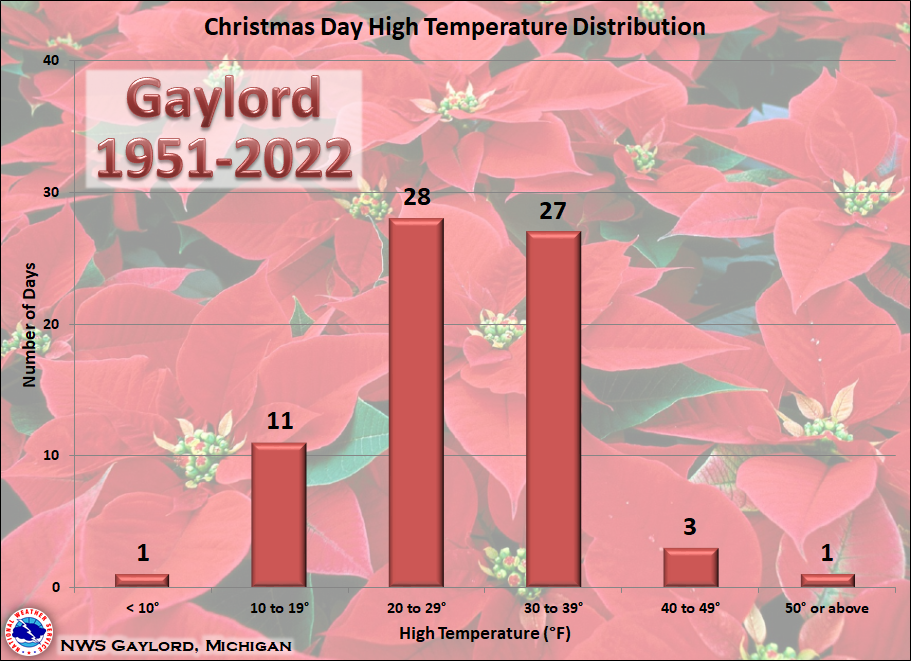
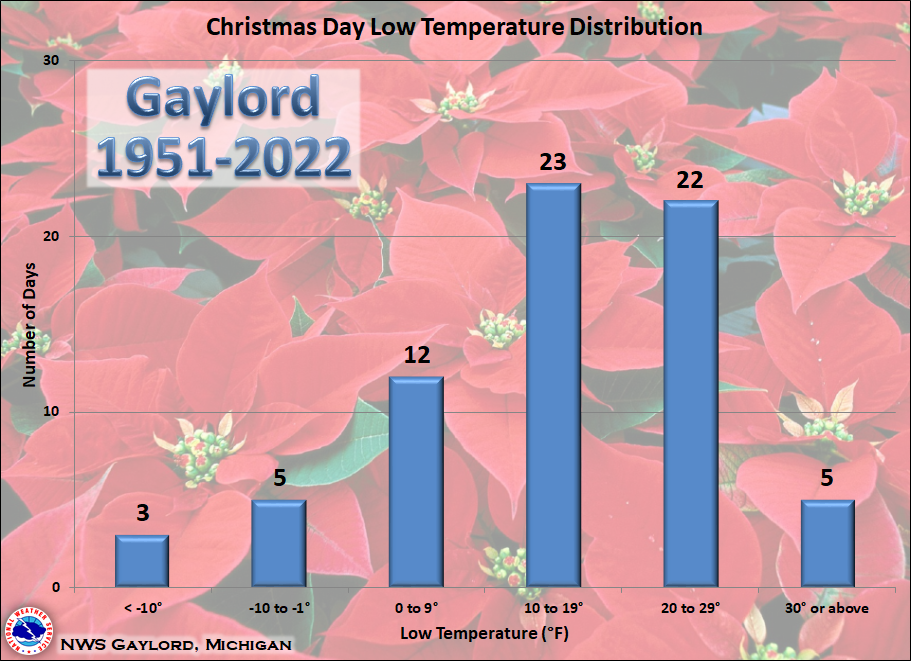
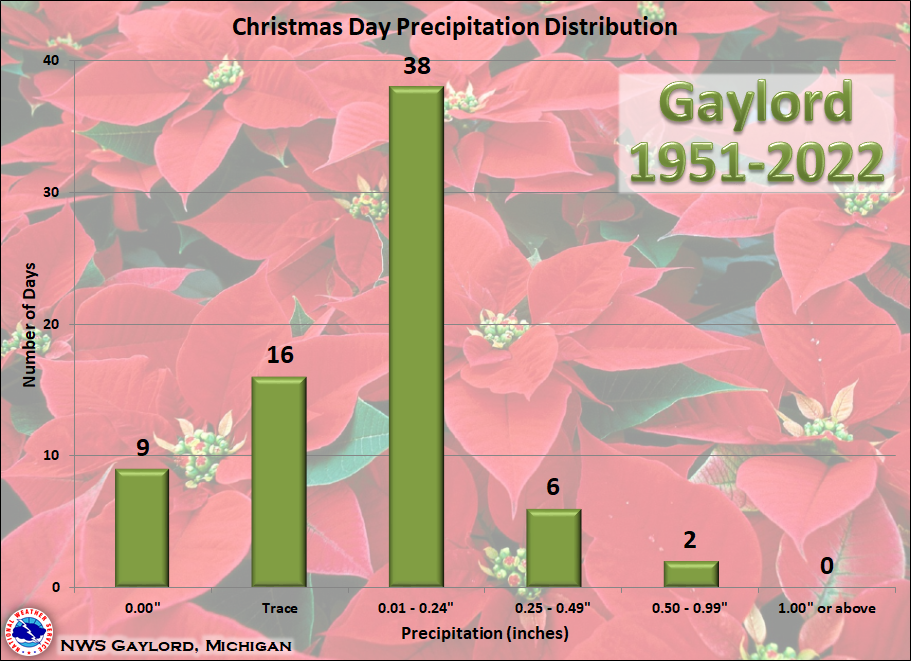
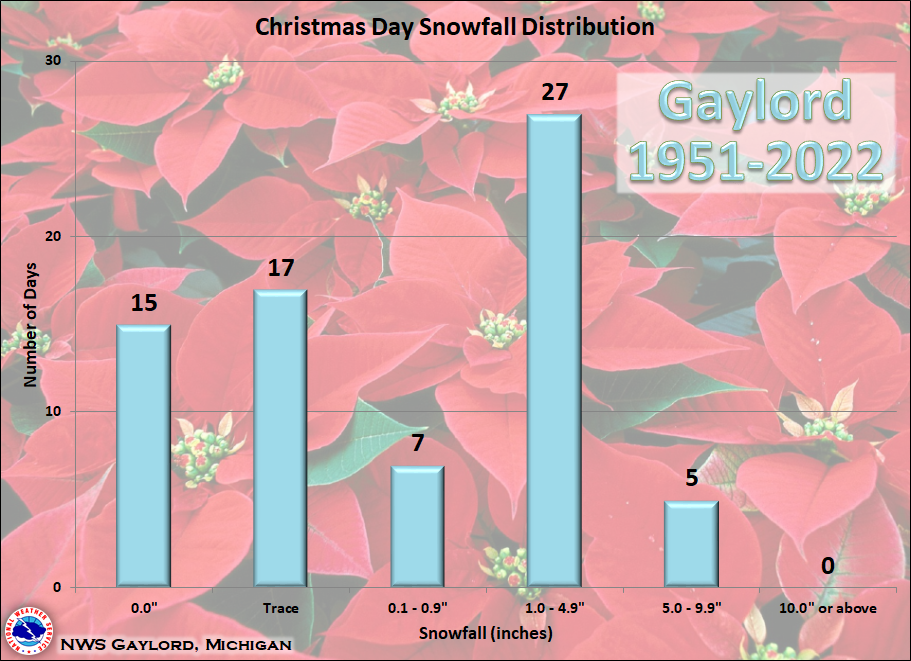
Here is a look at some Christmas Day weather statistics for Gaylord*, with data going back to 1951. As can be seen in the data below, there has been a wide spectrum of temperatures and precipitation on Christmas Day in Gaylord, but highs have generally been in the 20s/30s and lows in the teens/20s. It is also quite common for Gaylord to see measurable snow on Christmas Day. Scroll to the bottom of the page to find out how common a white Christmas is in the Gaylord area. |
A "white Christmas" is defined as having an inch or more of snow on the ground on Christmas morning. How common is that in the Gaylord area? Since snow depth measurements began in Gaylord in 1951, the area has experienced a white Christmas 65 times, or about 92% of the time.
The white Christmas probability map below (click for larger version) was created by NOAA's National Centers for Environmental Information (NCEI) and incorporates data from observing stations with at least 25 years or more of snow depth measurements during the period 1981-2010.

*Data for Gaylord is derived from a composite of observations taken at both Gaylord-Otsego County Airport and the Gaylord cooperative observing station. This data is for informational purposes only and does not meet climatological standards. This data set may include periods with missing data and data that has been recorded from different observing locations over time.