 Email the author
During the night of December 28 through the day of December 29, a sub-980 mb low passed by to the north and west of the region, with the center taking a track largely parallel to the St. Lawrence Valley but a few hundred miles north. Despite such a powerful low taking a track well to the northwest and a lack of a strong initial cold high to the north, this event caused widespread freezing rain. This was aided by an antecedent cold airmass that extended far south through the Mid-Atlantic, an extensive snowpack, a weak pressure gradient limiting warm-air advection, and a secondary low developing on the triple point to the south. In the end, between two tenths and four tenths of an inch of ice accumulated in most places, though there were a few locally higher amounts just above the 0.5-inch mark east of the Greens and in southern Essex County, NY (Figure 1). Power outages in Vermont peaked at 6,320 during the morning of the 29th and there were widespread travel disruptions throughout the duration of the event.

Figure 1: Observed ice totals (in inches) 12/28-12/29, 2025. [click to enlarge]
This low-pressure system formed east of the front range of the Rockies, in a typical place for lee side cyclogenesis. It was previously a strong pacific low that came ashore in California that brought several feet to the Sierra Nevadas, with 67 inches reported at Mammoth Mountain. The new low developed on a strong upper trough digging to the west of our region as a ridge tried to amplify to the east (Figure 2). The low quickly strengthened as it moved northeast into the Great Lakes Region, dropping below 980 mb over Michigan. However, this low was running into a modified arctic air mass that had been firmly in place for a few days.

Figure 2: 500 mb analysis 12/29 0000Z. [click to enlarge]
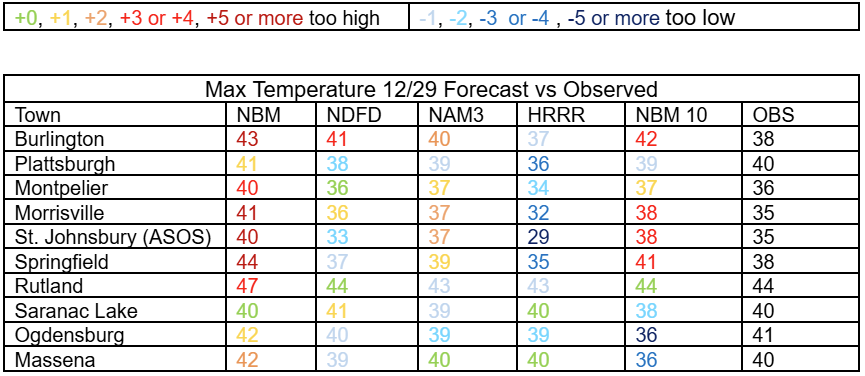
This antecedent arctic airmass provided the surface cold air for freezing rain, and remained in place despite warming air aloft. During the day on the 28th, a strong temperature inversion became established (Figure 3). While the 00Z sounding from Albany, NY (Figure 3) is located just south of the region, it effectively characterizes the regional airmass. By afternoon, Whiteface and Mansfield were in the mid to upper 30s while nearly everywhere else was in the 20s (Figure 4). BTV only hit 27 during the day. With extensive snowpack, light wind, and a December sun angle, the surface was able to radiate very efficiently despite a warming airmass aloft. Of note the National Blend of Models (NBM), the basis of most National Weather Service forecasts, exhibited a pronounced warm bias for both the daily maximums and minimums, failing to resolve the intensity of the arctic air mass.

Figure 3: 00Z Sounding 12/29 from Albany, NY. [click to enlarge]
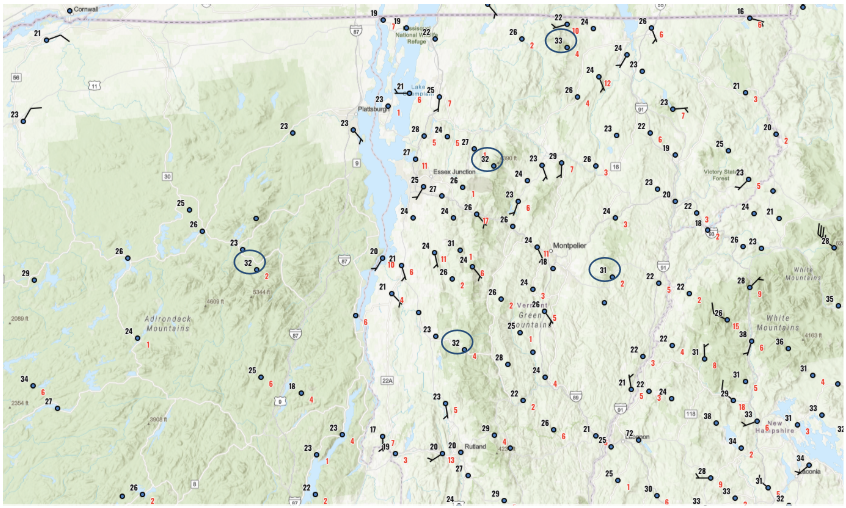
Figure 4: The 1PM station plot on 12/28/25. Temperatures are shown (black, °F). Not shown are the mid-slopes of Whiteface and Mansfield in the mid to upper 30s. Circled are a selection of high elevation sites. [click to enlarge]
Precipitation arrived during the evening of 12/28 with a typical, elongated warm front. Temperatures were below freezing outside a few parts of the western Adirondacks where localized southerly downsloping was occurring (Figure 5). An elevated warm nose had been firmly in place so any snow was easily melting in the warm layer, and the cold layer beneath it was not deep enough to refreeze the precipitation before it reached the surface. While some sleet was likely present immediately at the onset, the vast majority of the precipitation began as freezing rain.

Figure 5: Mosaic composite reflectivity (dBZ) at 0320Z on 12/29 overlayed with station plots. [click to enlarge]
As is typical in warm-air advection in the region, the temperatures first rose above freezing in the parts of the western Adirondacks and then the immediate Champlain Valley. SLK was the first airport to change to rain, only seeing 0.05 inches of freezing rain before temperatures rose above freezing around 11 PM. This was modeled well. By 1:30 AM on December 29th, temperatures at BTV rose above freezing, but not after a quick 0.18 inches of freezing rain accumulated. It took a few more hours for the rest of the Champlain Valley to rise above freezing as many of the areas protected from the winds warmed up slower. By 7 AM, the only below freezing spots were the typical cold areas, east of the Greens, the St. Lawrence Valley and southern Essex County NY. (Figure 6). By around 10 AM, temperatures were above freezing except in the coldest hollows in the aforementioned locations.

Figure 6: Station plot at 12Z on 12/29. Temperatures are shown (black, °F). [click to enlarge]
A caveat here is that while air temperatures rose above freezing for the vast majority of areas, they did not go up much farther and were several degrees below the NBM almost region wide. The combination of the barely above freezing temperatures and very cold surfaces from the antecedent airmass caused ice accumulations to continue through the morning after temperatures rose above freezing in many places, particularly on dirt roads. This was even true in parts of the Champlain Valley where temperatures rose above freezing relatively early. As the low tracked up just north of the St. Lawrence Valley during the day on the December 29th, the pressure fell to its minimum of 978 MB, impressively low for a system that brought relatively light wind on the front side. During the day, a secondary low quickly began to develop on the triple point that was situated over southern Vermont and New Hampshire, before becoming the primary low over the Maine coast (Figure 7). This development helped further weaken the warm-air advection, and temperatures maxed out in the morning in many places before the final cold front came through in the afternoon.
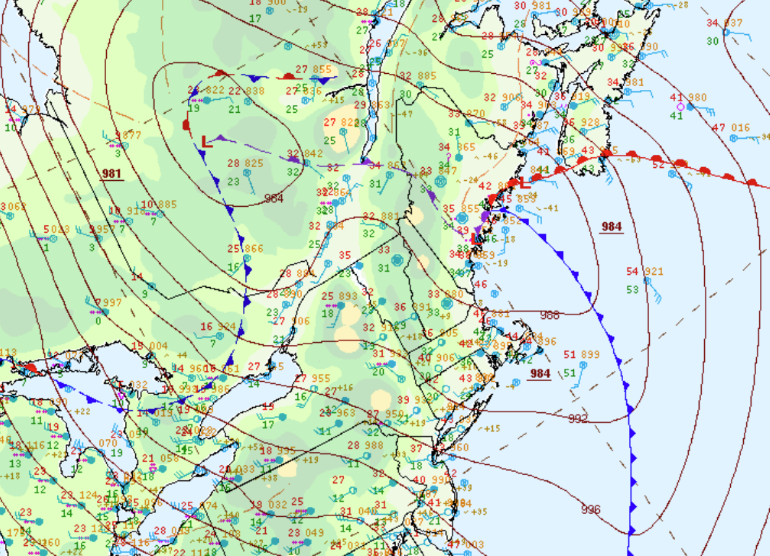
Figure 7: Surface Map 00Z Tuesday 12/30. [click to enlarge]
By the time the occluded front came through, the secondary low matured enough to bring an area of stratiform precipitation back into the region, which intensified over northern Vermont. Under dynamic cooling and cold air advection aloft, the precipitation changed to snow in the mountains, where one to two inches were observed. A few flakes were seen below 1,000 feet, but never in the immediate Champlain Valley. However, the precipitation quickly moved out to the east before more significant accumulations could occur. An interesting phenomenon here is that temperatures more or less cooled from top down, so there was no significant warming from downsloping in eastern Vermont and the Champlain Valley behind the front. By the time surface winds turned westerly, the warmer temperatures aloft had advected out so the associated increased mixing did not cause much warming (Figure 8). To highlight this, Saranac Lake had higher temperatures than Burlington which had higher temperatures than Springfield and Lebanon (Figure 9).
Figure 8: HRRR forecast sounding for Montpelier, VT (MPV) Initialized 12/28 12Z for 12/28 23Z – 12/30 02Z. [click to enlarge]

Figure 9: Observed high temperatures (°F) on 12/29.[click to enlarge]
After the passage of the cold front and the associated end of the freezing rain, the effects of the storm system were not over. The pressure gradient behind the low was much stronger than the gradient ahead of it, and strong cold air advection led to efficient mixing. Therefore, there were widespread wind gusts between 25 and 45 mph. However, a southwesterly sting jet moved over the St. Lawrence Valley in the afternoon and was enhanced by channeled flow, leading to locally stronger winds. There, gusts in the 40 to 60 mph range were briefly observed (Figure 10). While a significant amount of ice remained on the trees in the higher elevations east of the Greens and in southern Essex County NY where temperatures barely reached freezing, the winds were not strong enough and the ice was not thick enough to cause a significant increase in power outages. The peak was clearly in the morning from the freezing rain, though there was a minor secondary peak overnight.

Figure 10: Observed max wind gusts (in mph) on 12/29 and 12/30. [click to enlarge]
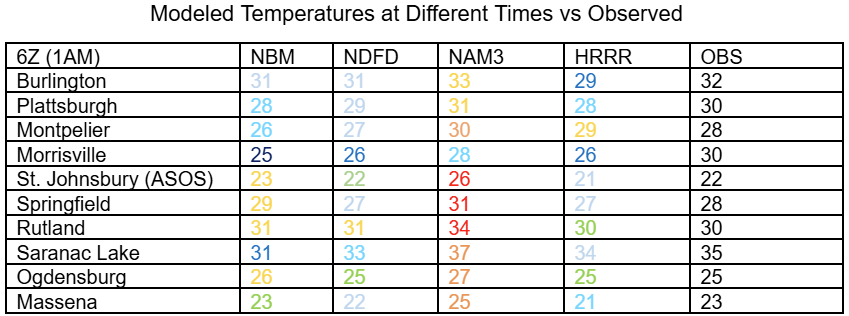
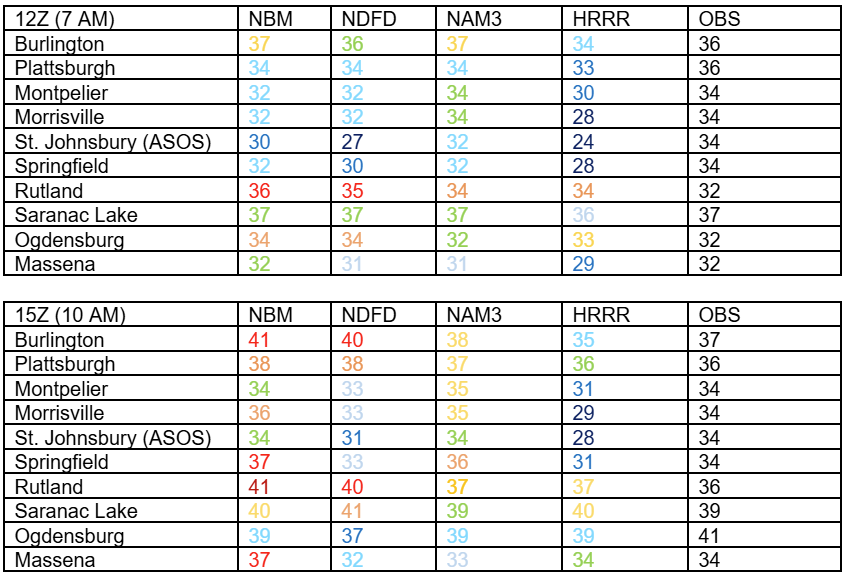
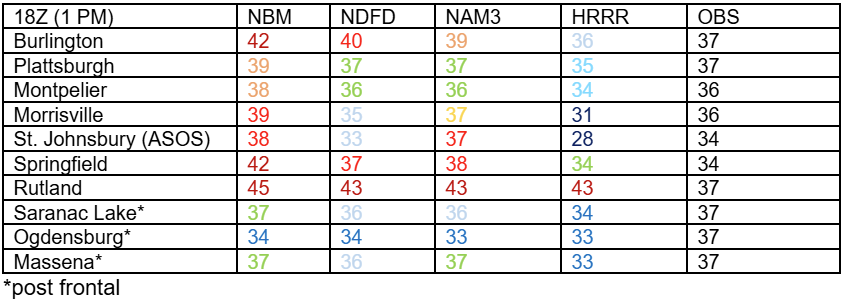
For the following comparisons, the deterministic data from 18Z 12/28 and the NBM from 13Z 12/28 were analyzed. This is compared to the National Weather Service (NDFD) forecast from the afternoon on 12/28 as these models were used by the forecasters.
Temperature Verification – For this analysis, The NBM had a bit of a warm bias, something that is common in freezing rain events. The warm bias became more pronounced as the event progressed. For many areas, the observed temperatures instead ended up very close to or slightly below the NAM3, a model that often captures the shallow surface cold air in freezing rain events. For example, at 15Z, the NAM3 temperature was two degrees or less off from the observed temperature at all the representative airports below. Temperatures were generally warmer than the HRRR, except for a couple of the coldest areas where it ended up being the best. The NBM 10th percentile did decent in the coldest locations, but was significantly too cold everywhere else. Interestingly, these biases generally held true in the colder areas east of the Greens like is typically common, but also in the warmer areas like the Champlain Valley. These colder temperatures were likely achieved due to the widespread precipitation limiting mixing, and the secondary low development cutting down on the advection and associated winds. The NBM warm bias became more notable as the event continued, and while later in the event temperatures had risen above freezing in most places, it was still problematic. Following the NBM, the ice would have melted the trees, while the much colder temperatures kept ice on the trees in many places east of the Greens and in southern Essex County NY. This presented a problem for anticipating the power outage threat as strong winds followed the frontal passage and led to a secondary maximum in outages, aided by the remaining ice in the trees. Also of note is that in the antecedent arctic airmass, the NBM was several degrees too warm for the preceding days with highs and lows, and that likely helped contribute to its warm bias, at least on the front end. However, during the first part of the precipitation, temperatures were close and even slightly underforecast in places.
QPF Verification - The NBM QPF ended up having a notable high bias for most places. The NDFD forecast for the afternoon of 12/28 mostly utilized the NBM for QPF, though with drier guidance blended in. While the NDFD ended up having a slightly better QPF forecast, it was not by a significant amount and the effects of dropping NBM temperatures was likely much more impactful on the ice forecast. The caveat here is that this precipitation is for the entire event, not just the QPF that accumulated as ice, and the model QPF as ice was closer to observed than the QPF amount for full event. However, the effects of the too high QPF are still important.

Ice & Ice-to-Liquid Ratio Verification – The NDFD forecast ice accumulation ratio between 0.6 and 0.7 verified quite well when comparing it to the observed ASOS ratios. In the end, the ice forecast ended up being slightly high but close (Figure 11). The NDFD had relatively good temperatures even if slightly underforecast, relatively good ice accumulation ratios, but too high QPF. Therefore, the majority of the forecast error likely came from overestimating the QPF, not from the temperatures or ice accumulation ratios. When comparing the observations to the High-Resolution Ensemble Forecast (HREF) and a strict Freezing Rain Accumulation Model (FRAM) forecast, the forecast ice accumulations were notably overdone, especially in the areas that saw the most ice (Figure 12), and were more overdone than the NDFD in many places.
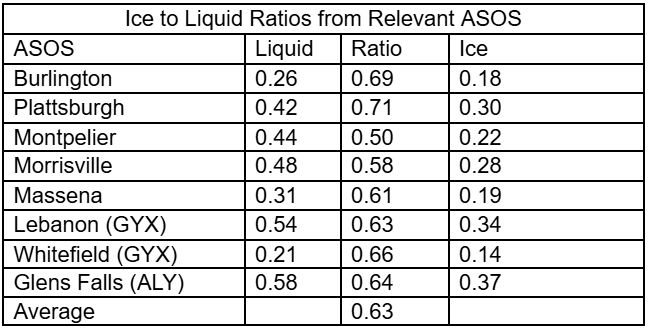

Figure 11: NDFD Freezing Rain Forecast from 2230Z on 12/28 vs Observed Ice Totals (in inches) for 12/28-12/29. [click to enlarge]
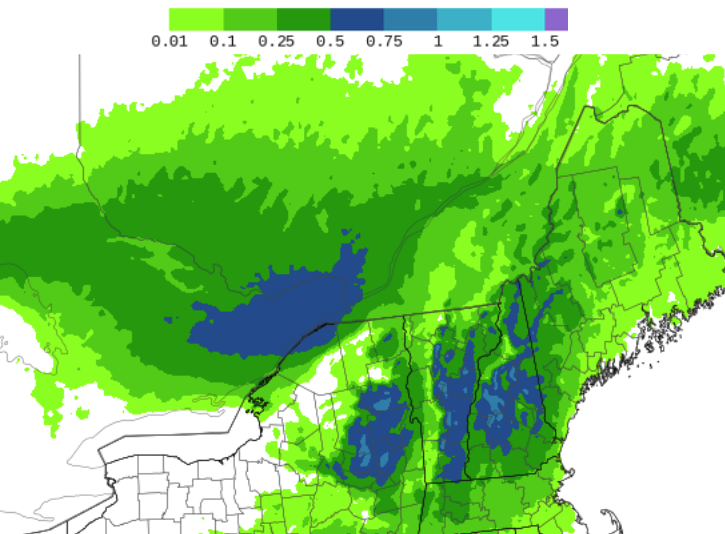
Figure 12: HREF ensemble mean FRAM Forecast ice accumulation (inches) initialized 12Z 12/28. [click to enlarge]
Wind Verification - Overall, the wind forecast verified pretty well. Forecast soundings showed 50-55 KT at the top of the mixed layer across the St. Lawrence Valley, with well mixed profiles in the afternoon of 12/29. As was expected, the St. Lawrence Valley ended up being the area with the highest gusts, but they also extended to the typical downslope areas of the northern Adirondacks near Ellenburg and Malone. Overall, the NBM 90th percentile unsurprisingly performed better than the NBM, except in some of the typically sheltered and less windy areas like Newcomb. However, it still struggled to capture the highest gusts in the St. Lawrence Valley, where the NDFD was better using different tools. This area of stronger winds exited the St. Lawrence Valley in the evening but another more widespread but less strong round of winds began behind the arctic front overnight. These are generally when the sites outside the St. Lawrence Valley and far northern Adirondacks saw their highest gusts.


Figure 13: Massena, NY (MSS) NAM forecast sounding valid at 20Z on 12/29 (18Z run 28 December) [click to enlarge]
Acknowledgements: Thanks to Pete Banacos and Robert Haynes for providing feedback and edits.

