
Dangerous and extreme heat will remain across portions of the southern U.S. through the weekend. A heat wave over the Southwest U.S. will intensify this week, peaking and expanding into the Intermountain West and northern High Plains this weekend. Multiple rounds of thunderstorms will produce heavy to excessive rainfall with significant flash flooding across portions of southern New England. Read More >
An exceptional winter storm impacted much of the United States from December 17 to 22, 2012, dropping over a foot of snow in many locations and bringing blizzard conditions from Colorado to Wisconsin. Iowa bore much of the storm's brunt on December 19 and 20, with locations along a line from Des Moines northeast through Dubuque receiving over a foot of snow. Strong winds of 50 to 60mph led to blizzard conditions that paralyzed the region for several days. Many local highways, as well as sections of Interstate 35, were closed due to the storm. Schools and businesses were closed for days after the storm due to impassable roads or power outages. Two people died in a 25 vehicle pileup on Interstate 35 during the height of the blizzard.
 |
 |
 |
|
Radar loop of the blizzard from the Des Moines WSR-88D Radar. Lightning strikes are overlaid in yellow. |
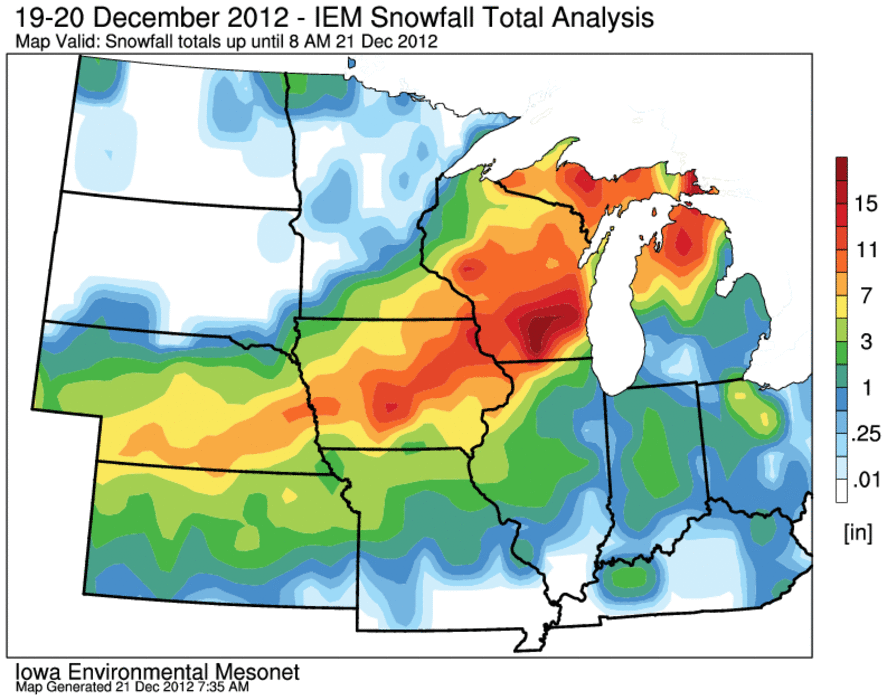
Snowfall totals across the central United States from the storm. Map courtesy of the IEM. |
Visible satellite imagery taken the day after the blizzard, showing the fresh snow cover across Iowa and neighboring states. |
 An upper level shortwave over the northeastern Pacific and attendant surface cyclone located south of the Gulf of Alaska on the morning of December 16 made landfall along the Pacific Northwest the following morning. The upper level trough dropped southeastward and amplified over the Rockies on the 18th, leading to lee cyclogenesis along the front range of the Rockies and the development of a surface low over eastern Colorado by early on the 19th. After dumping between 6 to 12 inches of snow in Colorado, the low pulled eastward across Kansas during the early afternoon. It then curved northeastward and deepened rapidly from 997mb at 18Z on the 19th to 982mb 24 hours later while over northern Illinois. The now occluded and weakening low lifted into southern Michigan late on the 20th and dissipated 24 hours later over southern Ontario. Meanwhile, a new triple point coastal low formed over North Carolina and raced up the eastern seaboard and brought snow to much of the Northeast. The system finally cleared the continental U.S. late on December 22nd.
Why did we get so much snow?
The heavy snow was the result of several different factors (or ingredients) that came together perfectly with this system. Three main ingredients were needed for the development of heavy snow: lift, moisture, and instability. The lift, which is necessary to condense air parcels and generate precipitation, was supplied both synoptically across Iowa by the deepening and negatively tilting upper level trough, and in the lower levels by strong frontogenesis over central Iowa. A diagnostic field called omega measures the upward vertical motion in the atmosphere that results from both synoptic or mesoscale sources. Different kinds of snowflakes form at different temperatures, with a region between -12C and -18C ideal for producing the classic dendrite that leads to the highest snowfall ratios and thus snow depths. Intense and heavy bands of this type of snow will be produced if the omega fields are maximized in this temperature region, which was the case with this blizzard.
The frontogenesis band was much narrower than the broad synoptic lift across much of Iowa. Thus, even though there was widespread snow across all of Iowa, the heaviest band fell where both of these sources of lift worked together. Moisture was present throughout the lower troposphere with the relative humidity with respect to ice at or over 100 percent. Finally, slant-wise instability was present in the lower atmosphere that helped accelerate any upward moving parcels. All of these ingredients combined to create this heavy snowfall event.
Why was there thunder snow?
Many central Iowans were surprised when they suddenly heard thunder or even saw flashes of lightning while heavy snow was falling. Is thunder snow a rare phenomena? While thunder snow is relatively uncommon in Iowa, it is often observed in many strong winter storms. Like winter storms, summertime thunderstorms require lift, moisture, and instability to form. However, a specific kind of instability, known as convective (or upright) instability, is necessary for the growth of convective towers that can generate lightning. Convective instability is easily measured using CAPE. High resolution models indicated that anywhere from 100 to 200 J/kg of CAPE existed across southern Iowa during the evening of Dec. 19. Even though this is a far cry from the 2000 to 3000 J/Kg of CAPE oftentimes observed in the summertime, even a small amount of convective instability in such a cold, ice crystal-filled environment would be enough to generate lightning.
Why were there so many snapped trees and power lines?
This event in some ways was an ice storm/blizzard hybrid. Temperatures at the onset of precipitation were at or slightly above freezing, meaning that rain was the initial precipitation type, which quickly changed over to a wet and slushy snow as near surface temperatures fell below freezing. This wet snow coated objects and then froze as temperatures continued to fall. The added weight of the snow on power lines and trees led to some breakage, but the real damage occurred as the winds rapidly increased in the overnight hours. Winds of 40 to 50 mph with gusts approaching 60 mph toyed with and eventually snapped snow laden branches and lines throughout the night and into the day on Thursday.
How does this storm compare to historical analog events?
Analog model guidance is a process by which model output fields (heights, moisture, winds, etc) are compared to historical events to see how well they match. By doing this, one can then view the impacts of these previous events and gauge the potential of the weather system in question. In the days before this storm struck, model analogs pegged that this event would be very similar to two recent, notorious Iowa blizzards: December 9, 2009 and January 26, 1996. Both of these storms dumped over a foot of snow in Des Moines and brought whiteout conditions to much of the state. The placement and intensity of the heaviest snow band in Iowa ended up being quite similar between Jan 26 and Dec 19 systems. An excellent blog that discusses the usage of analogs to forecast this event can be found here: CIPS Analog Guidance Page
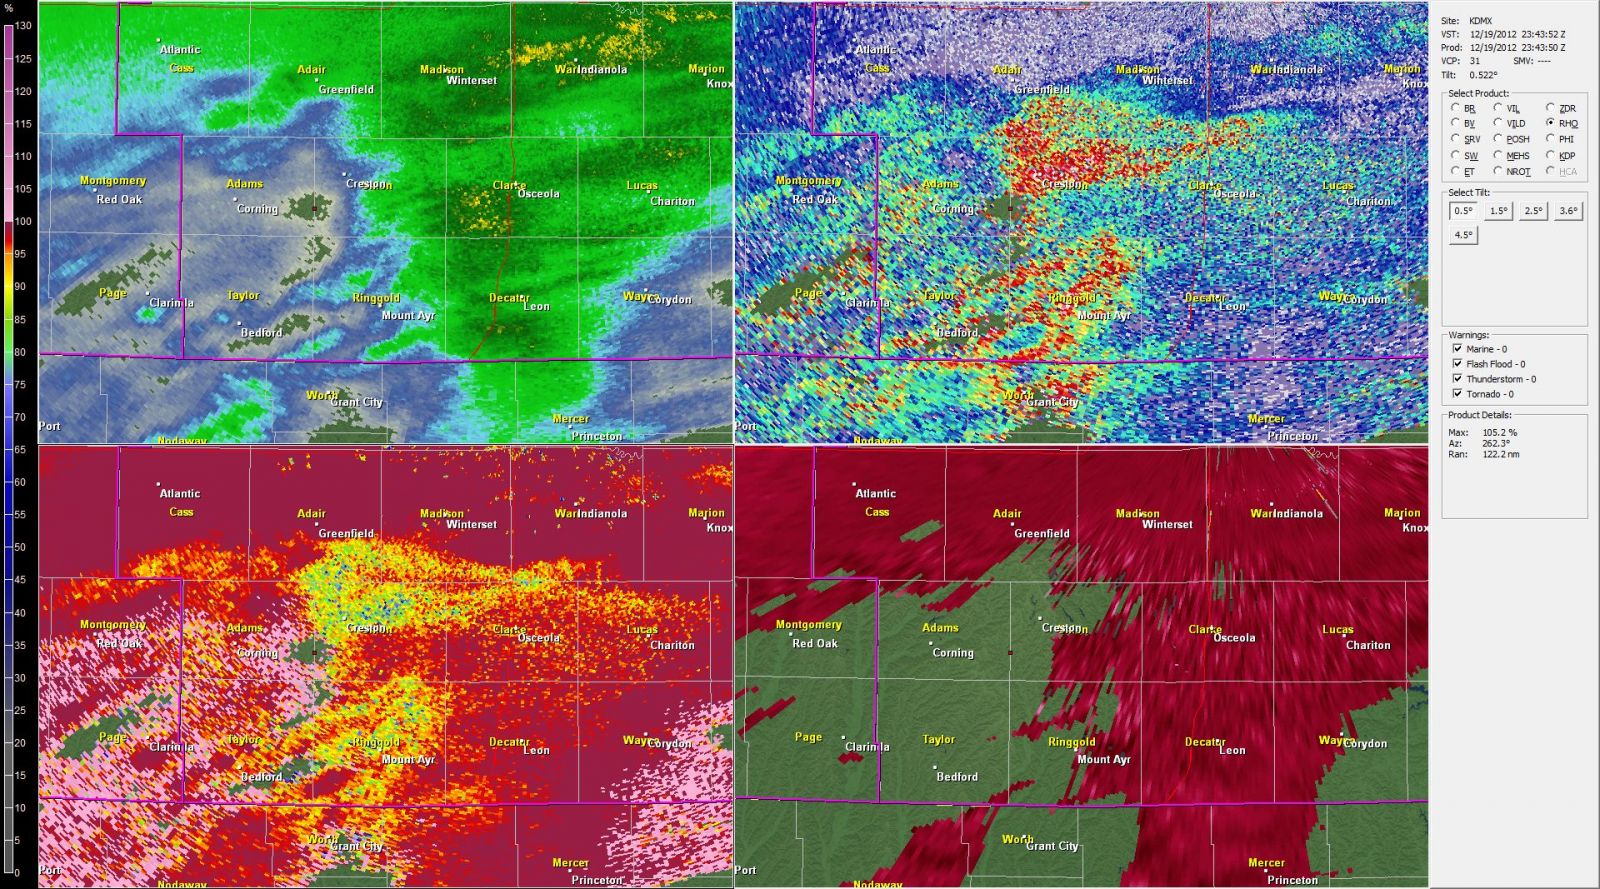
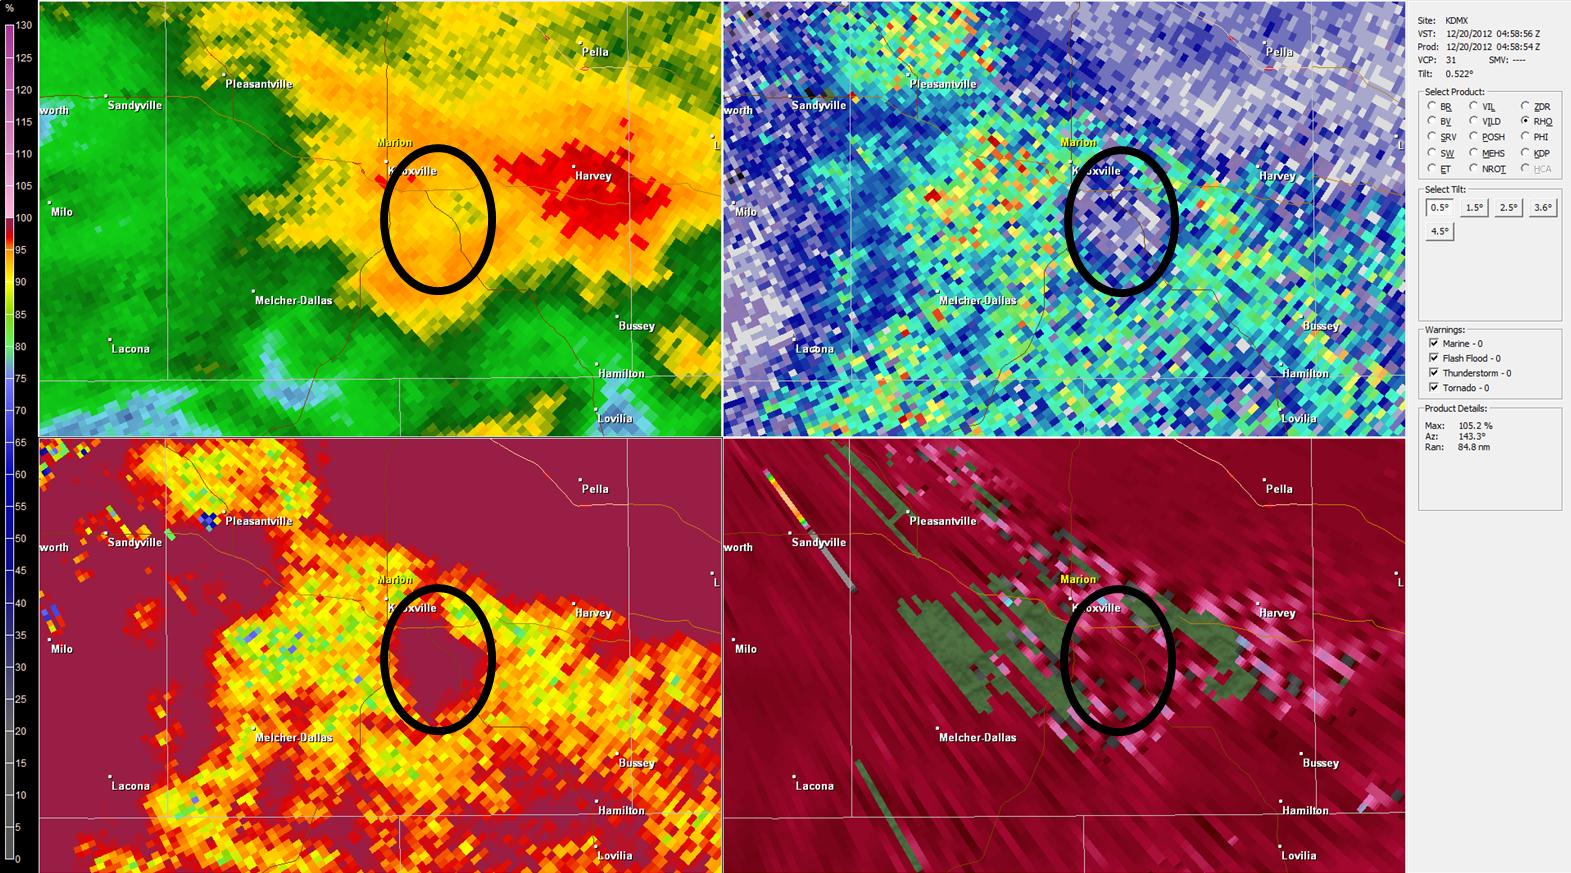
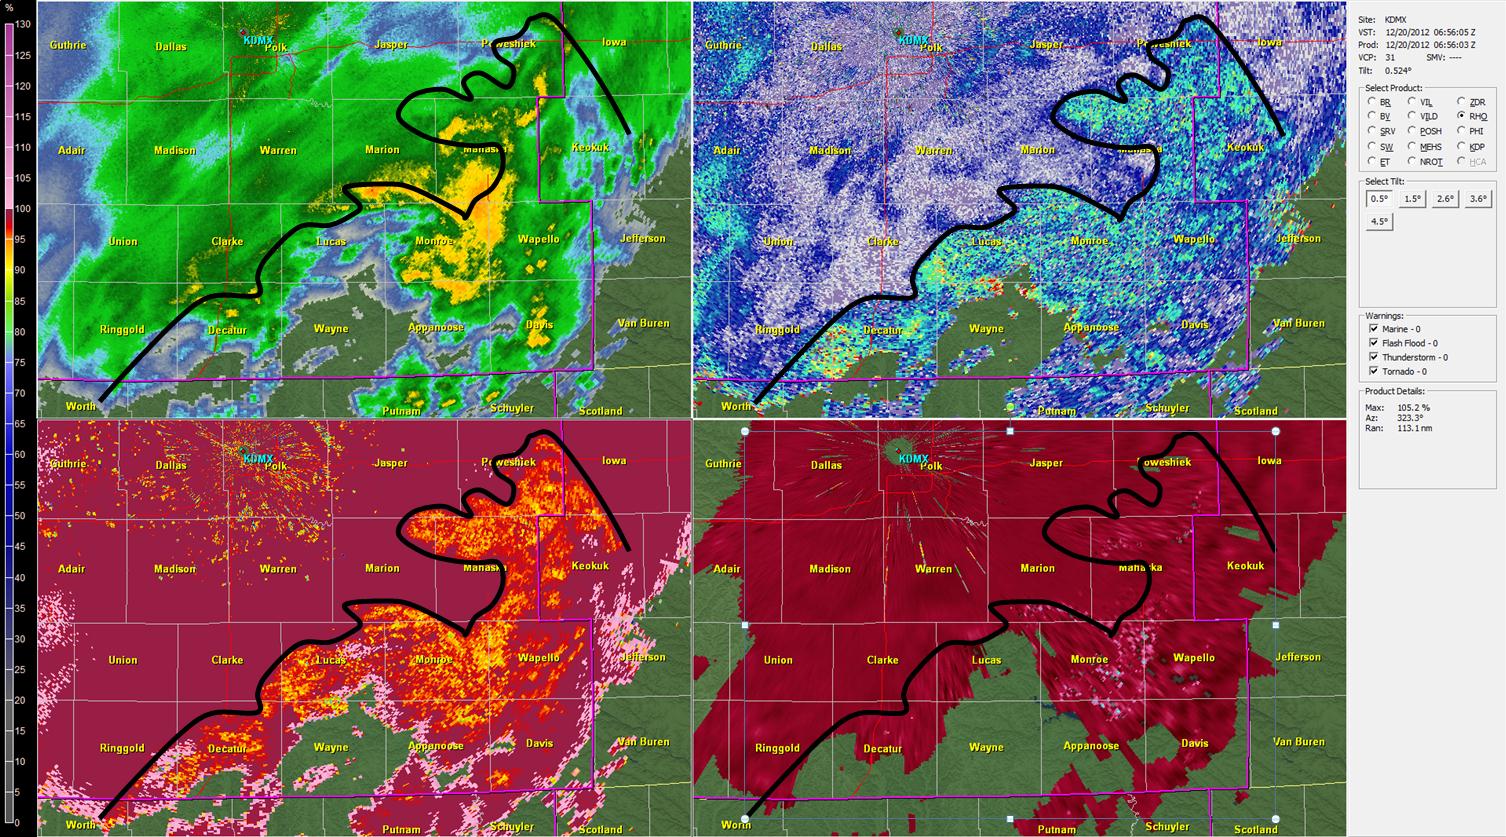
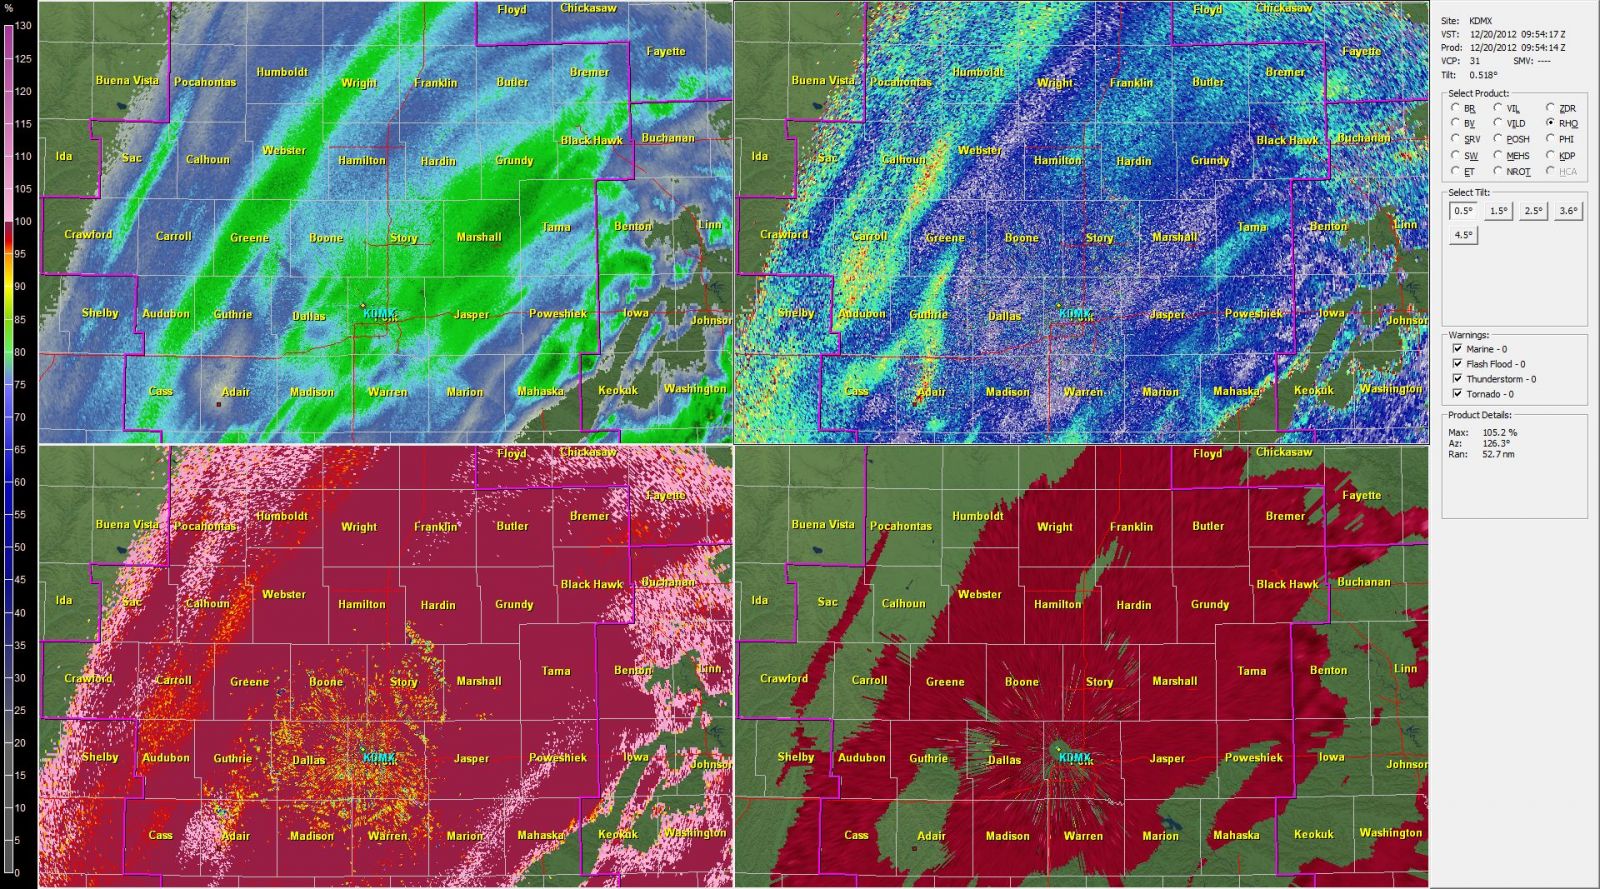
This blizzard was the first significant winter weather event to impact Iowa since the Des Moines WSR-88D was upgraded to dual-pol in September 2012. Unlike conventional radars, dual-pol radars are able to determine the shape and size variability of particles that it samples, thus it is able to distinguish between different types of precipitation (rain, snow, rain/snow mix, hail, etc.) and allows for better precipitation estimates. The dual-pol upgrade introduced three new products: differential reflectivity (ZDR), correlation coefficient (CC), and specific differential phase (KDP). ZDR determines whether the particles are round or oblate and whether they are oriented the horizontal or vertical. CC shows whether or not the particles in the sample volume are similar in shape and size, and KDP determines the water content of the precipitation.
Examples of the dual-pol signatures observed during the blizzard are shown below. Each screenshot consists of a four panel image, with conventional reflectivity in the upper left, ZDR in the upper right, CC in the lower left, and KDP in the lower right. Click on each image for more information on what the radar was sampling.
 |
 |
 |
 |
 |
 |
 |
 |
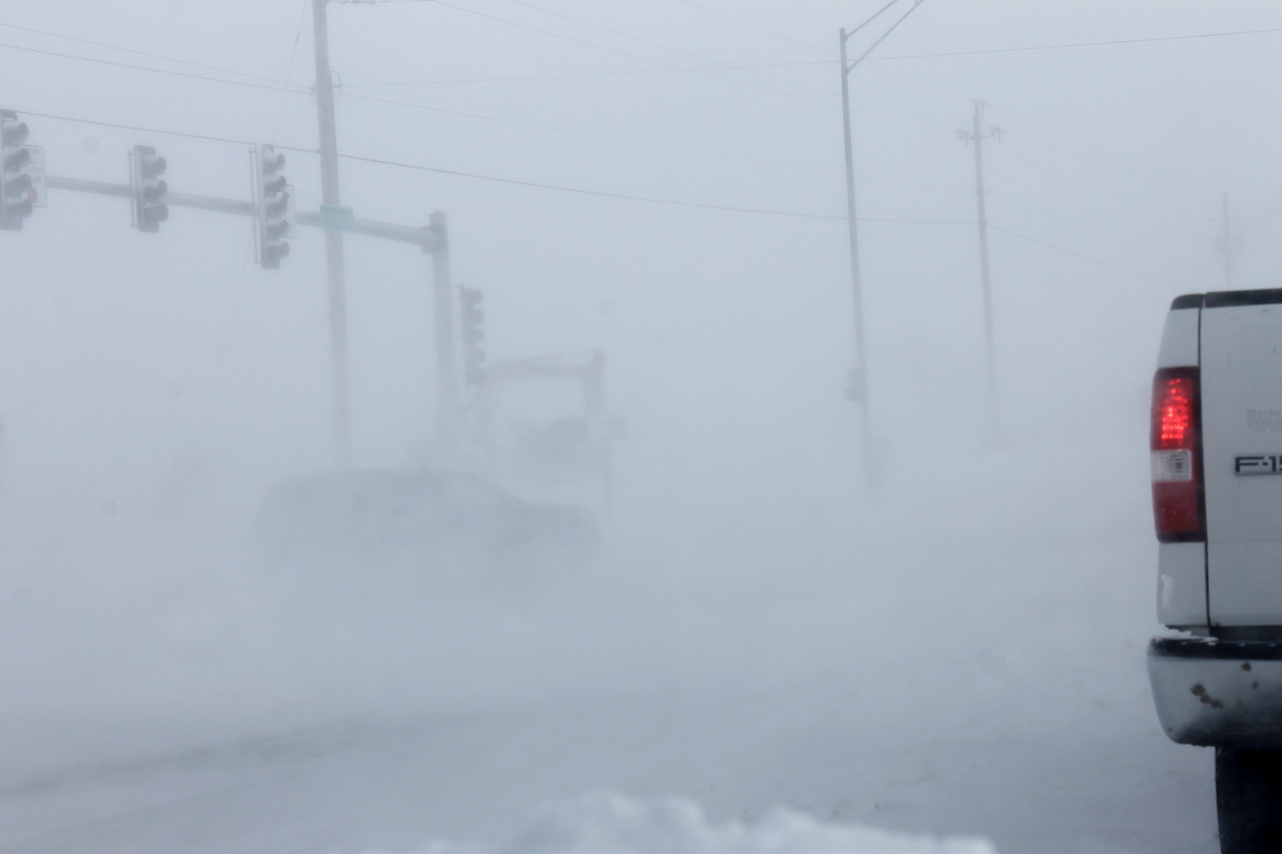
Below are some photos taken across central Iowa during and after the blizzard.
 |
 |
 |
 |
 |
 |
 |
 |
LOCATION AMOUNT (IN) ---------------------------------- ANKENY 14.5 JOHNSTON (NWS) 13.8 GRIMES 13.4 CONRAD 13.0 MARSHALLTOWN 13.0 DES MOINES AIRPORT 12.4 <- OFFICIAL DES MOINES SNOW TOTAL 6.4 MI S MADRID 11.5 GARWIN 11.0 3 MI N TOLEDO 11.0 5 MI ENE DES MOINES 11.0 BOONE 10.9 HARTFORD 10.3 WATERLOO AIRPORT 10.0 <- OFFICIAL WATERLOO SNOW TOTAL GRUNDY CENTER 10.0 CLUTIER 10.0 CEDAR FALLS 10.0 2 MI NNE AMES 9.8 2 MI SSE WATERLOO 9.5 3 MI NNW WATERLOO 9.5 INDIANOLA 9.2 GILBERT 9.2 5 MI SE AMES 9.0 JEFFERSON 9.0 TRIPOLI 9.0 WINTERSET 9.0 NEWTON 8.3 1 MI ENE AMES 8.3 AUDUBON 8.0 DENISON 8.0 PARKERSBURG 8.0 ATLANTIC 7.0 ROCKWELL CITY 7.0 MANNING 7.0 BADGER 6.7 5 MI NNW FORT DODGE 6.5 HARCOURT 6.5 JEWELL 6.5 LATIMER 6.5 MASON CITY 6.3 <- OFFICIAL MASON CITY SNOW TOTAL |
LOCATION AMOUNT (IN) ---------------------------------- ALGONA 6.0 ALLISON 6.0 CARROLL 6.0 KESLEY 6.0 LAMONI 6.0 RINGSTEAD 6.0 LAKE MILLS 5.8 MASON CITY #2 5.5 MONTEZUMA 5.5 POCAHONTAS 5.0 2 MI ENE FORT DODGE 5.0 3 MI WSW OSCEOLA 5.0 NORTHWOOD 4.6 1 MI NW WEBSTER CITY 4.5 BEACONSFIELD 4.0 BRITT 4.0 HAMPTON 4.0 IOWA FALLS 4.0 OSKALOOSA 4.0 WEBSTER CITY 4.0 OSCEOLA 3.7 EMMETSBURG 3.0 KNOXVILLE 3.0 MOUNT AYR 3.0 CENTERVILLE 3.0 BLOOMFIELD 2.6 SWEA CITY 2.6 ALBIA 2.0 BEDFORD 2.0 CORNING 2.0 OTTUMWA 2.0 RATHBUN DAM 2.0 ALLERTON 1.9 PELLA 1.8 NEW MARKET 1.5 |
In the days leading up to and during this blizzard, the NWS in Des Moines issued a wide range of products to keep the public informed on the storm. Beginning the weekend before the event, meteorologists conveyed the increasing threat for a major winter storm by mid to late week through the Hazardous Weather Outlook (HWO) product:
Saturday, December 15 Hazardous Weather Outlook
"A STORM SYSTEM WILL BE APPROACHING THE REGION WEDNESDAY THROUGH THURSDAY. THOUGH THERE IS STILL UNCERTAINTY...A MIXTURE OF RAIN AND SNOW AND THEN POSSIBLY ACCUMULATING SNOW MAY OCCUR WITH THIS SYSTEM AS IT TRACKS ACROSS THE AREA."
Sunday, December 16 Hazardous Weather Outlook
"A STORM SYSTEM WILL BE REACH THE REGION LATE WEDNESDAY THROUGH THURSDAY. THOUGH THERE IS STILL SOME UNCERTAINTY IN THE EVENTUAL TRACK OF THE SYSTEM...IT IS LOOKING MORE LIKELY THAT ACCUMULATING SNOW WILL OCCUR IN THE OUTLOOK AREA WEDNESDAY NIGHT AND EARLY THURSDAY. WINDS MAY ALSO BE A FACTOR WITH THIS STORM RESULTING IN ADDITIONAL IMPACTS LATE WEDNESDAY NIGHT AND THURSDAY MORNING. PERSONS IN THE OUTLOOK AREA ARE ENCOURAGED TO MONITOR THE LATEST INFORMATION REGARDING THIS POTENTIAL STORM."
By Monday afternoon (Dec 17), confidence was high enough on the threat of a winter storm that a Winter Storm Watch was issued for much of central and southern Iowa:
THE NATIONAL WEATHER SERVICE IN DES MOINES HAS ISSUED A WINTER STORM WATCH...WHICH IS IN EFFECT FROM WEDNESDAY AFTERNOON THROUGH THURSDAY AFTERNOON.
...FIRST MAJOR WINTER STORM TO AFFECT CENTRAL IOWA MIDWEEK...
TIMING...PRECIPITATION WILL OVERSPREAD CENTRAL IOWA ON WEDNESDAY AFTERNOON. SNOW IS EXPECTED ALONG AND NORTH OF AN ATLANTIC THROUGH BOONE TO WATERLOO LINE. RAIN IS EXPECTED IN SOUTHERN IOWA SOUTH OF A BEDFORD TO OSKALOOSA LINE. IN BETWEEN...A RAIN AND SNOW MIX IS EXPECTED. THIS PRECIPITATION WILL CHANGE TO ALL SNOW ON WEDNESDAY NIGHT BEFORE ENDING ON THURSDAY MORNING.
STORM TOTAL SNOW ACCUMULATION...5 TO 8 INCHES OF SNOW IS EXPECTED IN THE WATCH AREA. LOCAL AMOUNTS OF UP TO 10 INCHES WILL BE POSSIBLE.
WINDS/VISIBILITY...WINDS WILL BECOME VERY STRONG ON WEDNESDAY NIGHT FROM THE NORTH TO NORTHWEST. SUSTAINED WINDS OF 20 TO 30 MPH ARE EXPECTED WITH GUSTS OVER 35 MPH POSSIBLE. THE STRONGEST WINDS ARE EXPECTED AROUND DAYBREAK ON THURSDAY WITH NEAR BLIZZARD CONDITIONS POSSIBLE WITH VISIBILITIES REDUCED BELOW ONE QUARTER OF A MILE FROM TIME TO TIME.
The following afternoon (Tue, Dec 18), the watch was upgraded to a Winter Storm Warning:
THE NATIONAL WEATHER SERVICE IN DES MOINES HAS ISSUED A WINTER STORM WARNING FOR HEAVY SNOW AND BLOWING SNOW...WHICH IS IN EFFECT FROM 6 PM WEDNESDAY TO 6 PM CST THURSDAY.
...DANGEROUS WINTER STORM TO AFFECT CENTRAL IOWA LATE WEDNESDAY INTO THURSDAY...
TIMING...SNOW WILL OVERSPREAD THE AREA LATE WEDNESDAY AFTERNOON INTO THE EVENING. THE SNOW MAY INITIALLY BEGIN AS A MIXTURE OF RAIN AND SNOW BUT WILL TRANSITION TO ALL SNOW QUICKLY. THE SNOW WILL PERSIST WEDNESDAY NIGHT...HEAVY AT TIMES...WITH THE SNOW TAPERING OF ON THURSDAY MORNING.
STORM TOTAL SNOW ACCUMULATION...STORM TOTAL SNOWFALL OF 7 TO 11 INCHES IS POSSIBLE WITH LOCALLY HEAVIER AMOUNTS. SNOW DRIFTS SEVERAL FEET HIGH WILL BE POSSIBLE DUE TO THE VERY STRONG WINDS.
WINDS/VISIBILITY...WINDS WILL BECOME VERY STRONG WEDNESDAY NIGHT FROM THE NORTH NORTHWEST. SUSTAINED WINDS OF 25 TO 30 MPH ARE EXPECTED WITH GUSTS OVER 45 MPH POSSIBLE. THE STRONGEST WINDS ARE EXPECTED A FEW HOURS PRIOR TO DAYBREAK THROUGH NOON THURSDAY. NEAR BLIZZARD CONDITIONS MAY OCCUR WITH VISIBILITIES REDUCED BELOW ONE QUARTER OF A MILE FROM TIME TO TIME.
IMPACTS...VERY DANGEROUS CONDITIONS ARE EXPECTED TO DEVELOP ON WEDNESDAY NIGHT INTO THURSDAY MORNING. BE PREPARED FOR VERY DIFFICULT TRAVEL AND NEAR BLIZZARD CONDITIONS. THIS WARNING MAY NEED TO BE UPGRADED TO A BLIZZARD WARNING SHOULD FORECAST CONDITIONS WARRANT.
By Wednesday morning, forecast confidence was very high that a major blizzard was going to occur and the Winter Storm Warning was upgraded to a Blizzard Warning:
...LIFE-THREATENING BLIZZARD CONDITIONS TO DEVELOP OVER MUCH OF THE CENTRAL IOWA TONIGHT AND CONTINUE THROUGH THURSDAY AFTERNOON...
6 TO 12 INCHES OF SNOW IS EXPECTED BY THURSDAY MORNING. THE HEAVIEST SNOW AXIS WILL BE ALONG A LINE FROM NEAR DES MOINES TO WATERLOO. WINDS WILL BECOME VERY STRONG TONIGHT FROM THE NORTH NORTHWEST THIS EVENING AND CONTINUING THROUGH NOON THURSDAY. SUSTAINED WINDS OF 25 TO 35 MPH ARE EXPECTED WITH GUSTS OVER 45 MPH POSSIBLE. BLIZZARD CONDITIONS WITH WIDESPREAD BLOWING AND DRIFTING SNOW WILL LEAD TO VISIBILITIES NEAR ZERO WITH WHITEOUT CONDITIONS. TRAVEL WILL BECOME DIFFICULT...IF NOT IMPOSSIBLE DUE TO BLOWING AND DRIFTING SNOW.
In the hours before and during the course of the storm, meteorologists fine tuned the warnings to reflect the storm's expected track and intensity.

