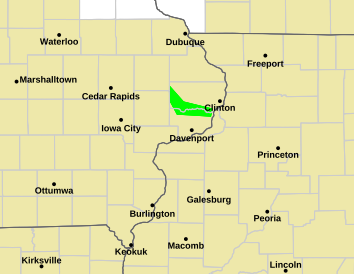
| National Watches & Warnings | Local Watches & Warnings | Weather Story | SPC Current Activity Chart |
 |
 |
 |
 |
| Display Watch & Warning Map Key: | Situational Awareness Monitoring Links NWS GIS Viewer NWS Radar |
||
Radar
| Quad Cities | National Radar | |||||||||||||||||||||||
 |
 |
|||||||||||||||||||||||
|
||||||||||||||||||||||||
Current Observations
| Table of Regional Temperature & Precipitation Amounts | |||
| State Regional Weather Roundups: IA | IL | MO | WI | |||
| Currrent Conditions Interactive Map: NWS Weather & Hazards Data Viewer | |||
| For observations over the past 3 and past 30 days, see our Observations Page. | |||
Weather Maps
| National Surface Analysis | Today's Storm Reports |
 |
 |
| Satellite | Regional Surface Analysis |
 |
 |
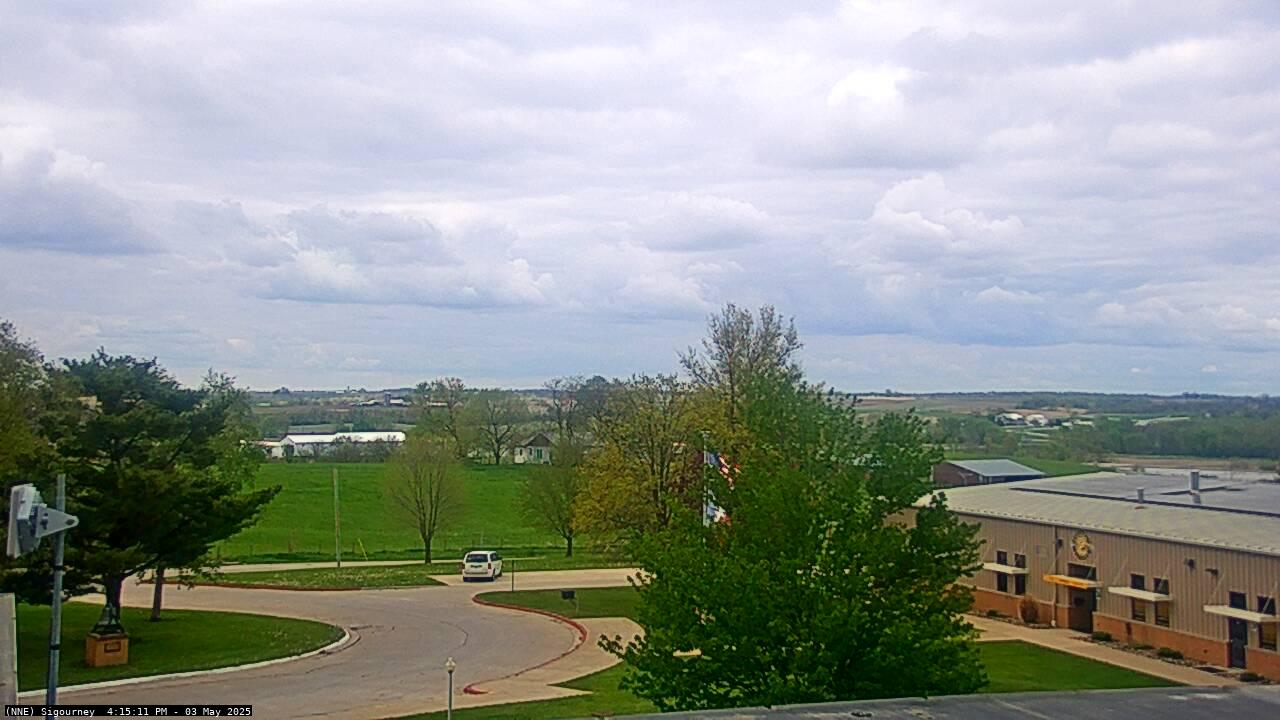
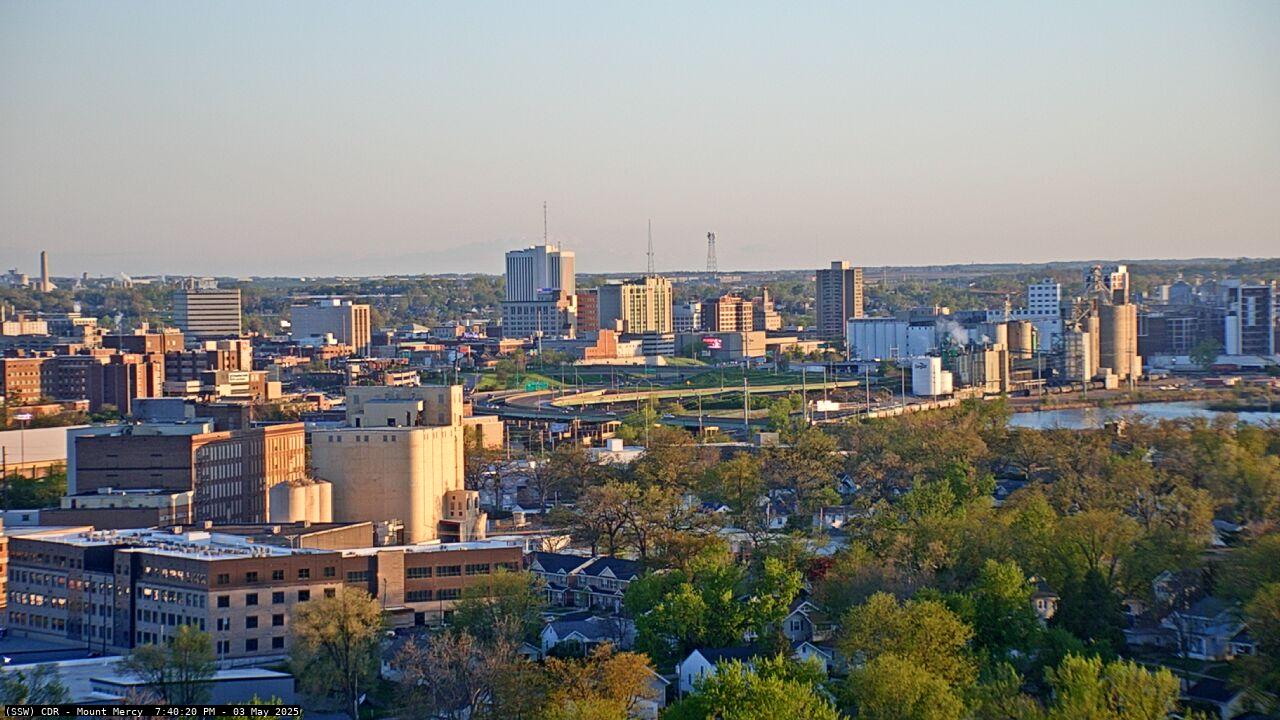
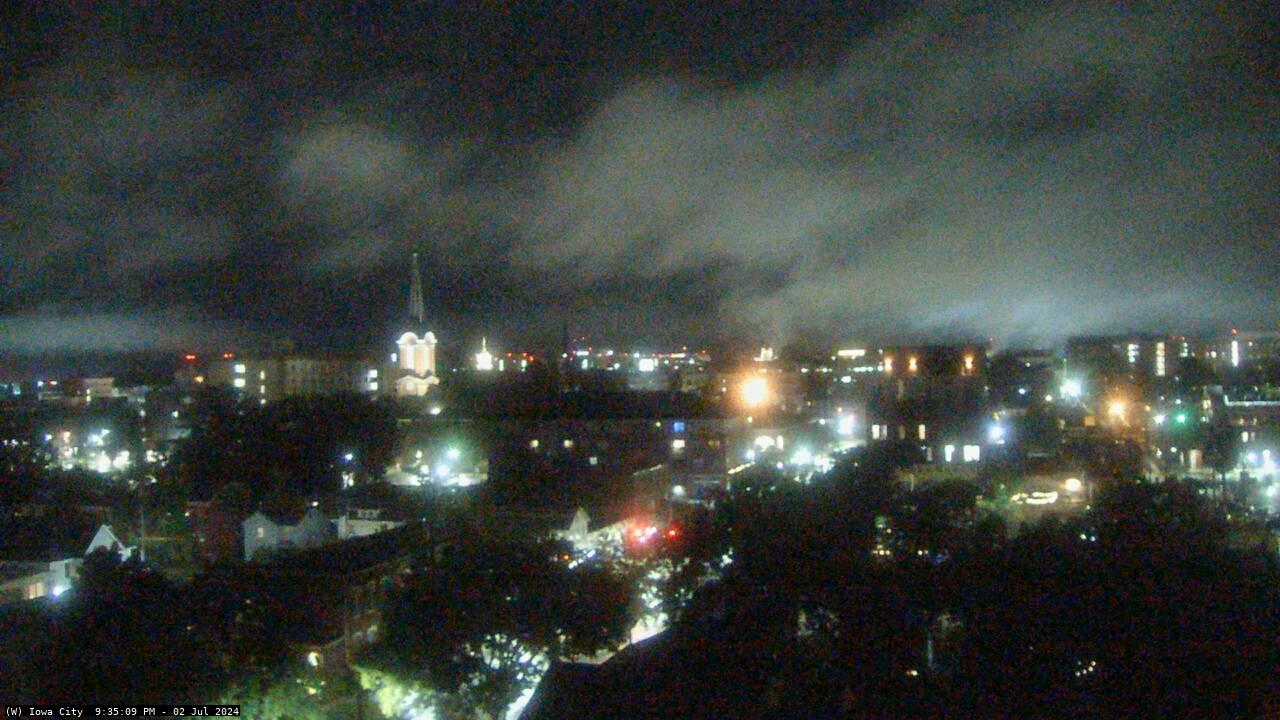
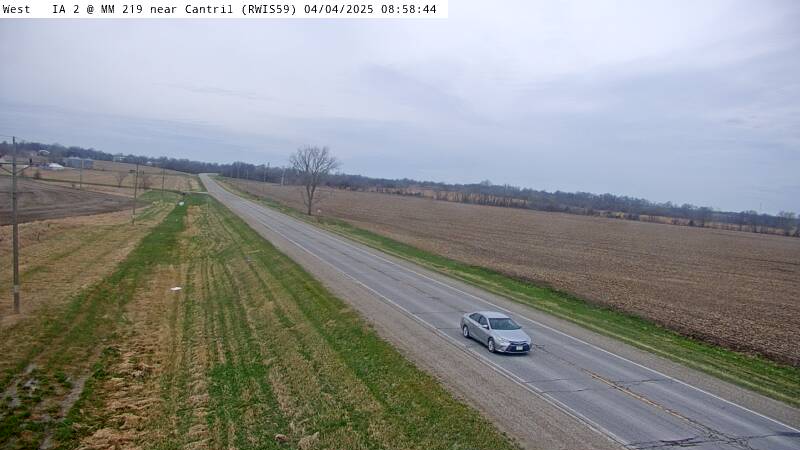
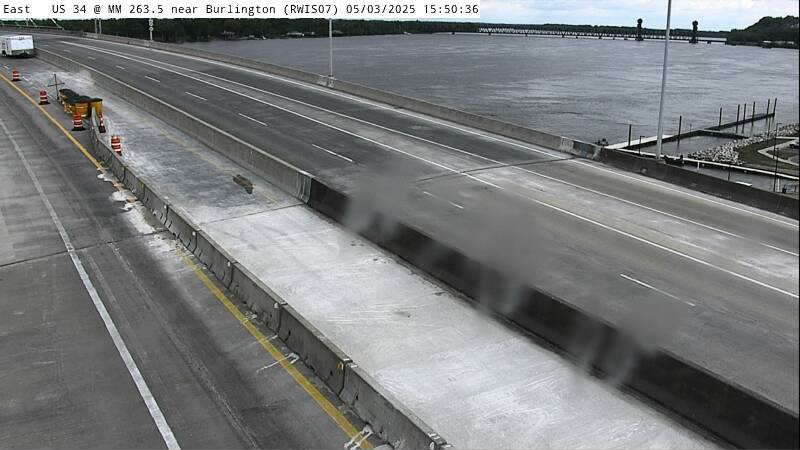
Web Cams
|
|||||||||
|
|||||||||
|
|||||||||
| Note: The National Weather Service is not responsible for the content, timeliness or reliability of the webcam images. The images are provided as an aid to evaluate current conditions at various locations across the local area. |
|||||||||
Additional Resources
| - Most recent storm reports | |||
| - CoCoRaHS Precipitation Reports | |||
Overview
| Today's Forecast | Tomorrow | |||||
 |
|
|||||
Hazardous Weather Outlook
Technical Forecast Discussion
Medium-Range Outlooks
| Day 3 to 7 National Hazards Outlook |
Day 8 to 14 National Hazards Outlook |
 |
 |
| Day 8 to 14 Temperature Outlook |
Day 8 to 14 Precipitation Outlook |
 |
 |
Additional Resources
| - Activity Planner | |||
| - Forecast Points - Experimental Page | |||
| - Long-Range Temperature and Precipitation Outlooks | |||
| Short-Term Severe Weather |
| Mesoscale Discussions | Current Severe Weather Watches |
 |
 |
 |
Local Hazardous Weather Outlook
Storm Prediction Center's Outlooks for Today
| Categorical Outlook | Tornado Probability | Hail Probability | Wind Probability |
 |
 |
 |
 |
| SPC Day 2 Outlook | SPC Day 3 Outlook | |||
| Categorical Outlook | Probabilistic Outlook | Categorical Outlook | Probabilistic Outlook | |
 |
 |
 |
 |
|
Recent Storm Reports
| Most Recent Local Storm Reports (text) | |
| Today's Reports | Yesterday's Reports |
|
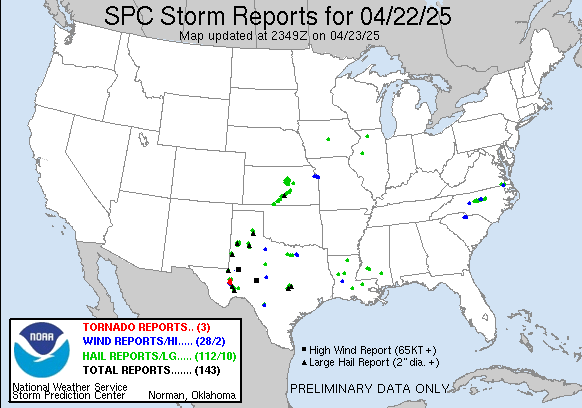 |
| Note: All storm reports are preliminary and are not considered official until certified in Storm Data. | |
Additional Resources
| Data and Analysis | Preparedness and Safety | ||
| - Severe Weather Watches and Warnings (Text) | - Severe Weather Preparedness | ||
| - SPC Mesoanalysis | - StormReady | ||
| - Lightning Safety | |||
|
|||||||||||||||||||||||||||||||||||||||||||||||||||||||||||||||||||||||||||||||||||||||||||||||||||||||||||||||||||||||||||||||||||||||||||||||||||||||||||||||||||||||||||||||||||||||||||||||||||||||||||||||||||||||||||||||||||||||||||||||||||||||||||||||||||||||||||||||||||||||||||||||||||||||||||||||||||||||||||||||||||||||||||||||||||||||||||||||||||||||||||||||||||||||||||||||||||||||||||||||||||||||||||
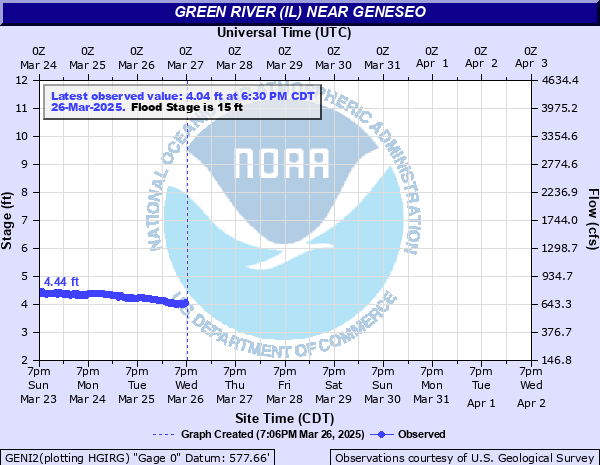
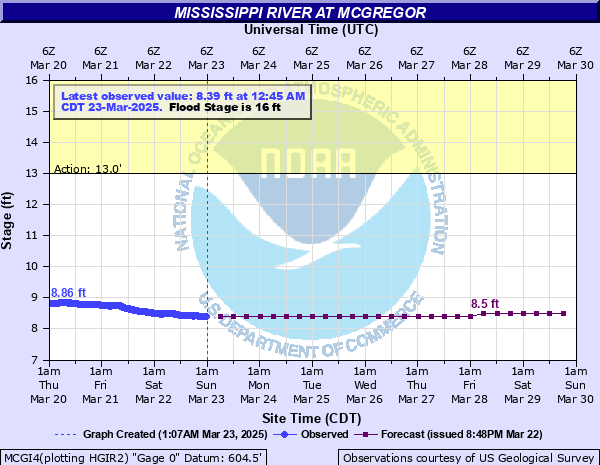
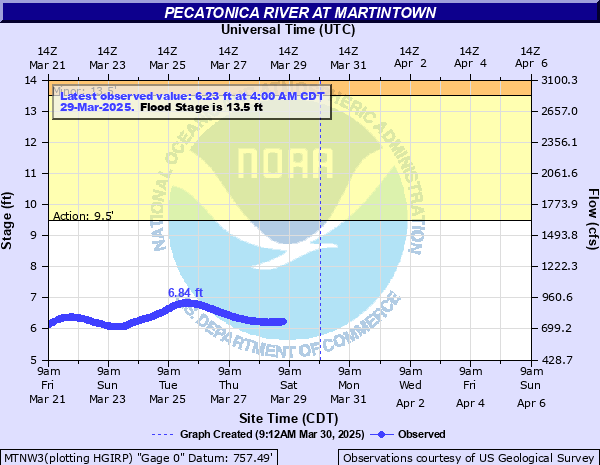
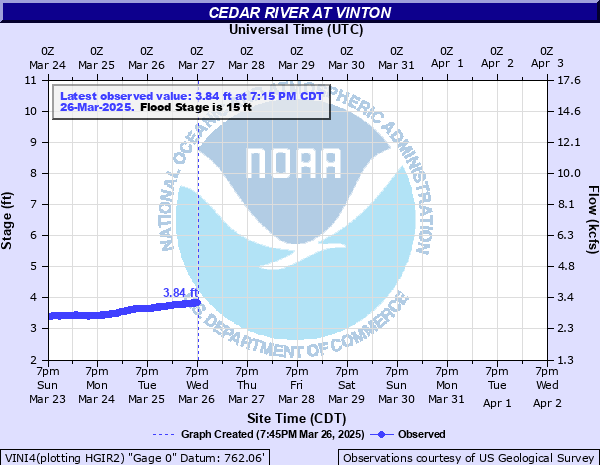
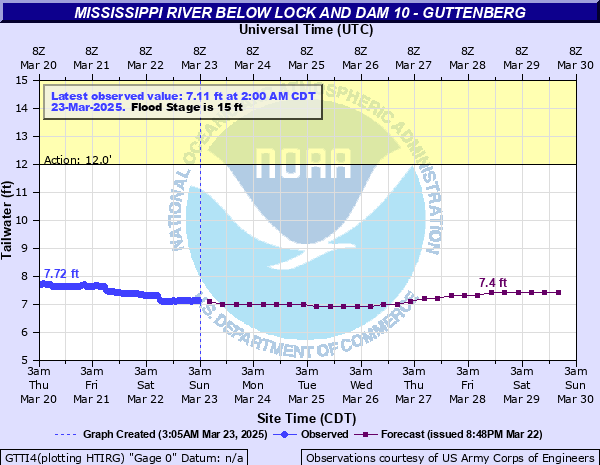
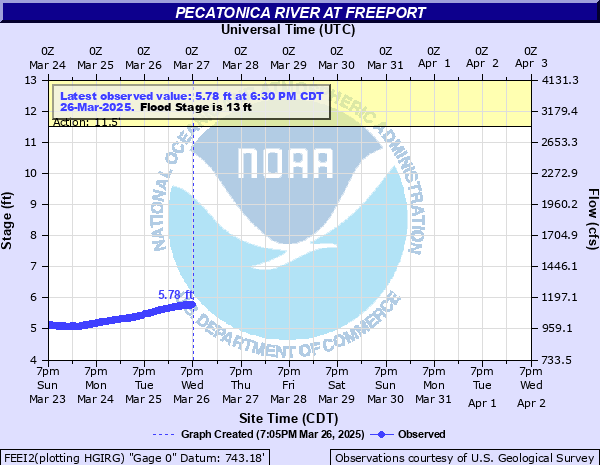
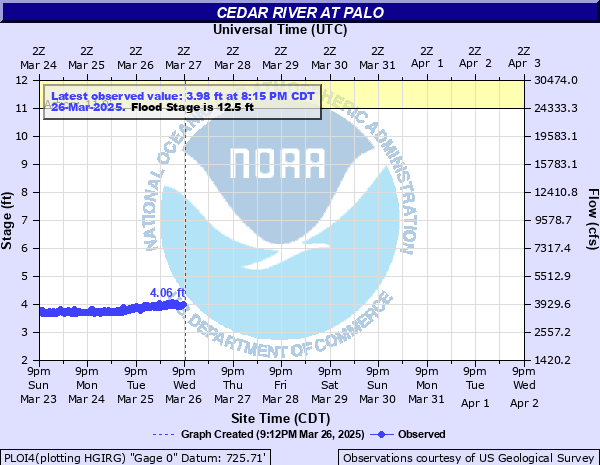
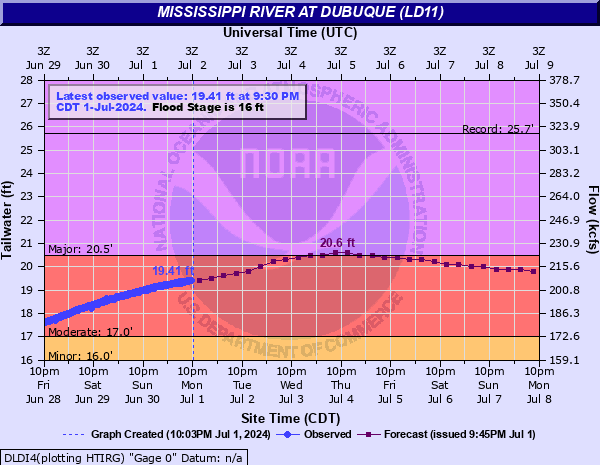
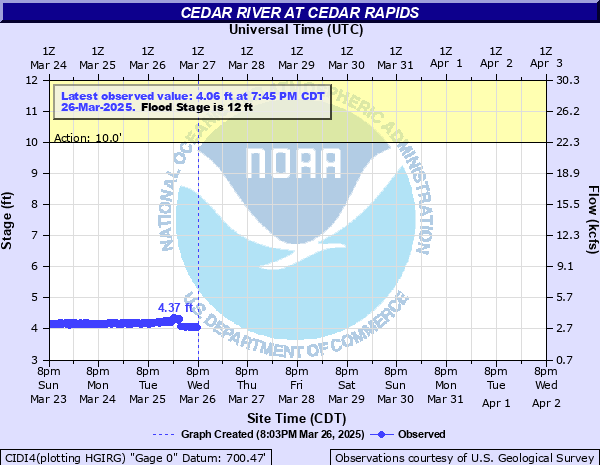
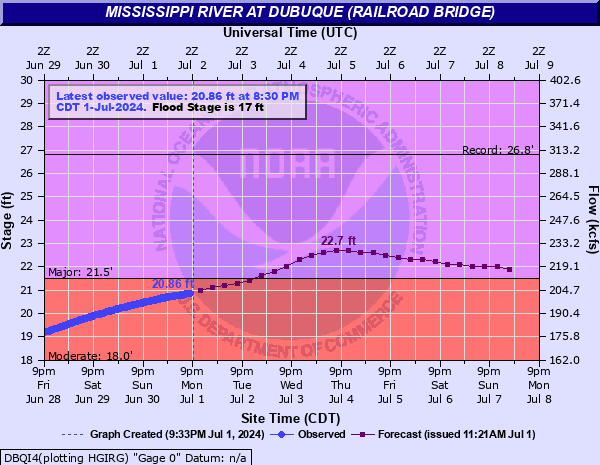
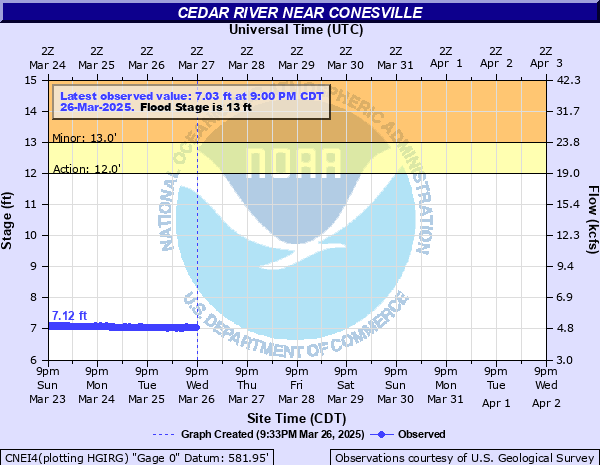
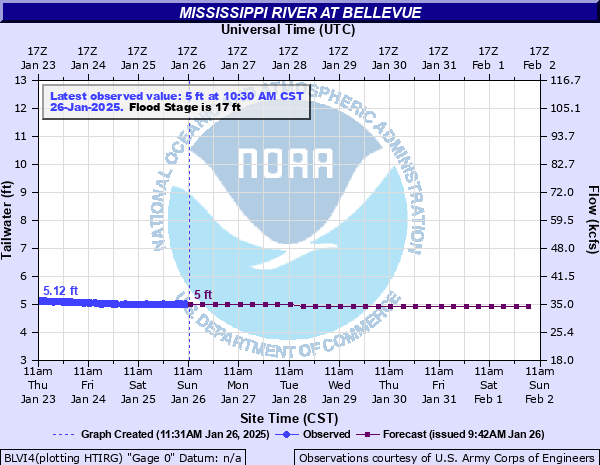
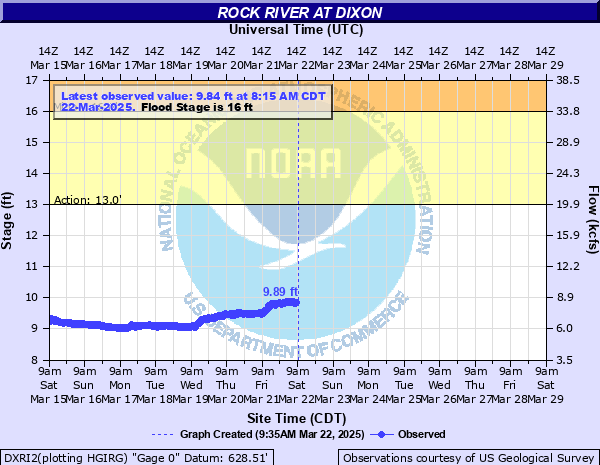
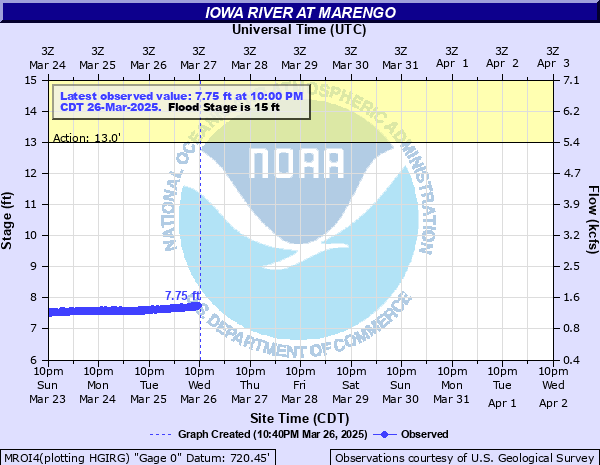
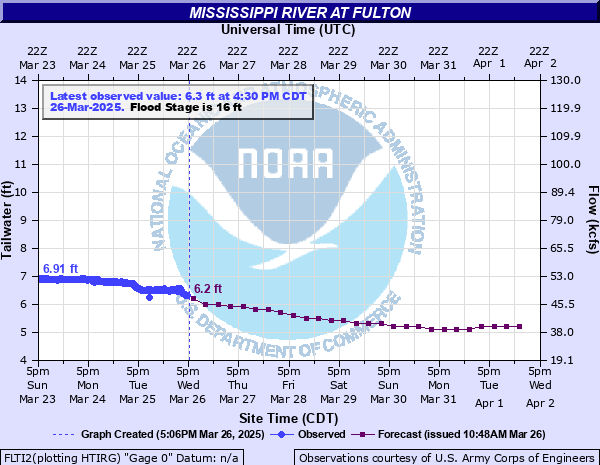
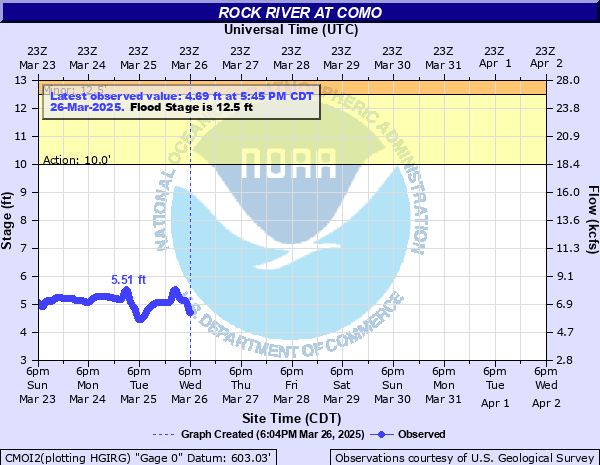
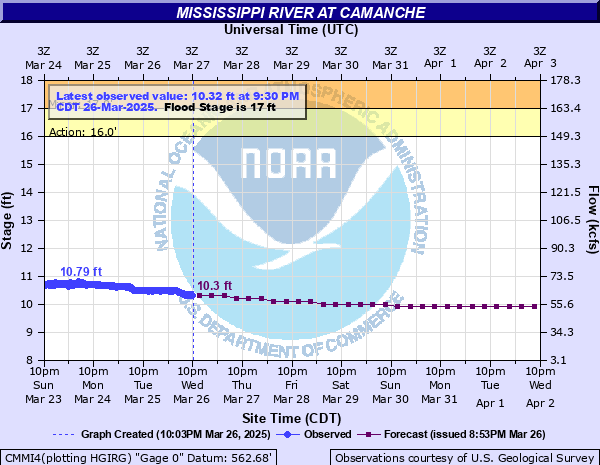
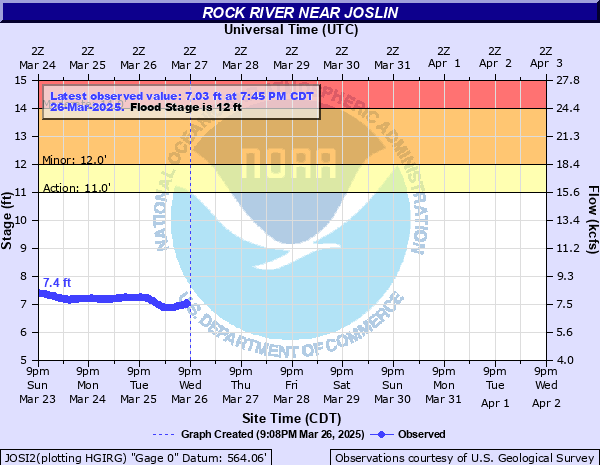
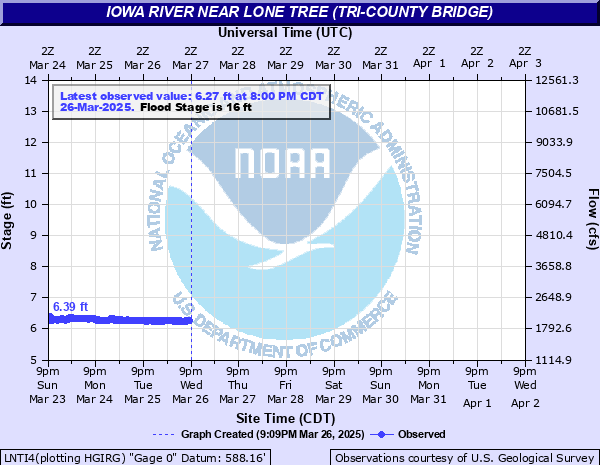
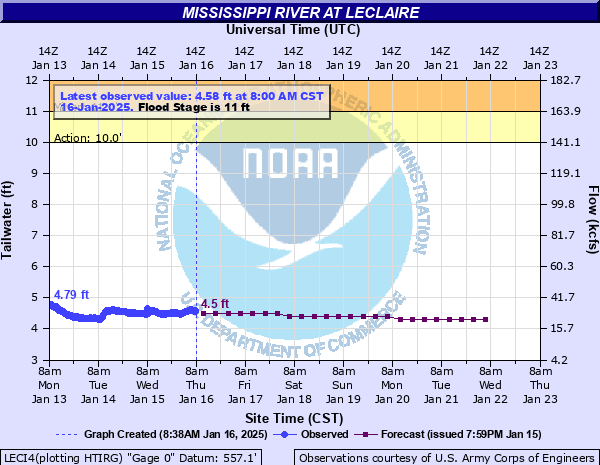
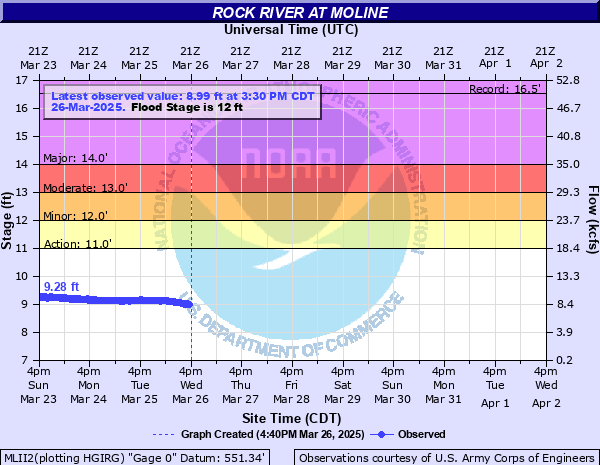
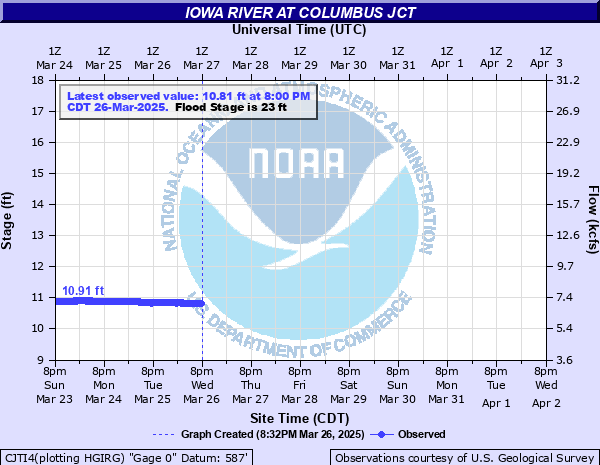
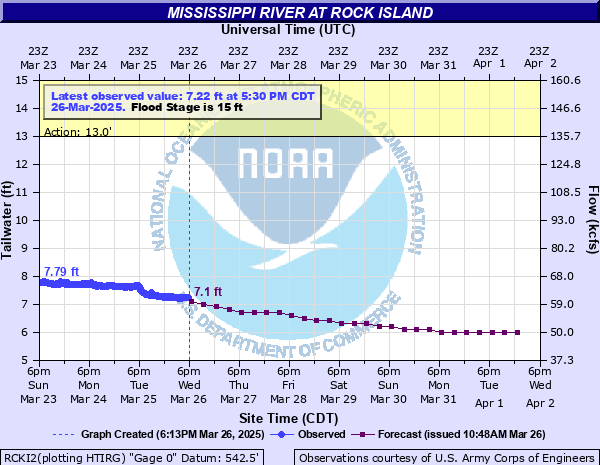
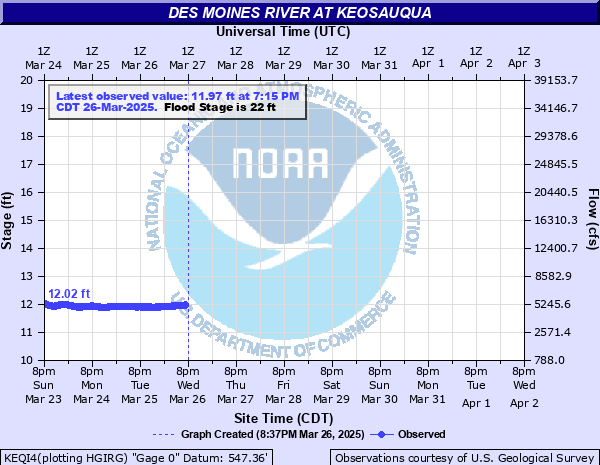
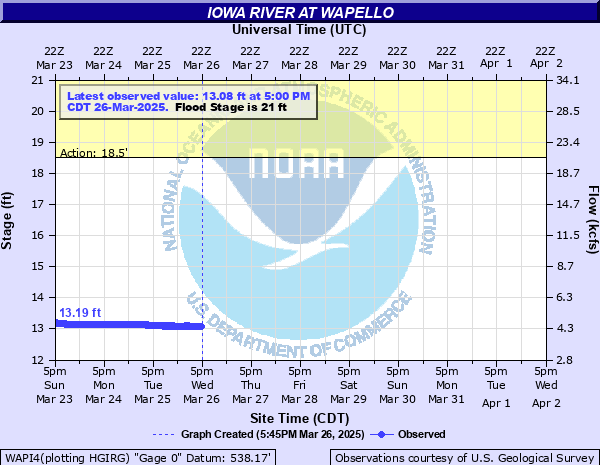
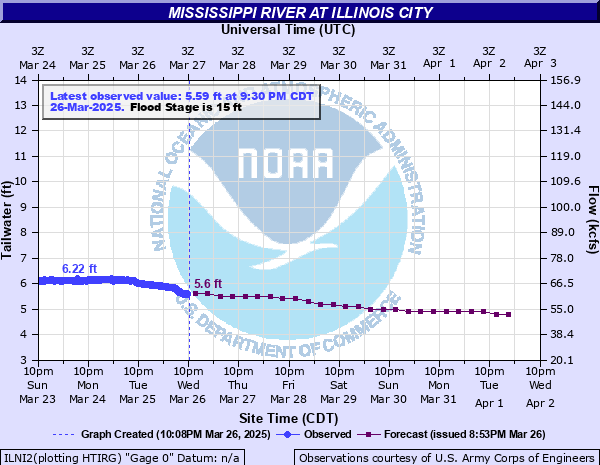
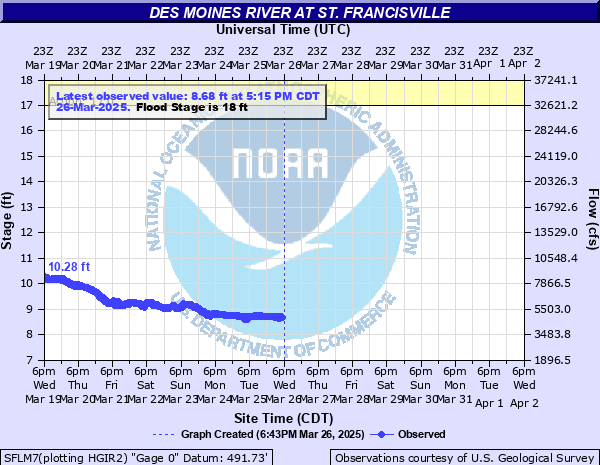
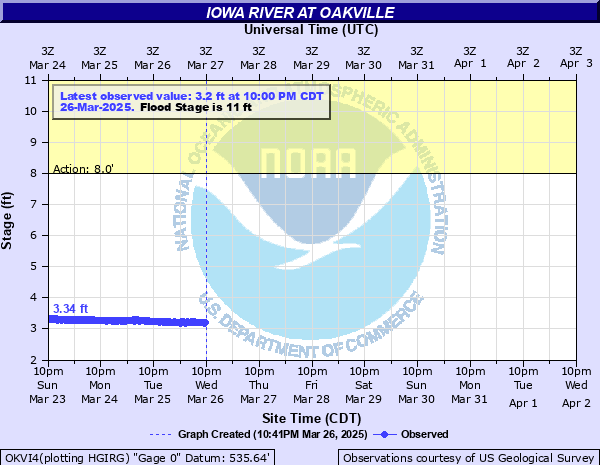
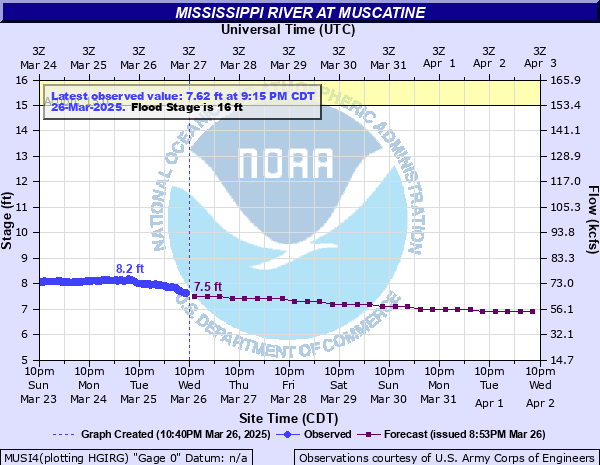
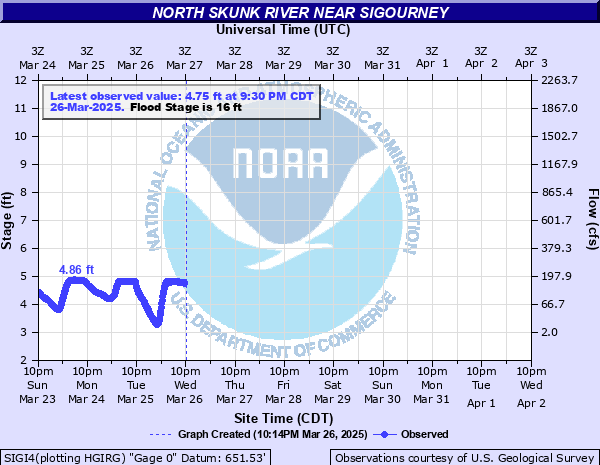
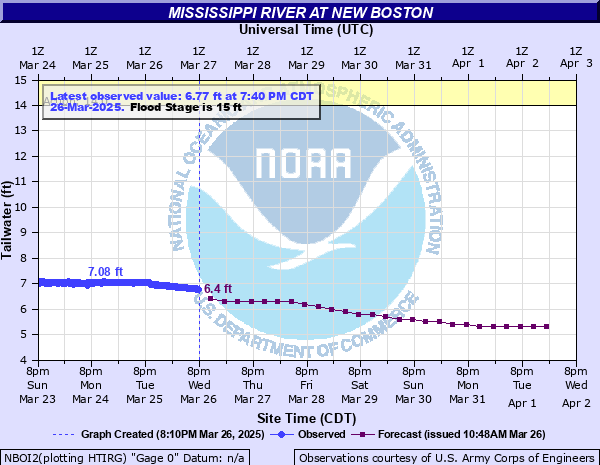
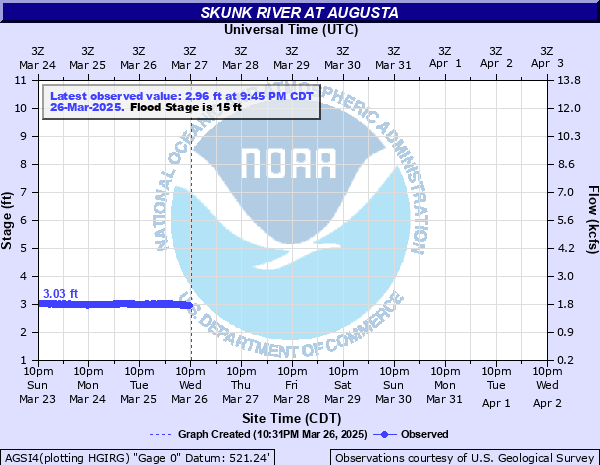
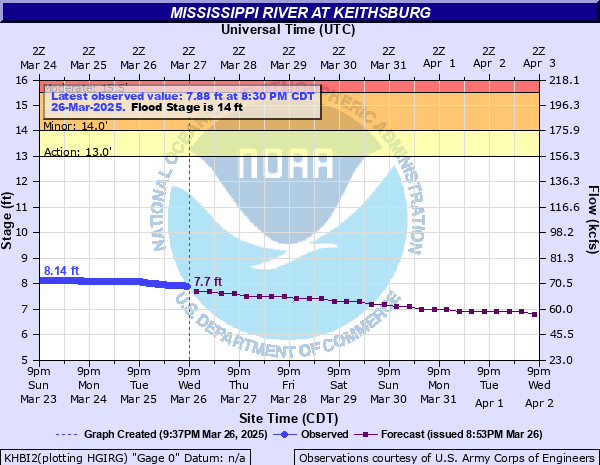
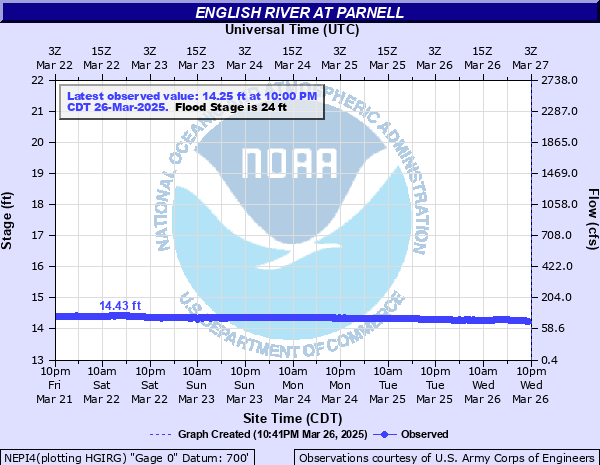
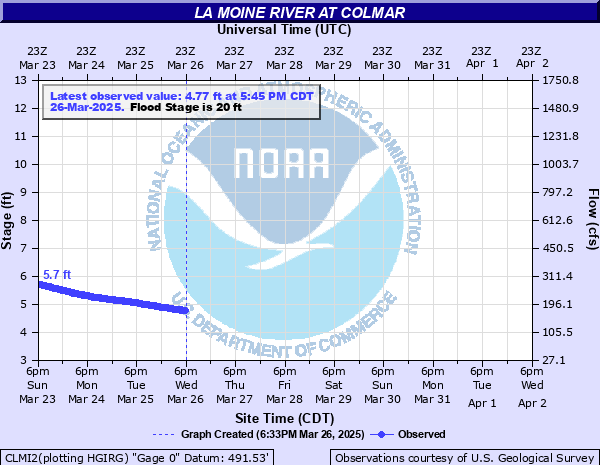
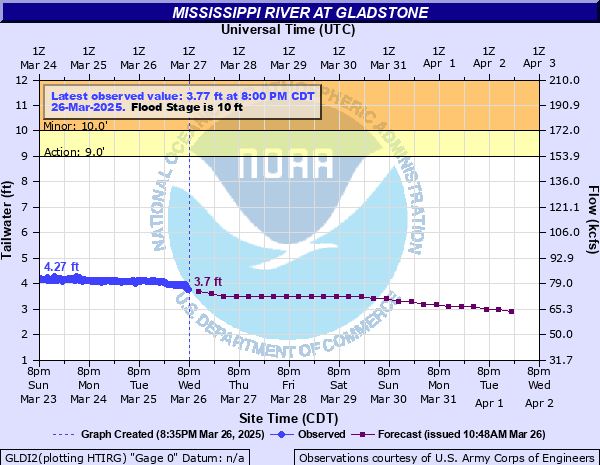
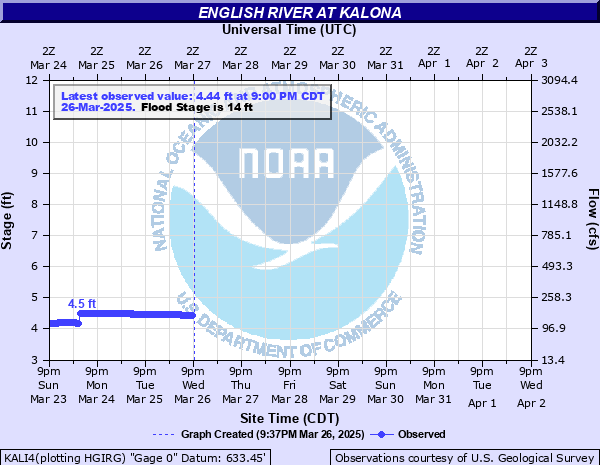
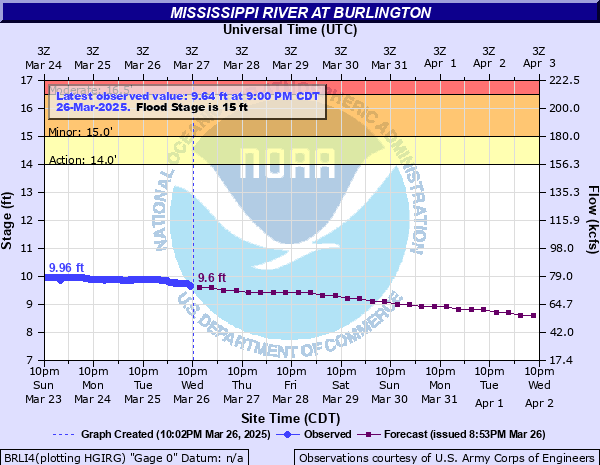
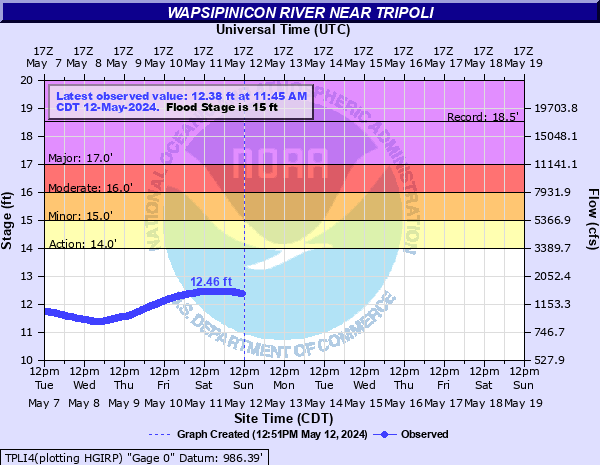
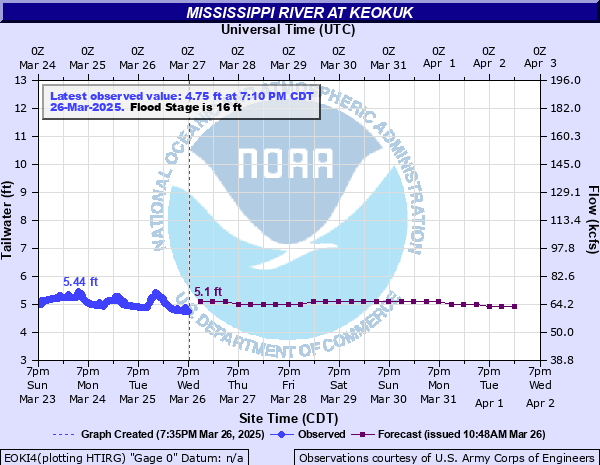
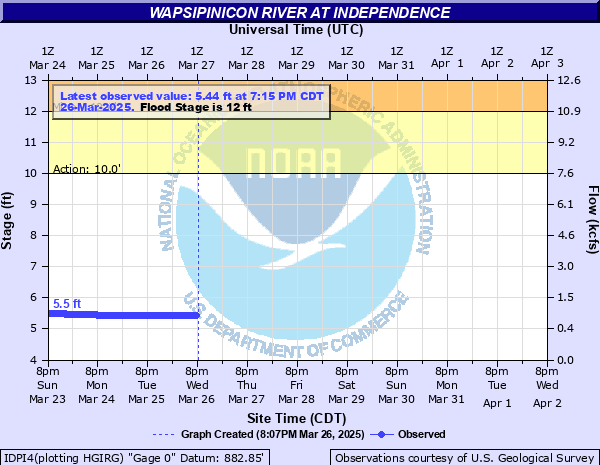
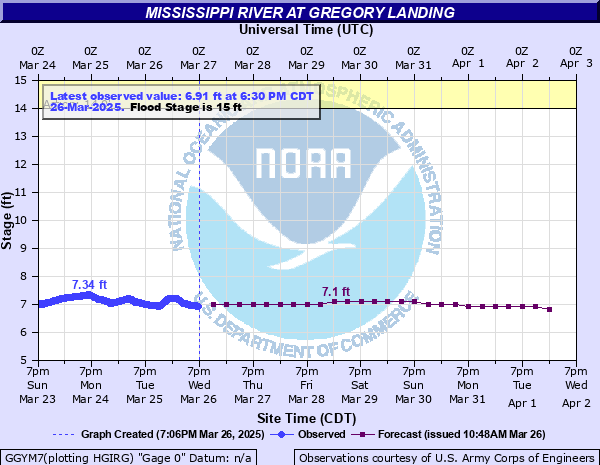
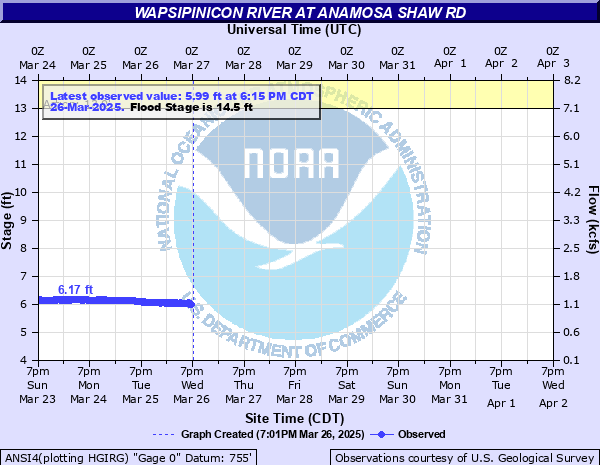
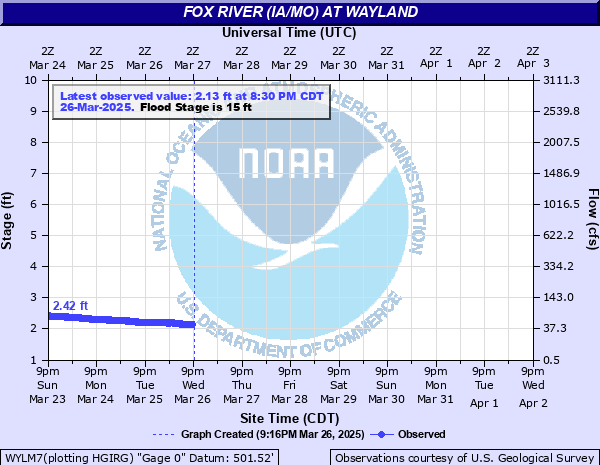
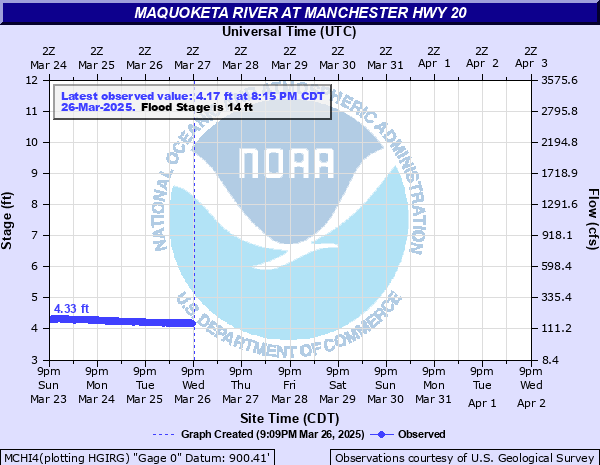
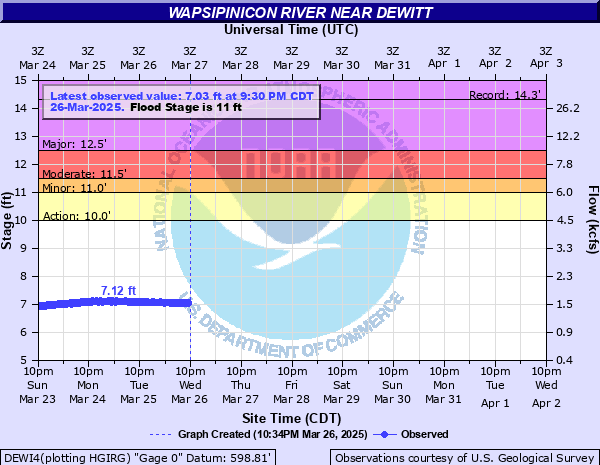
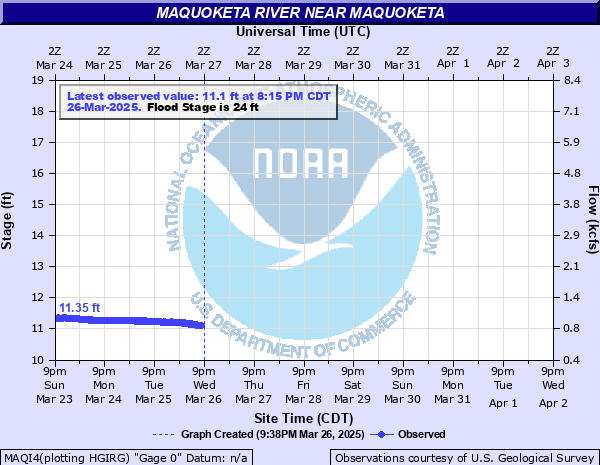
Latest River Stages (Updated Hourly)
Current Moisture Conditions
| Local 24 Hour Rainfall | Regional 24 Hour Rainfall | |||||||||||
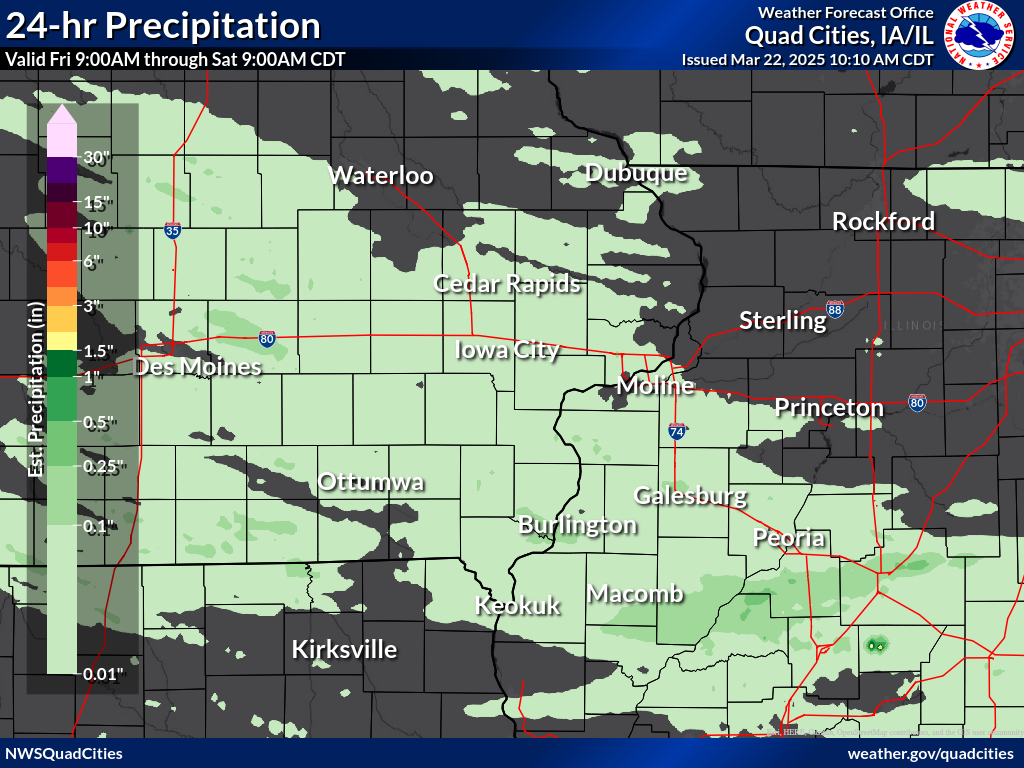 |
 |
|||||||||||
| River Levels Departure from Normal by Basin (USGS) | River Levels Departure from Normal by Gage Site (USGS) | |||||||||||
 |
 |
|||||||||||
|
||||||||||||
| Snow Cover and Water Content | Soil Moisture | |||||||||||
 |
||||||||||||
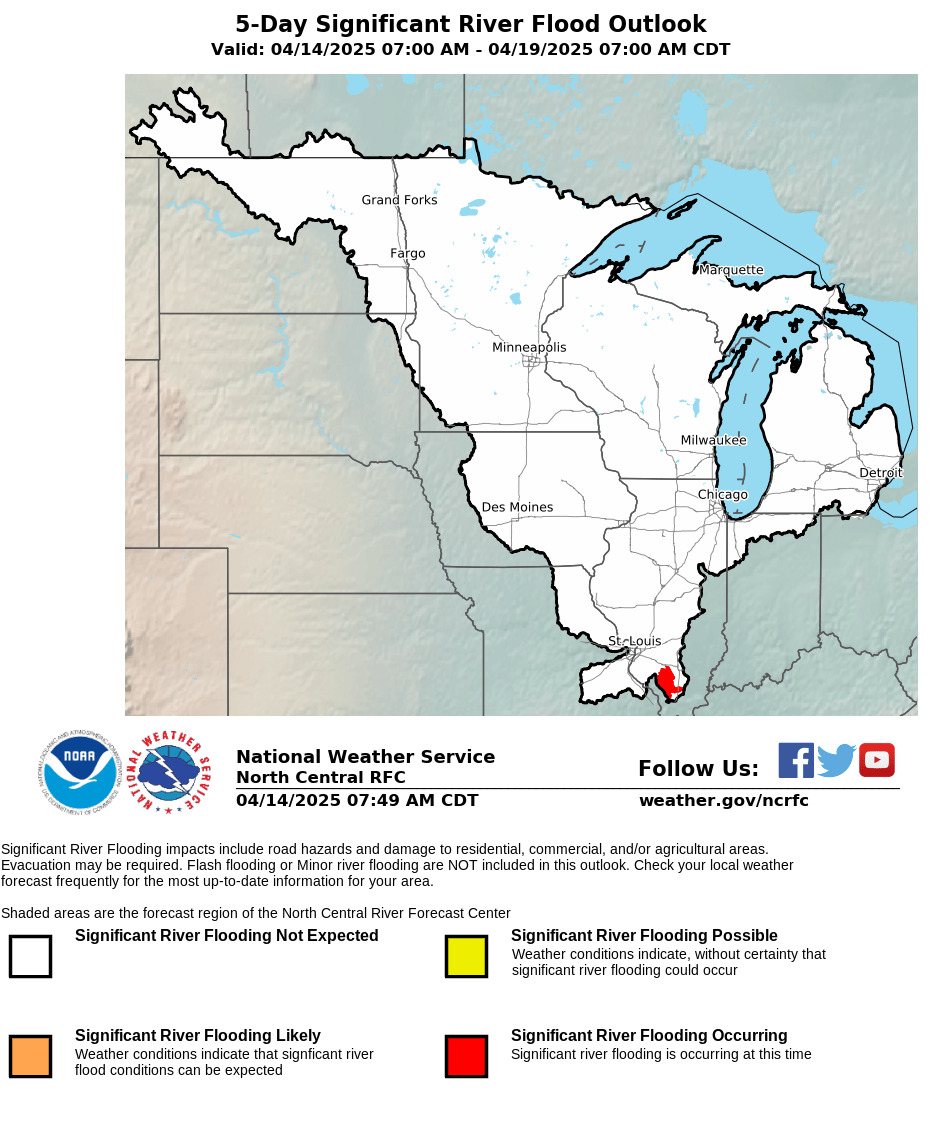
Outlooks and Forecast Rainfall
Drought
| Current Drought Status | Drought Outlook |
 |
 |
Additional Resources
| Data and Analysis | Preparedness and Safety | ||
| - U.S. Geological Survey Waterwatch (current & historical stages) | - National Flood Insurance Program | ||
| - U.S. Army Corps of Engineers Rivergages.com (current & historical stages) | - NWS Flood Safety Awareness | ||
| - Iowa Flood Center | |||
|
||||||||
|
|
||||||||
| Local Forecast Parameters (from Interactive Graphical Forecast Page) |
||||||||
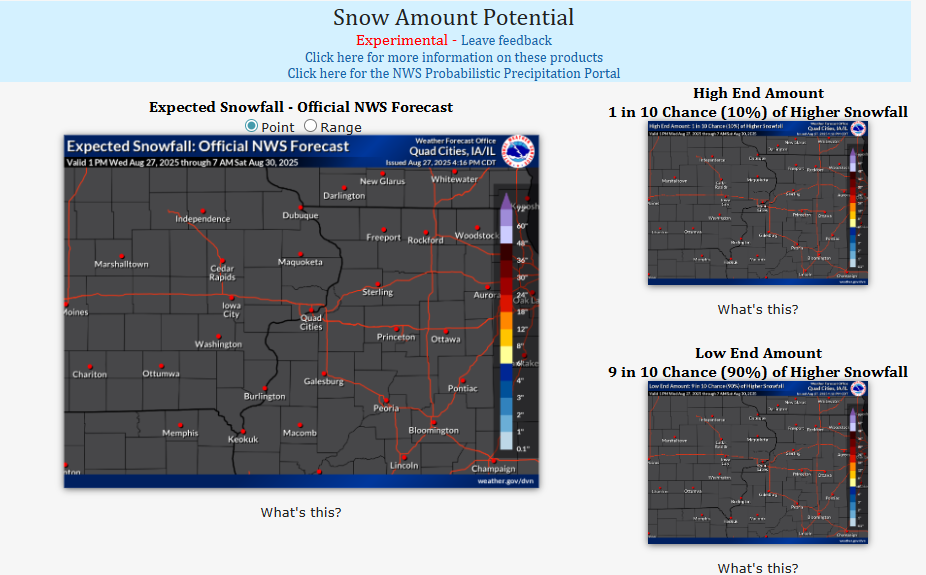
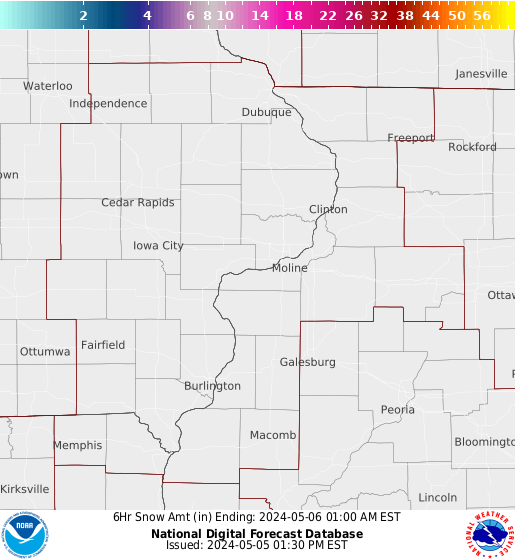
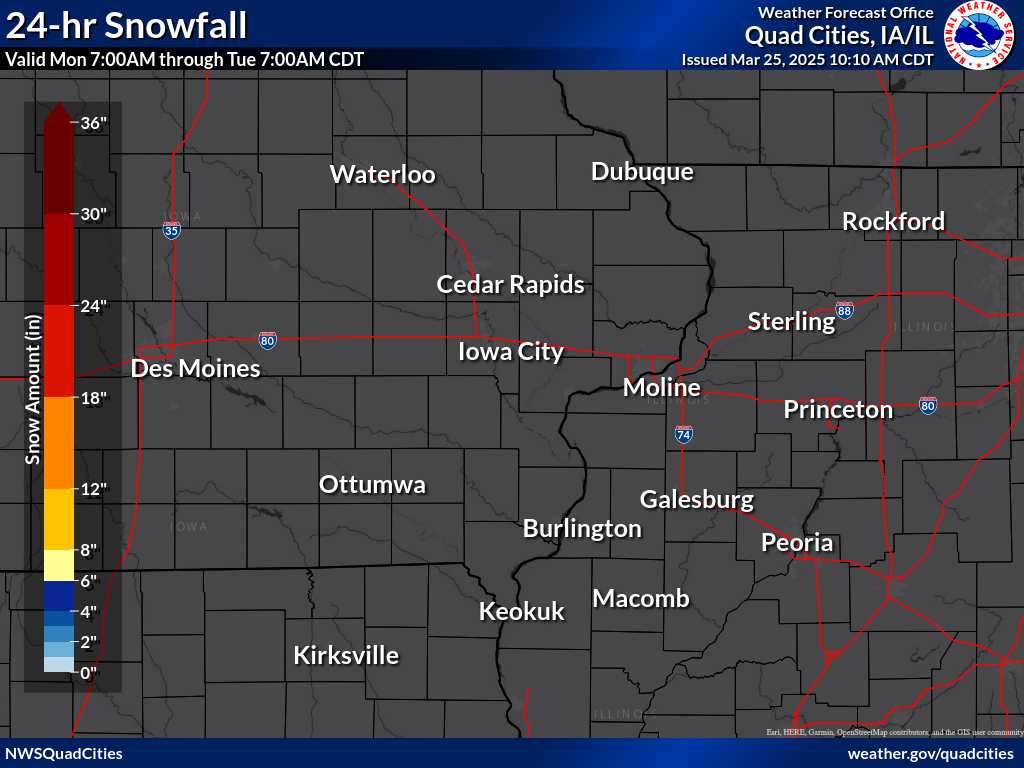
Snowfall
| 0-6 Hour | 6-12 Hour | 12-18 Hour | 18-24 Hour |
 |
 |
 |
 |
| Hourly Snowfall Forecast Graphs | |||
Example: Davenport, IA |
|||
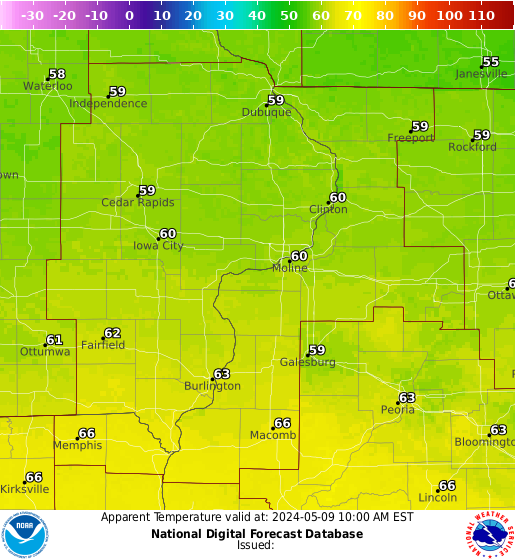
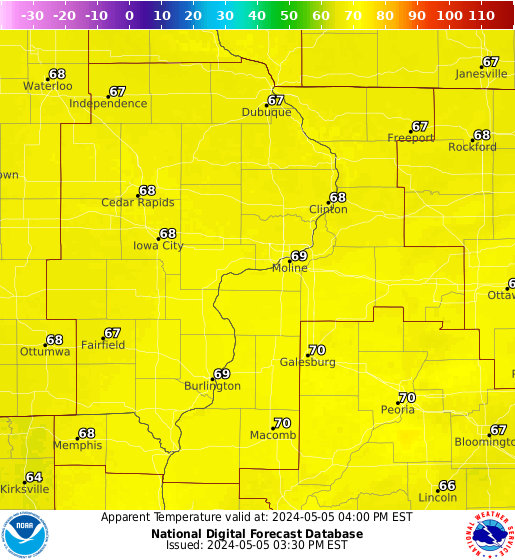
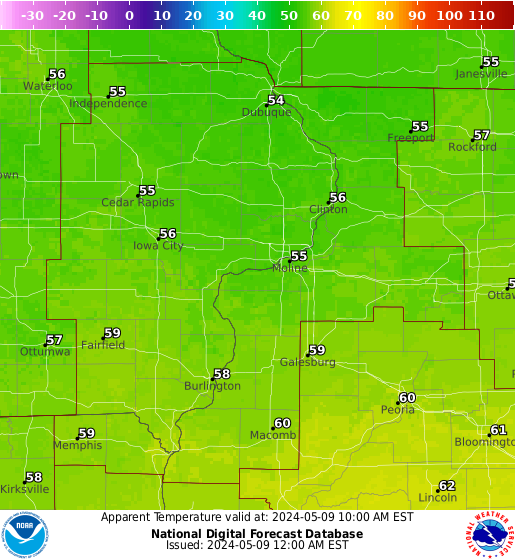
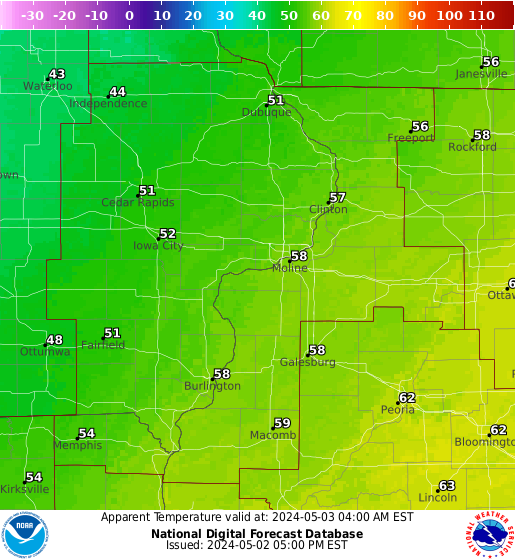
Wind Chill (Apparent Temperature)
| Important Note: Wind Chill images below are "snapshots" at a specific time. Visit the Interactive Graphical Forecast Page for forecasts at other times. |
|||
| 0-6 Hour | 6-12 Hour | 12-18 Hour | 18-24 Hour |
 |
 |
 |
 |
| Hourly Wind Chill Forecast Graphs | |||
Example: Davenport, IA |
|||
National Outlooks
Today
(Discussion)
| Freezing Rain > 1/4 inch | Snow > 4 inches | Heavy Snow > 8 inches | Heavy Snow > 12 inches |
 |
 |
 |
 |
Tomorrow
(Discussion)
| Freezing Rain > 1/4 inch | Snow > 4 inches | Heavy Snow > 8 inches | Heavy Snow > 12 inches |
 |
 |
 |
 |
Day 3
(Discussion)
| Freezing Rain > 1/4 inch | Snow > 4 inches | Heavy Snow > 8 inches | Heavy Snow > 12 inches |
 |
 |
 |
 |
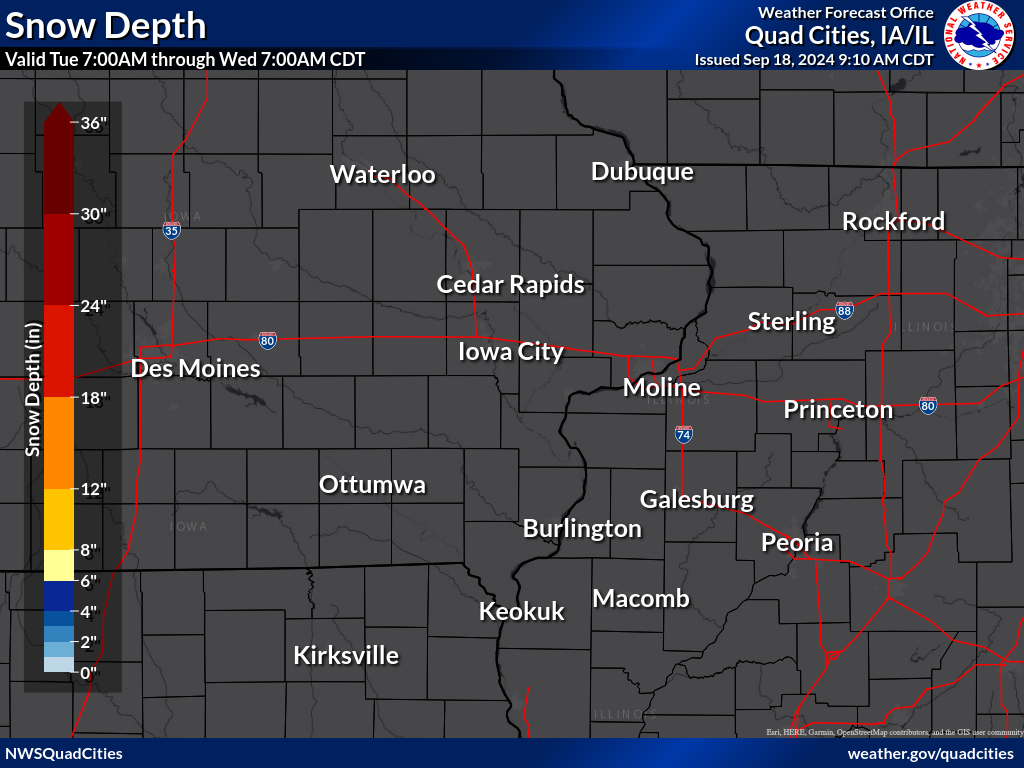
Snow Conditions
from Daily Temperature/Precipitation Maps
| Daily Snowfall Map | Daily Snow Depth Map |
 |
 |
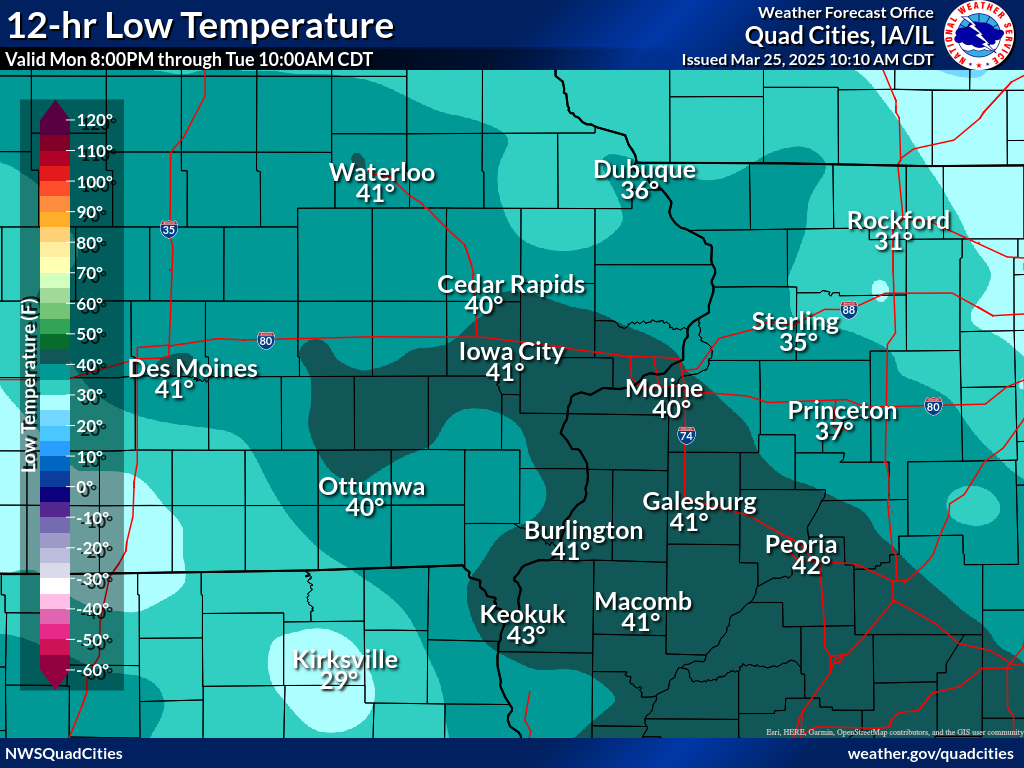
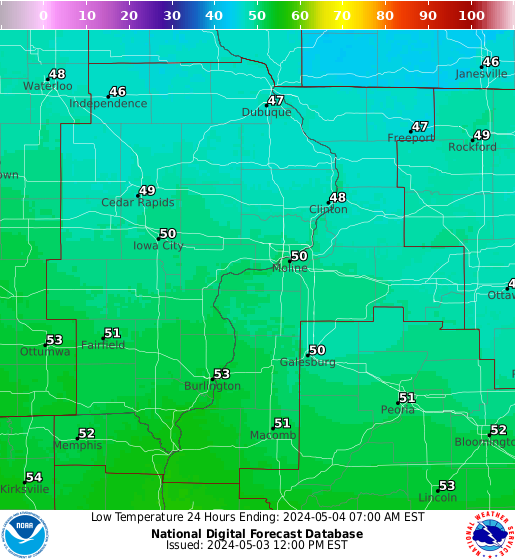
Frost / Freeze
| For comprehensive frost/freeze data, please visit our Frost/Freeze Decision Support Page. | ||
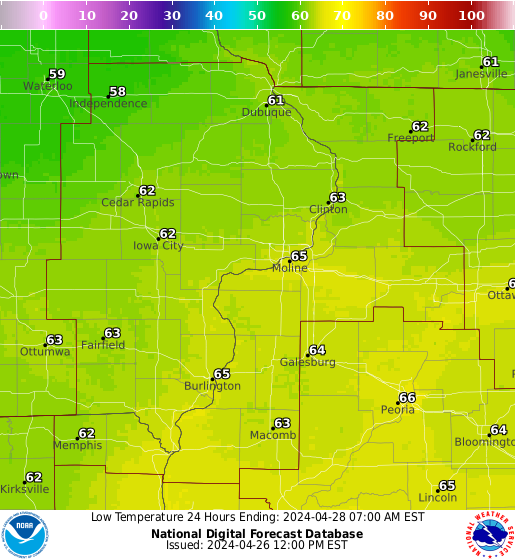
| Observed Low Temperatures | Forecast Low Temperatures | |
| 6pm - 6am LST | Day 1 | Day 2 |
 |
 |
 |
| * Lows that occur between 6am & 6pm are not depicted. | ||
Weather Maps from the Weather Prediction Center
| Surface Map | |
|
|
Road Conditions
|
|
Additional Resources
| - Winter Weather Text Products | ||
| - NWS Winter Preparedness and Safety | ||
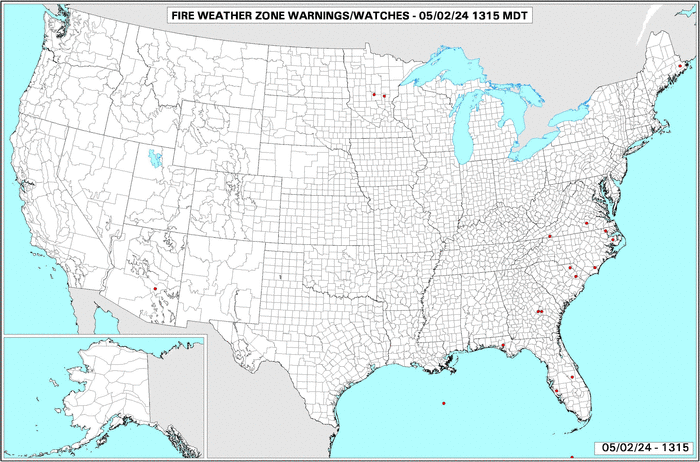
National Fire Weather Outlooks, Watches & Warnings, & Rainfall Forecasts
|
|
|||||||||||||||||||
Local Red Flag Warning
County Specific 7-Day Fire Weather Forecast
Area Weather Parameter Forecasts
Grassland Fire Danger Index
| Yellows: High |
Reds: Very High |
Purples: Extreme |
| 0-12 Hour | 12-24 Hour | 24-36 Hour |
 |
 |
 |
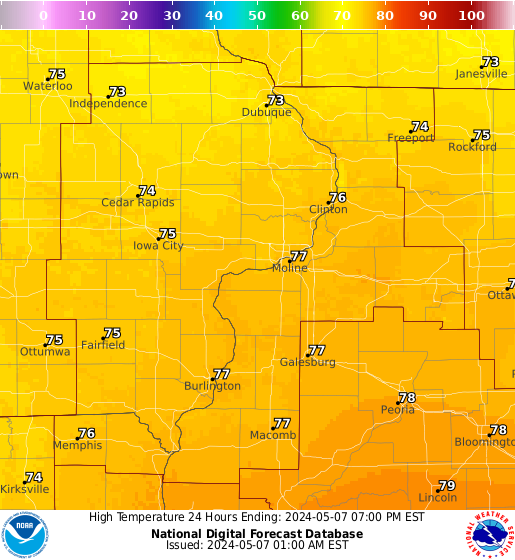
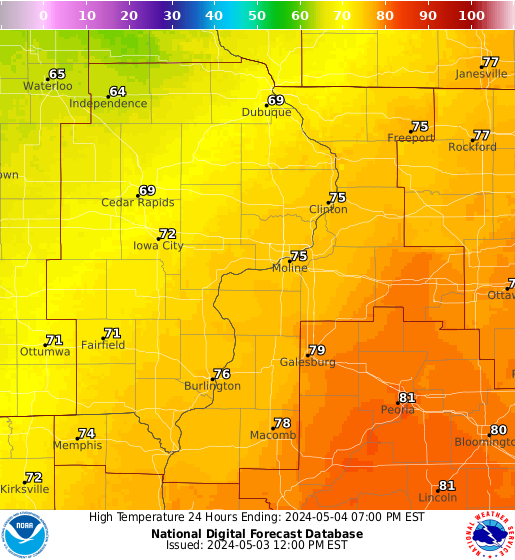
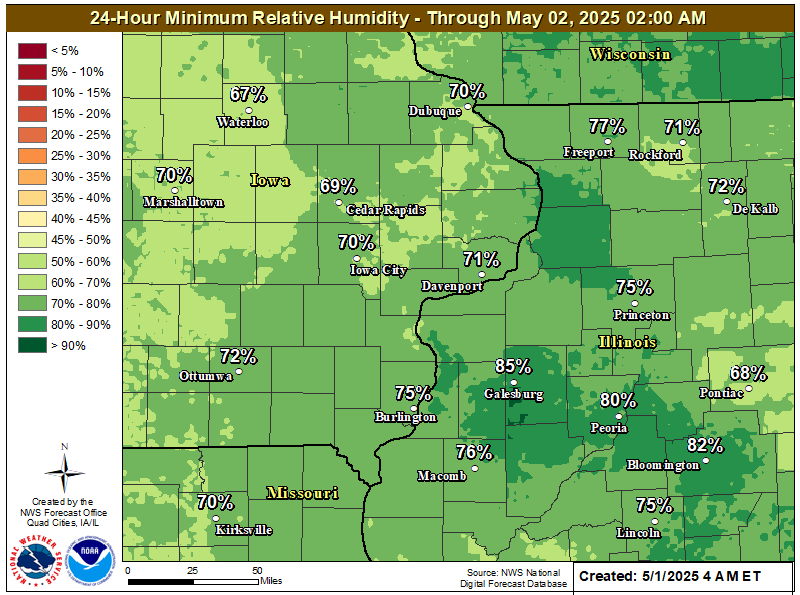
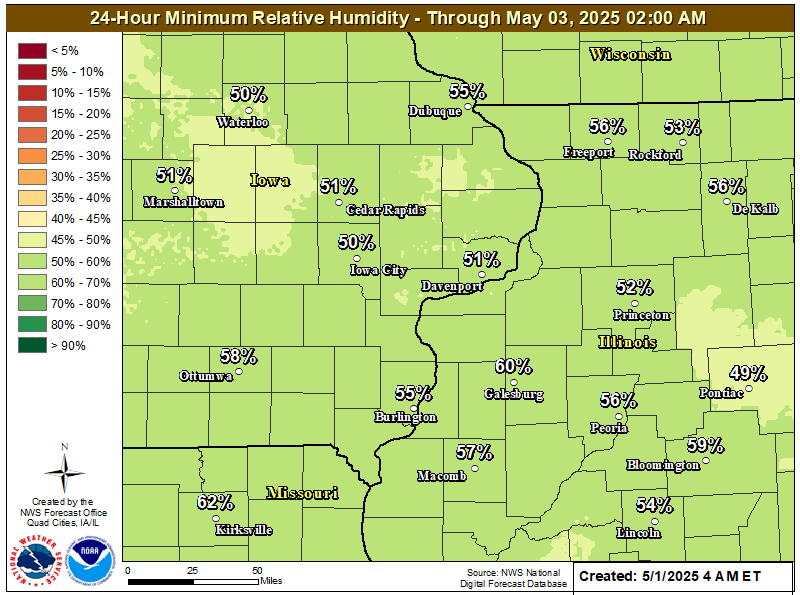
| Max Temperature Forecast | Min Humidity Forecast | |||
| 0-24 Hour | 24-48 Hour | 0-24 Hour | 24-48 Hour | |
 |
 |
 |
 |
|
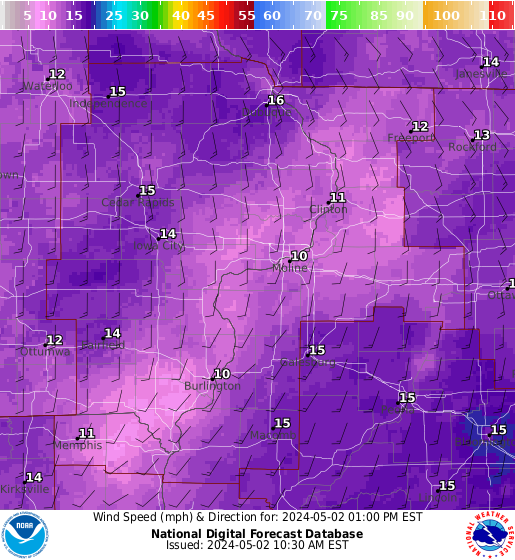
Wind & Wind Gust Forecast
| Important Note: Wind Speed and Gust images below are "snapshots" at a specific time. Visit the Interactive Gaphical Forecast Page for forecasts at other times. |
||
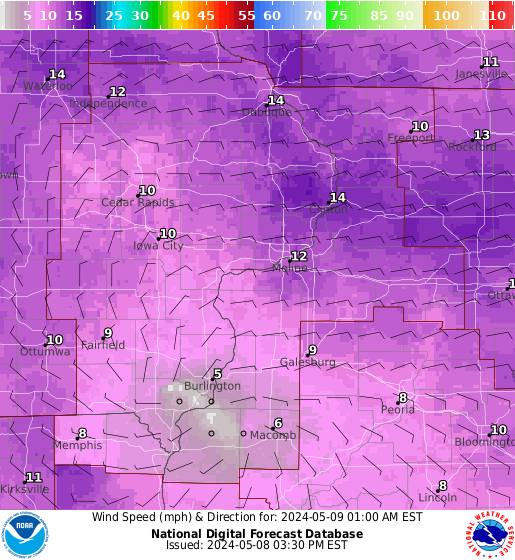
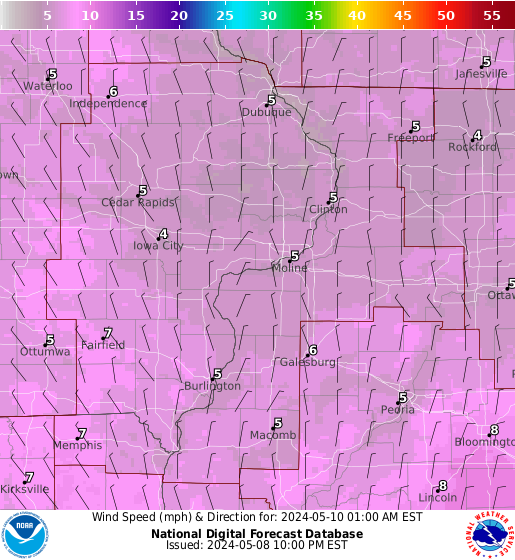
| Wind Forecast | ||
| 0-12 Hour | 12-24 Hour | 24-36 Hour |
 |
 |
 |
| Wind Gust Forecast | ||
| 0-12 Hour | 12-24 Hour | 24-36 Hour |
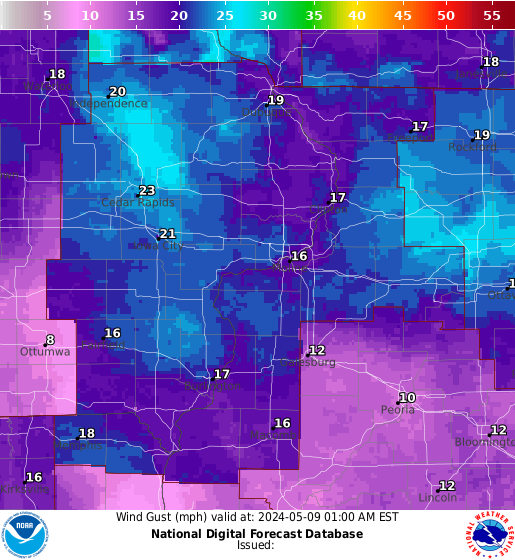 |
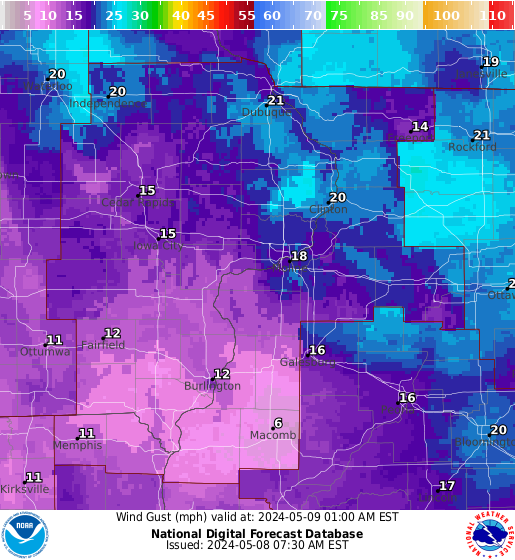 |
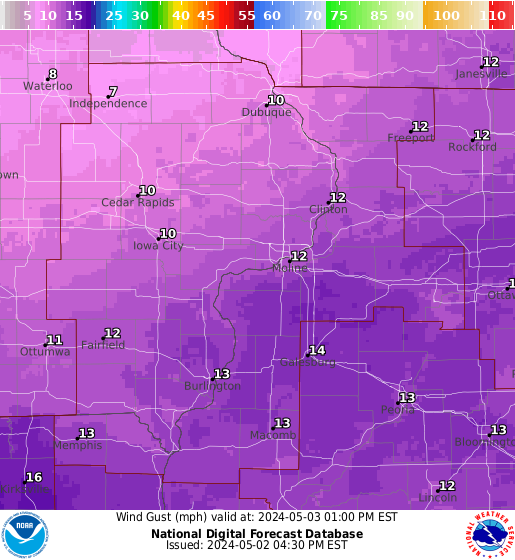 |
| Hourly Wind/Wind Gust Forecast Graphs | ||
Click on your location on the map for the hour-by-hour wind forecast. |
||
|
|
||
Additional Resources
| - Spot Forecast Request (Official Use Only) | |||
| - NWS Quad Cities Fire Weather Page | |||
| - NWS SPC Fire Weather Analysis Page | |||
| - Active Fire Map | |||
| - National Interagency Fire Center | |||
| - Inciweb | |||
| - NESDIS/Satellite Services Fire and Smoke Analysis Program's daily Fire Map, Smoke Map | |||