 |
** PLEASE NOTE: NWS Hastings considers it SLIGHTLY TOO EARLY to issue official Frost Advisories/Freeze Warnings **
**Hastings/Kearney), to around May 3-7 in far northern and western communities such as Greeley, Gothenburg and Cambridge. HOWEVER, after viewing the maps and tables contained in this story, it is readily apparent that the phrase "average last freeze date" is quite relative, as most sites exhibit a 5-9 week ra
General Overview of Spring Frost/Freeze Information:
The mid-April through early-May time frame typically features the final occurrence of freezing temperatures and/or frost of the spring season within our 30-county coverage area of south central Nebraska and north central Kansas. Based on 30-year averages, the date of the AVERAGE last spring freeze (32°-or-colder) ranges from around April 18 in far southeastern local communities (such as Beloit KS), to around April 24-29 in the Tri Cities (Grand Island/Hastings/Kearney), to around May 3-7 in far northern and western communities such as Greeley, Gothenburg and Cambridge. HOWEVER, after viewing the maps and tables contained in this story, it is readily apparent that the phrase "average last freeze date" is quite relative, as most sites exhibit a 5-9 week range between the earliest/latest last dates on record!
Please refer to the wealth of information within the tabs below (including tables/maps of average last frost/freeze/hard freeze dates) to stay on top of the frost/freeze situation across our local area this spring. This includes the "Looking Ahead" section just below, which will highlight upcoming opportunities for frost/freeze within the next 7-10 days and also gives our insight as to when we believe the last frost/freeze of spring 2024 has most likely occurred.
Looking Ahead: ** We Are Declaring An "ALL-CLEAR" on Frost/Freeze Concerns For Spring 2024! **
(updated May 17)
Recapping Last Spring's (2023) Final Frost/Freeze:
- Spring 2023: For the majority of the NWS Hastings coverage area, the spring's final freeze(and especially hard freeze) occurred a little bit later than average. Most of our area observed its final occurrence of 32º-or-colder at some point between April 23-May 4, and its final occurrence of a hard freeze (28º-or-colder) between April 23-May 3. Particularly regarding the last hard freeze, this was generally 1-2 weeks later than the 30-year average. However, once the last freeze/hard freeze occurred in early-May, a pronounced warm-up kicked in and our entire area never really came close to seeing patchy frost thereafter (let alone a truly late freeze).
Before continuing, here are a few definitions...
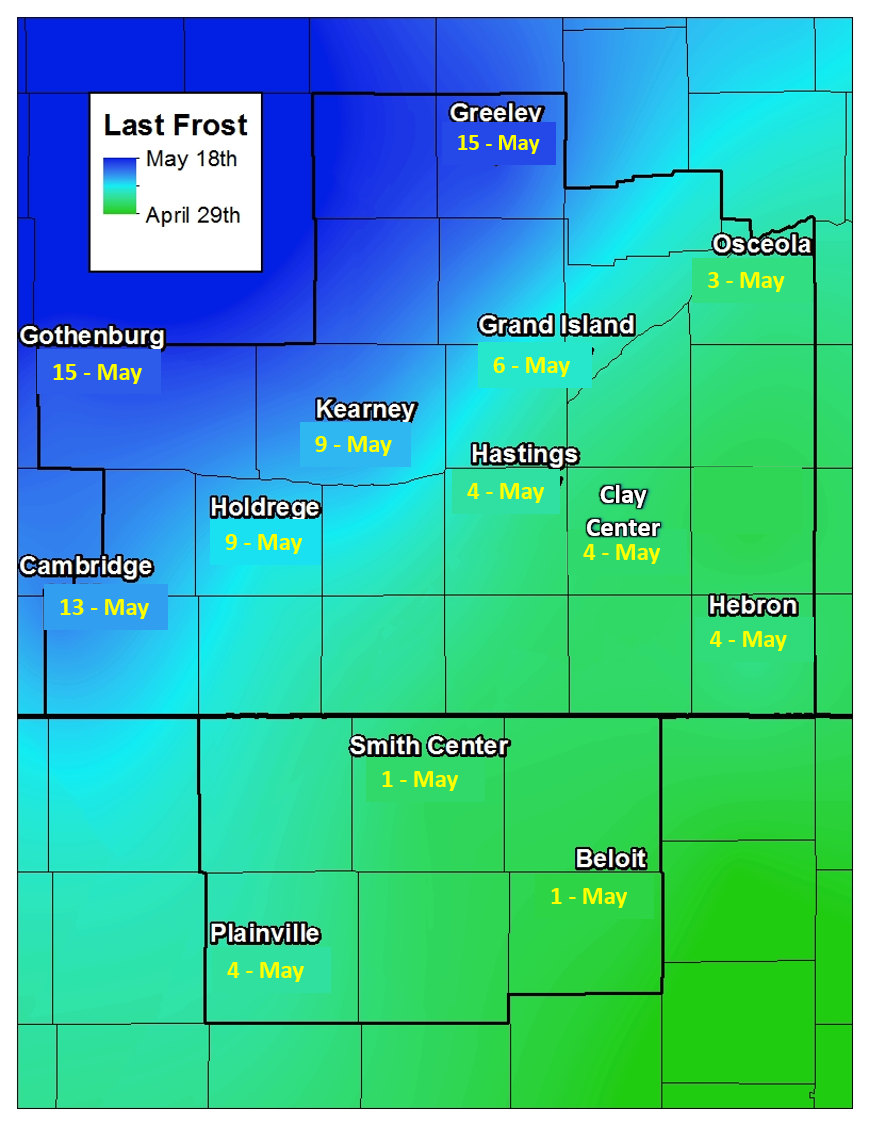
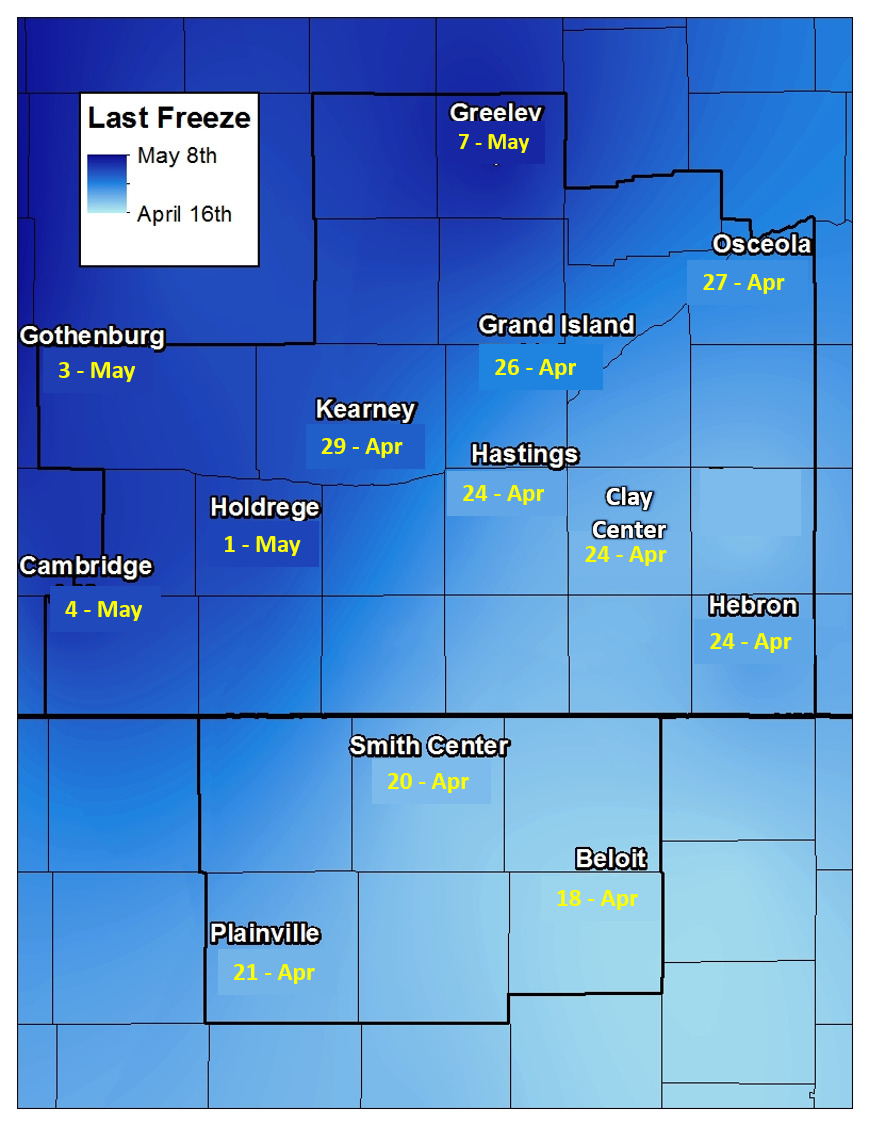
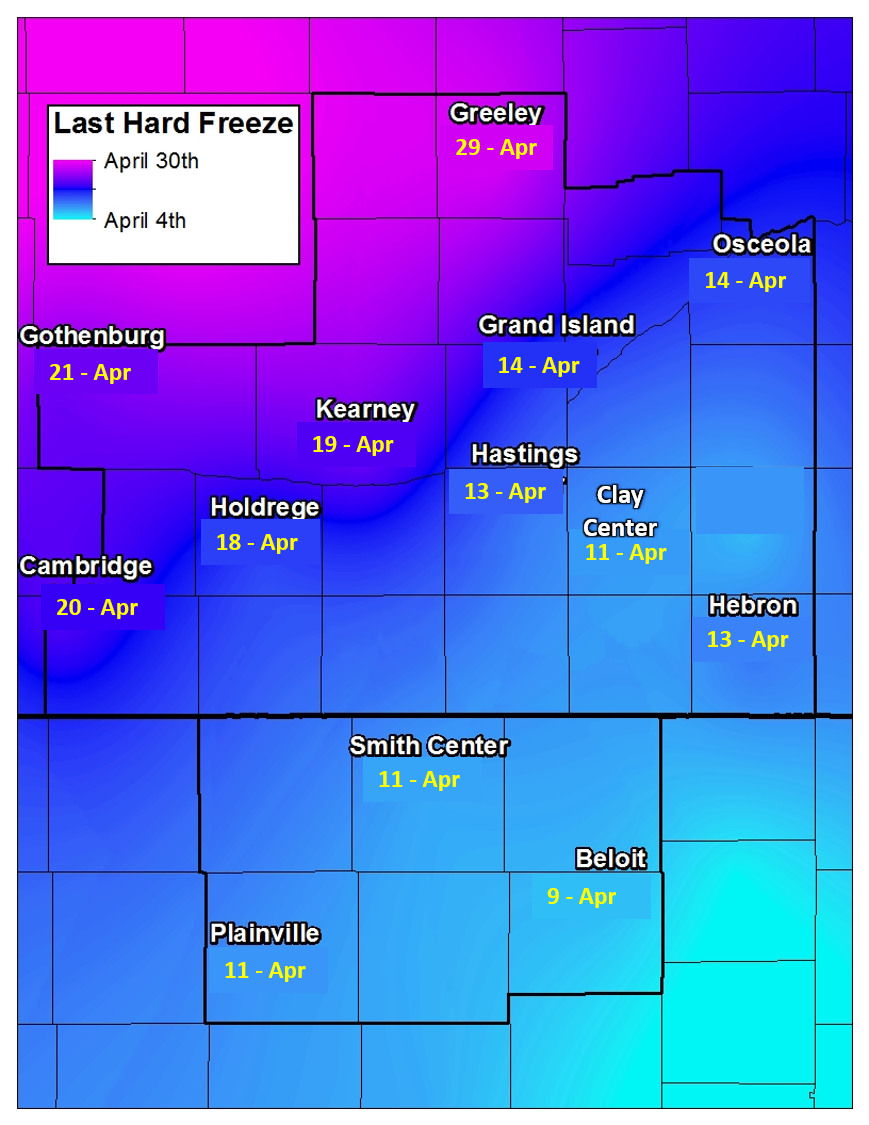
| Frost Frost occurs when there is a solid deposition of water vapor from the air. Frost will form when solid surfaces are cooled below the dew point. An air temperature range of 33°- 36° (or colder), along with light winds, is usually needed to initiate frost formation. At least minor damage is possible to plants. One must keep in mind that frost is not guaranteed if the air is very dry and/or winds are roughly 8+ MPH. The range of average dates for the LAST spring frost across across most of Freeze Freeze occurs when the temperature drops to 32°-or-lower. A freeze will damage many unprotected plants, especially if the temperature remains at-or-below freezing for several hours. The range of average dates for the LAST spring freeze across most of Hard Freeze Hard freeze (per our local NWS definition) occurs when the temperature reaches 28°-or-lower. This usually means that most seasonal vegetation will be destroyed. In addition, there is a likelihood of damage to unprotected outdoor plumbing/un-drained sprinkler systems etc. The range of average dates for the LAST spring hard freeze across across most of |
South Central Nebraska and North Central Kansas
30-Year Average Last Frost/Freeze Dates (1994-2023)
(click images to enlarge)
 |
 |
 |
| Average Last 36° Date (Last Spring Frost) 1994-2023 |
Average Last 32° Date (Last Spring Freeze) 1994-2023 |
Average Last 28° Date (Last Spring Hard Freeze) 1994-2023 |
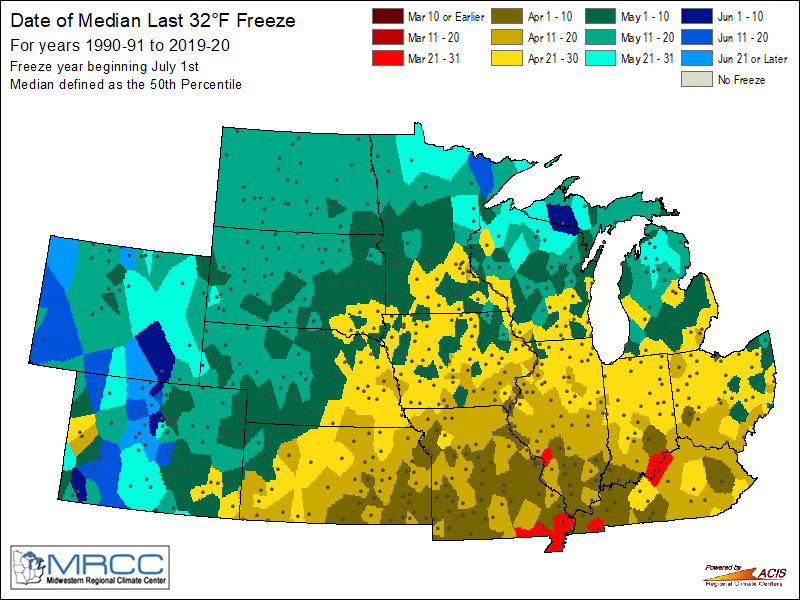
Median Dates of Last Spring Freeze & Hard Freeze (1991-2020)
(Midwestern Regional Climate Center)
 |
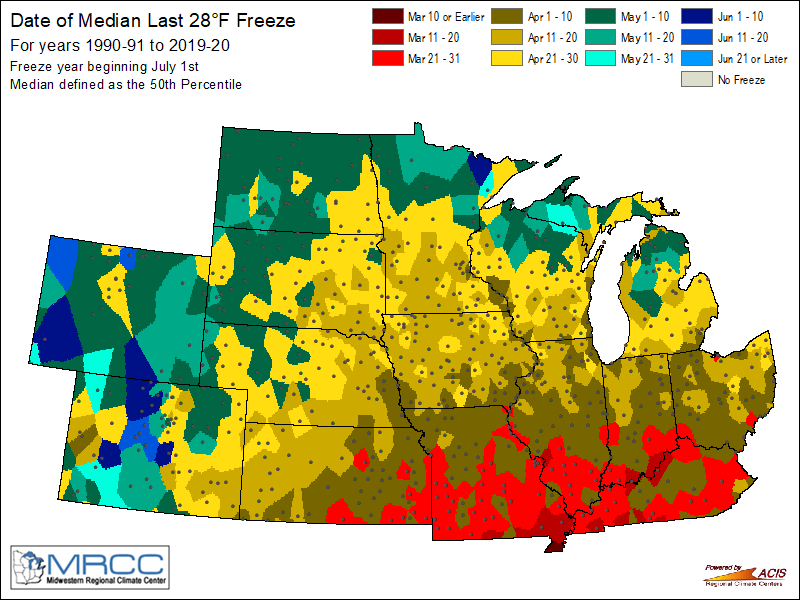 |
| Median Date of Last Spring 32° Freeze | Median Date of Last Spring 28° Hard Freeze |
Spring Frost/Freeze Data For South Central Nebraska + North Central Kansas
(*averages from most recent 30 years 1995-2024)
| Avg Last Spring Date: 28° or Colder 32° or Colder 36° or Colder |
1995-2024 Earliest Last Date: 32° Or Colder |
1995-2024 Latest Last Date: 32° Or Colder |
Last Year's (2024) Last Occurrence: 28° Or Colder 32° Or Colder 36° Or Colder |
|
| Greeley | April 29 May 7 May 15 |
April 16, 2007 | May 23, 2022 | April 22 (28º) April 24 (32º) April 29 (35º) |
| Osceola | April 14 April 27 May 3 |
April 9, 2003 | May 15, 2014 | March 28 (21º) April 22 (30º) April 22 (30º) |
| Gothenburg | April 21 May 2 May 15 |
April 11, 2012 | May 25, 2002 | April 12 (27º) April 21 (29º) May 4 (36º) |
| Kearney Airport (NWS Observer) |
April 18 April 29 May 9 |
April 10, 2003 | May 18, 2014 | April 5 (27º) April 22 (29º) April 25 (35º) |
| Grand Island (airport) |
April 15 April 25 May 6 |
April 9, 2003 | May 17, 2014 | April 20 (25º) April 21 (29º) April 24 (35º) |
| Holdrege | April 17 May 1 May 9 |
April 10, 2003 | May 17, 2011 | April 21 (28º) April 22 (29º) April 29 (34º) |
| Hastings (airport) |
April 13 April 24 May 4 |
March 9, 2012 | May 17, 2014 | April 21 (28º) April 21 (28º) April 24 (36º) |
| Clay Center, NE | April 12 April 24 May 4 |
March 11, 2012 | May 23, 2022 | March 28 (19º) April 22 (29º) April 29 (34º) |
| Cambridge | April 22 May 5 May 14 |
April 16, 2007 | May 21, 2015 | April 22 (26º) April 22 (26º) April 30 (33º) |
| Hebron | April 13 April 24 May 5 |
March 11, 2012 | May 16, 2014 | April 5 (27º) April 22 (30º) April 22 (30º) |
| Smith Center, KS | April 10 April 19 May 2 |
March 10, 2012 | May 11, 2020 | Not available Not available Not available |
| Plainville, KS | April 11 April 21 May 4 |
March 10, 2012 | May 12, 2008 | March 28 (23º) April 22 (30º) April 22 (30º) |
| Beloit, KS | April 9 April 18 May 1 |
March 11, 2012 | May 4, 2004 | March 28 (20º) April 13 (32º) April 21 (34º) |
* NOTE: 10 or fewer missing days of annual data allowed for averages
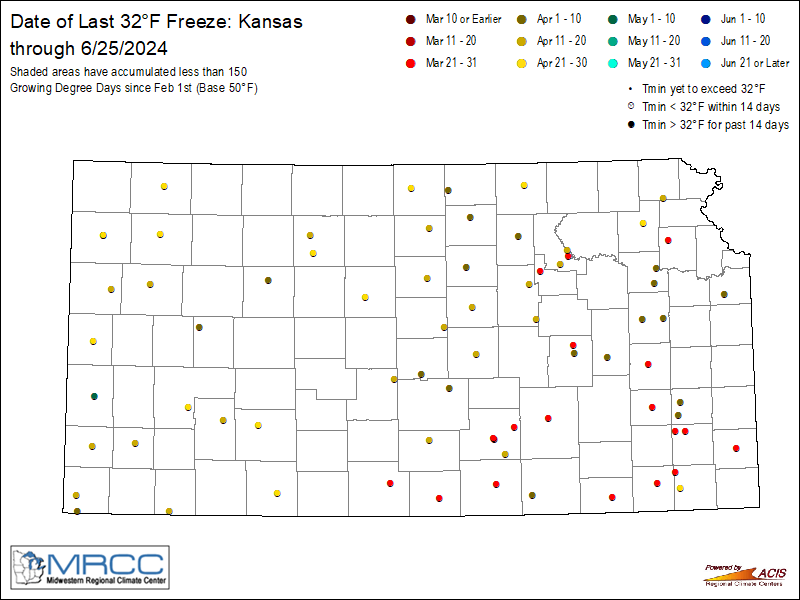
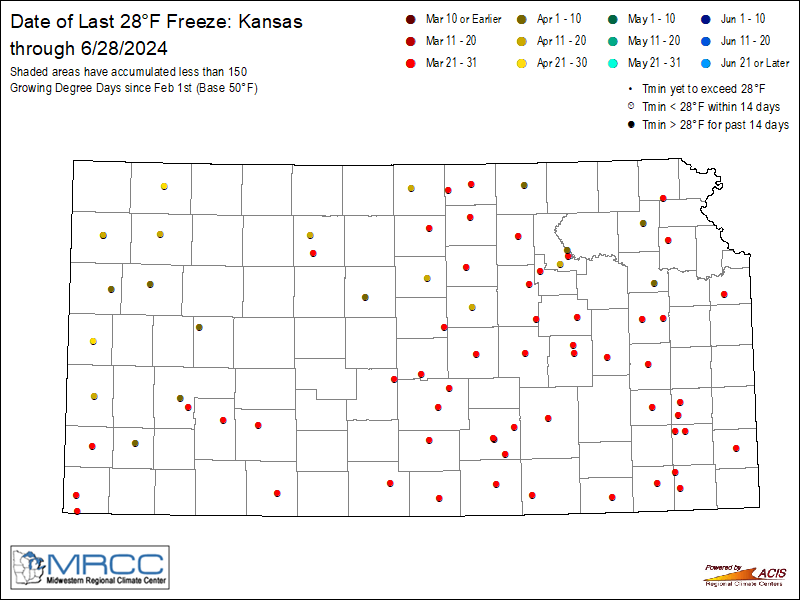
The Midwestern Regional Climate Center (MRCC) produces maps that update DAILY, depicting the most recent date that sites across the region that have fallen to at least 32° or 28° this spring. In addition, GRAY shaded areas = places that have NOT YET accumulated at least 150 Growing Degree Days (GDD/base 50º F) since Feb. 1st.
This generally means that gray-shaded areas have not yet become favorable for widespread plant/crop growth that could be significantly damaged by frost/freeze, while white-shaded areas are more likely to feature vegetation susceptible to more widespread freeze damage.
(click images to enlarge Nebraska and Kansas maps)
 |
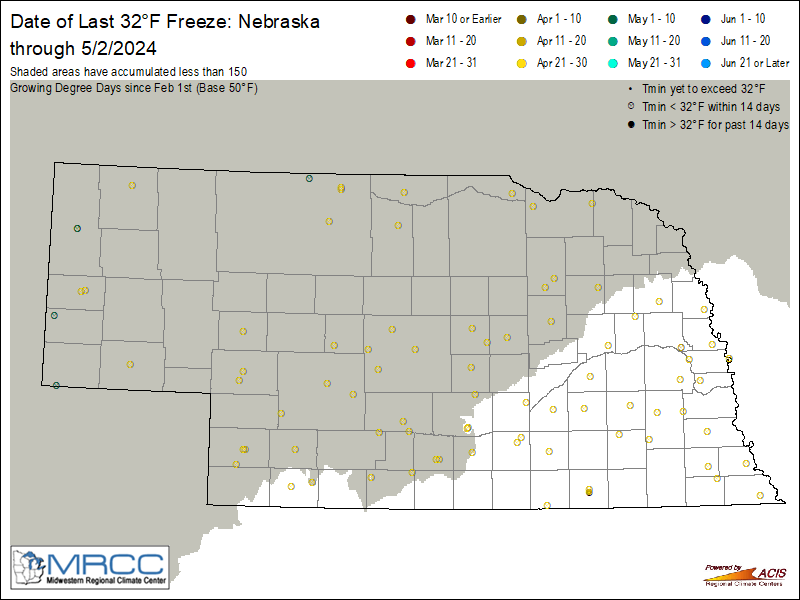 |
| KS: Most Recent 32° or Below this spring (dots) and areas most prone to have vegetation damaged by a freeze (WHITE shaded areas) | NE: Most Recent 32° or Below this spring (dots) and areas most prone to have vegetation damaged by a freeze (WHITE shaded areas) |
 |
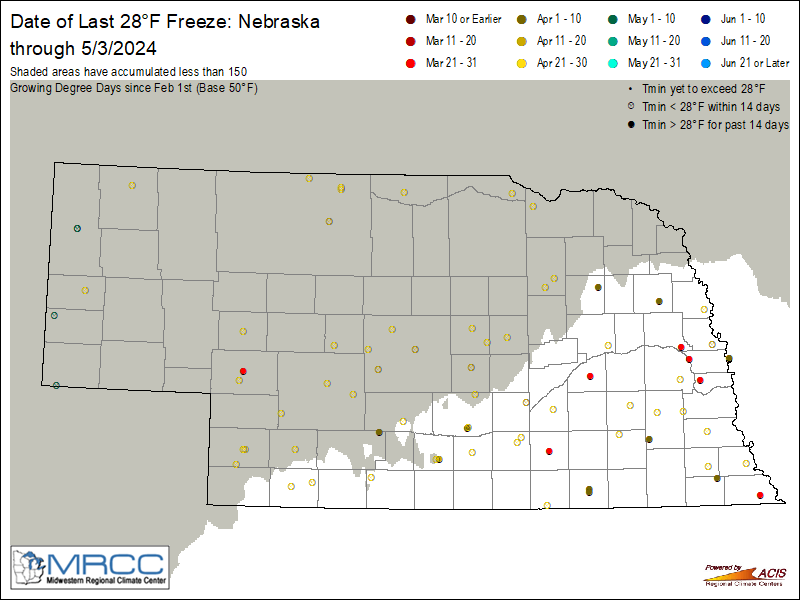 |
| KS: Most Recent 28° or Below this spring (dots) and areas most prone to have vegetation damaged by a freeze (WHITE shaded areas) | NE: Most Recent 28° or Below this spring (dots) and areas most prone to have vegetation damaged by a freeze (WHITE shaded areas) |
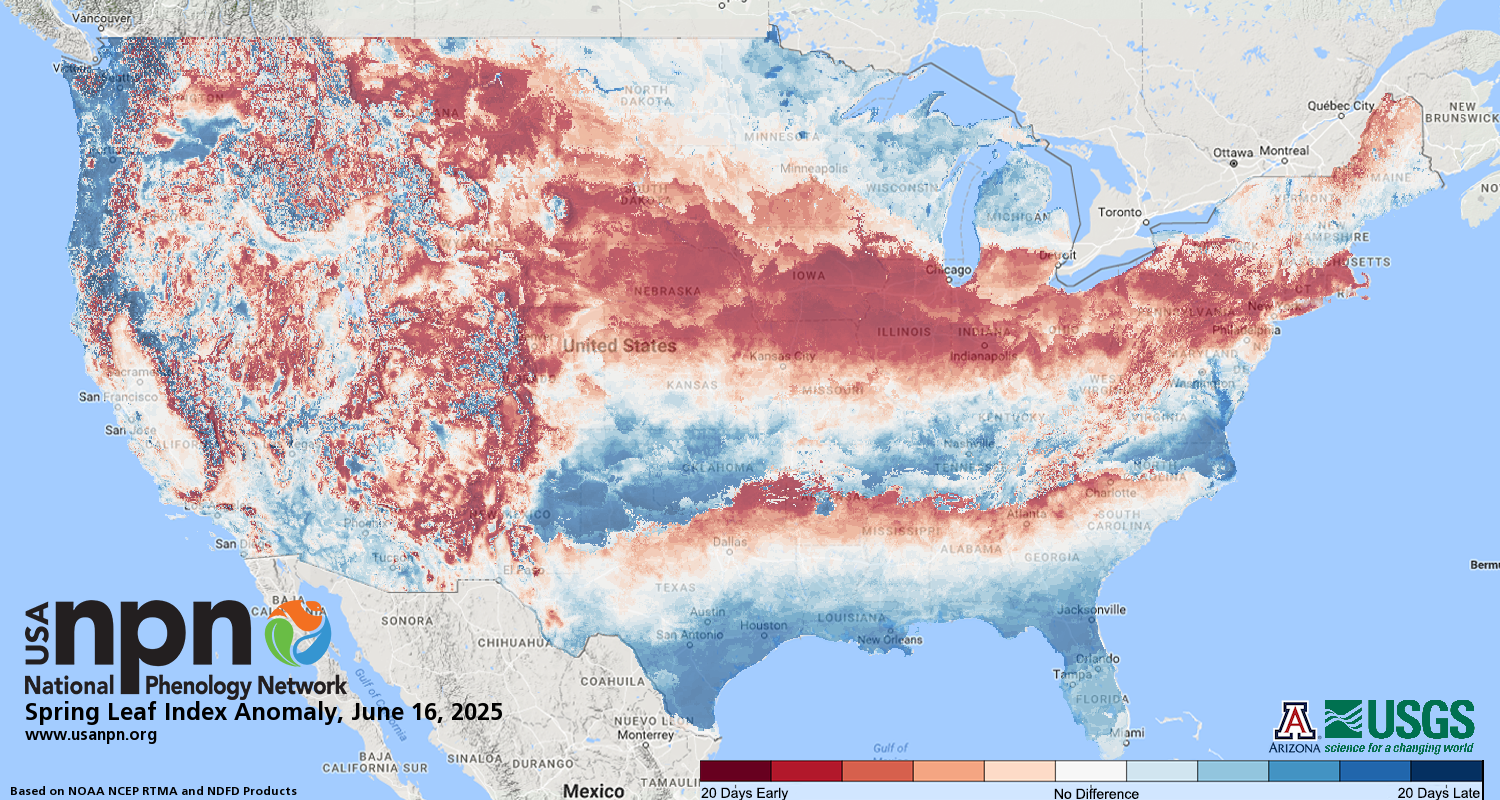
The USA-National Phenology Network (NPN) produces several maps that update DAILY, depicting the progression of particular types of spring vegetation across the nation, and how it compares to long-term averages. See their web page for much more detail and information, but the two maps highlighted below depict First Leaf Index Anomaly and First Bloom Index Anomaly. In short, this means they show the current status of some types of spring vegetation (first leaf-out or first-flowering) compared to long-term averages, giving an idea of whether spring is "ahead" of or "behind" schedule.
(click images to enlarge)
 |
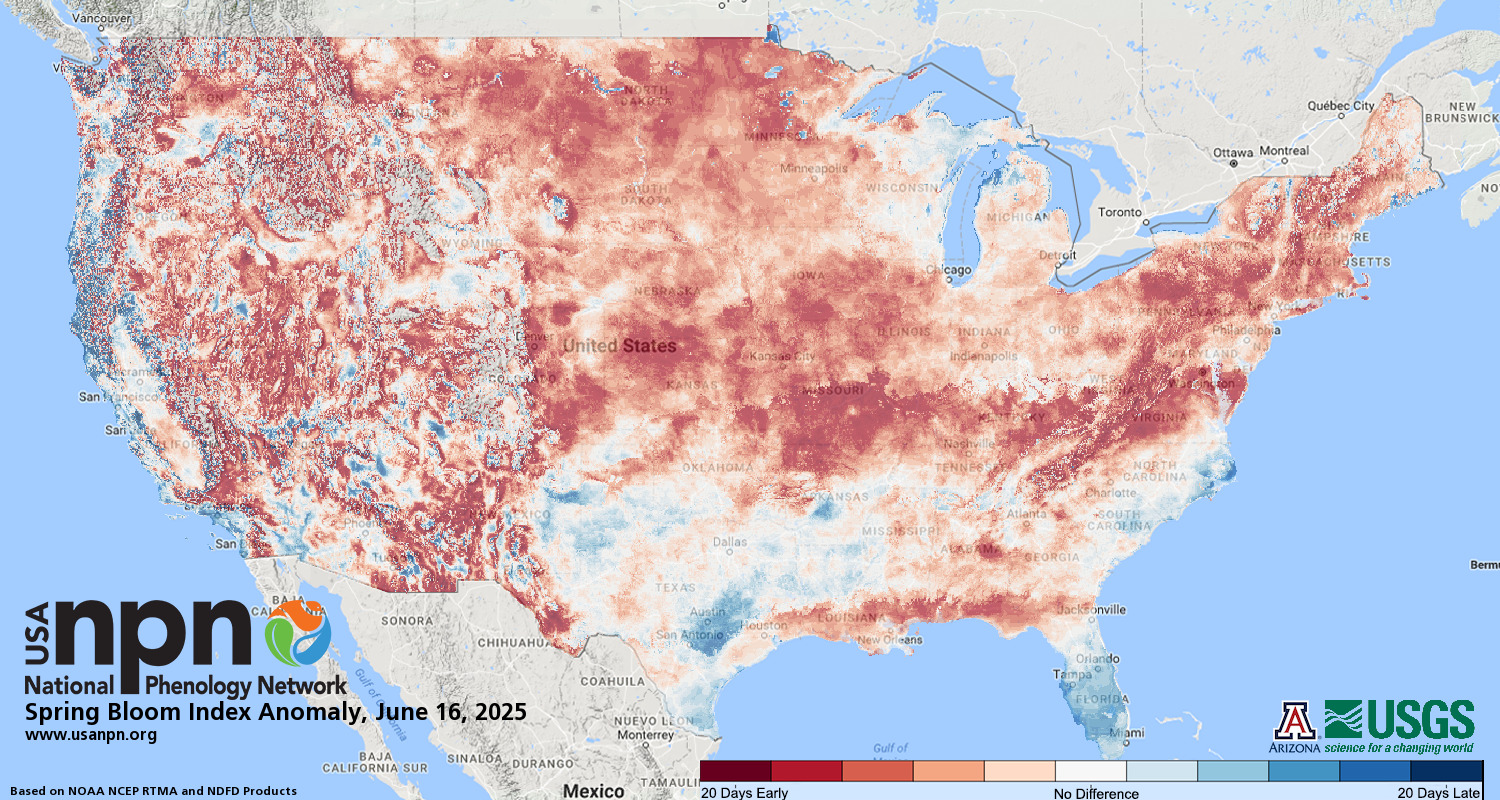 |
| Spring Leaf Index Anomaly | Spring Bloom Index Anomaly |
For more Frost/Freeze related information including an interactive mapping tool, check out the following resource:
 |
Media use of NWS Web News Stories is encouraged! Please acknowledge the NWS as the source of any news information accessed from this site. |
|

