
Wildfire smoke continues to impact air quality from the Great Lakes region into New England and the Mid-Atlantic today with widespread Air Quality Alerts in effect. Severe thunderstorms are expected across portions of the Ohio Valley and Lower Great Lakes into the Mid-Atlantic and Northeast, this afternoon into the evening. Monsoonal thunderstorms may bring areas of flooding to the Southwest. Read More >
One of the most damaging and meteorologically unique winter storms to strike the eastern United States occurred on Thanksgiving weekend 1950. After it was over, as much as 57 inches of snow blanketed the central Appalachians (with locally up to 62 inches at Coburn Creek, WV) and one of the most widespread and damaging wind events ever recorded over the Northeastern U.S. made the Great Appalachian Storm of 1950 the costliest storm on record up until that time. East Kentucky wasn’t spared as record setting cold combined with over a foot of snow for many areas.
Timeline
The precursor to the storm was the passage of an arctic cold front late on the 23rd into the 24th. The front passed through eastern Kentucky around midnight and the change in airmass was dramatic. Temperatures plunged from the 40s and 50s just ahead of the front to the teens just behind it. A thin but heavy band of snow accompanied the dramatic temperature drop behind the front with as much as 7 inches falling across southeast Kentucky on the morning of the 24th.
The record setting arctic airmass behind the front sent temperatures to all-time monthly lows across the Upper Midwest and Ohio Valley. Chicago dropped to -2ºF on the 24th equaling their all-time monthly low, and a day later Louisville (-1ºF), Lexington (-3ºF) and Bowling Green (-7ºF) all recorded record lows for the month. Temperatures across eastern Kentucky by the morning of the 25th were in the single digits and teens, and still dropping.
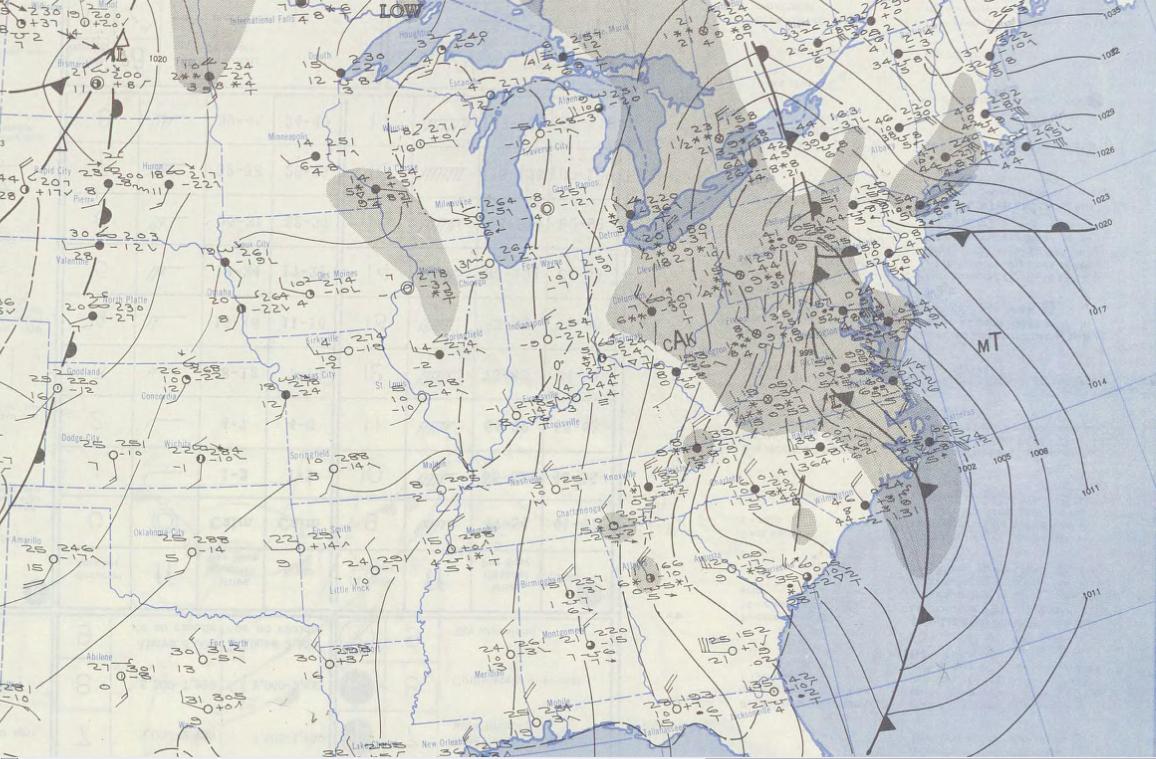
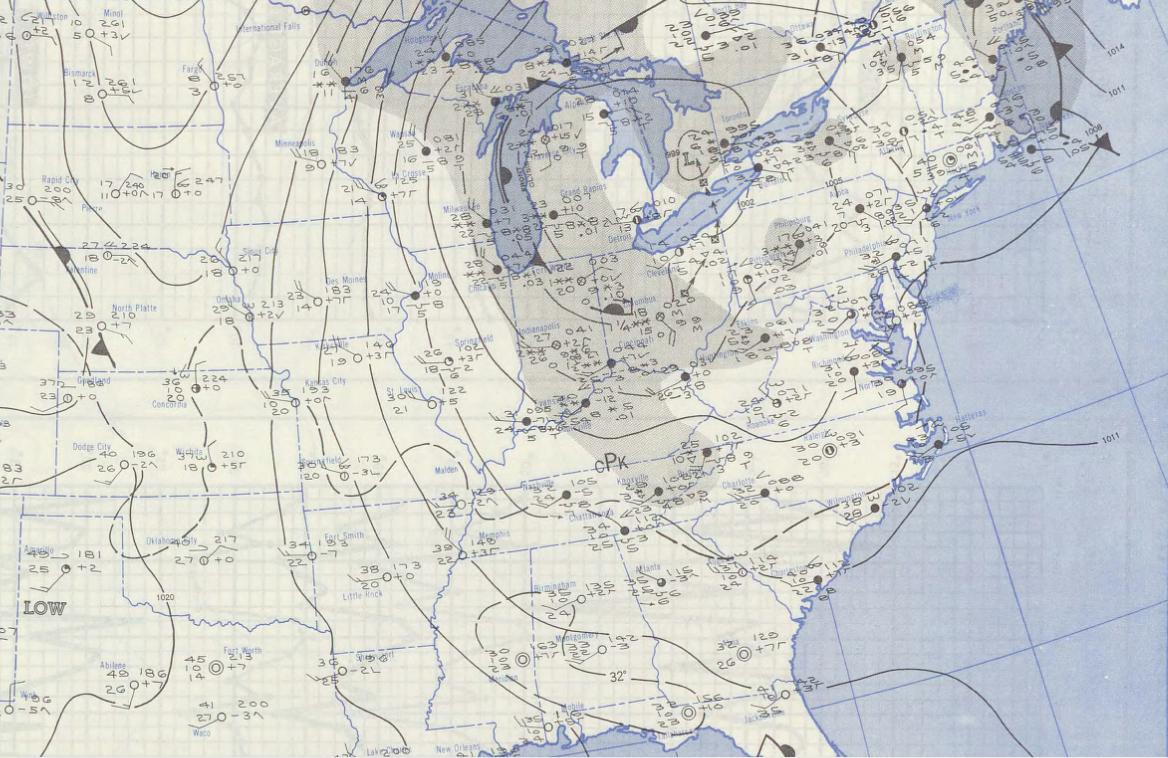
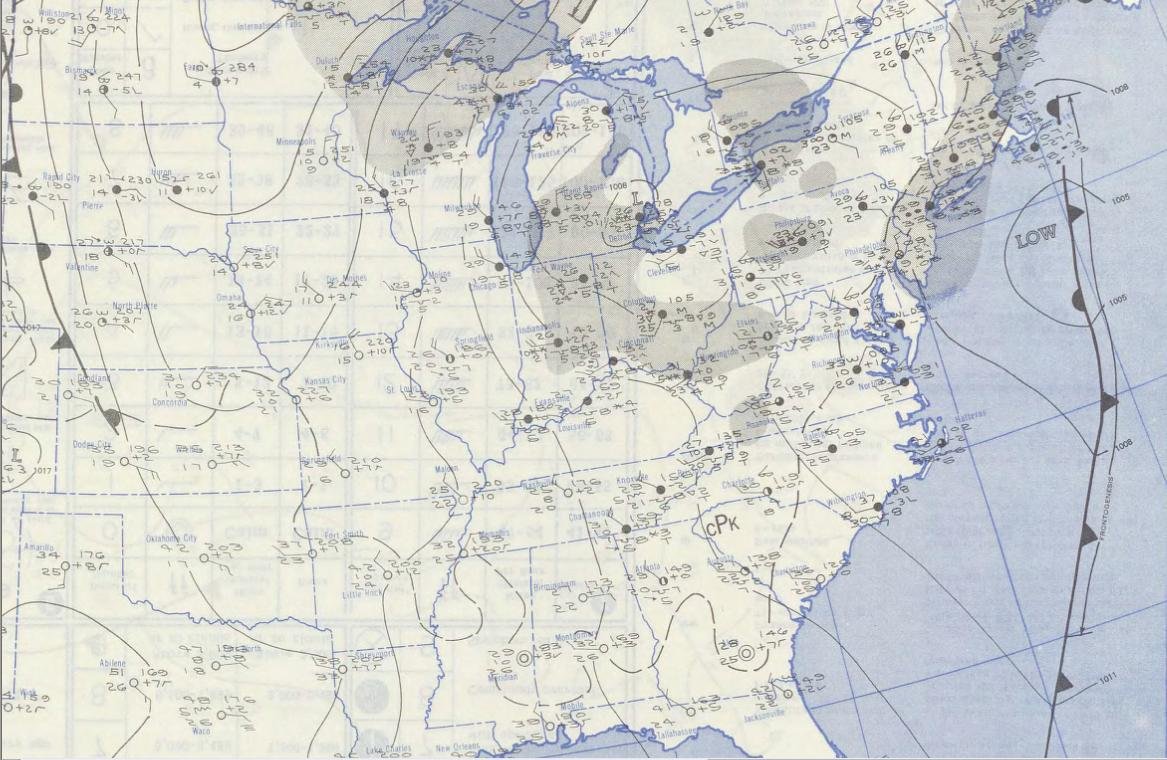
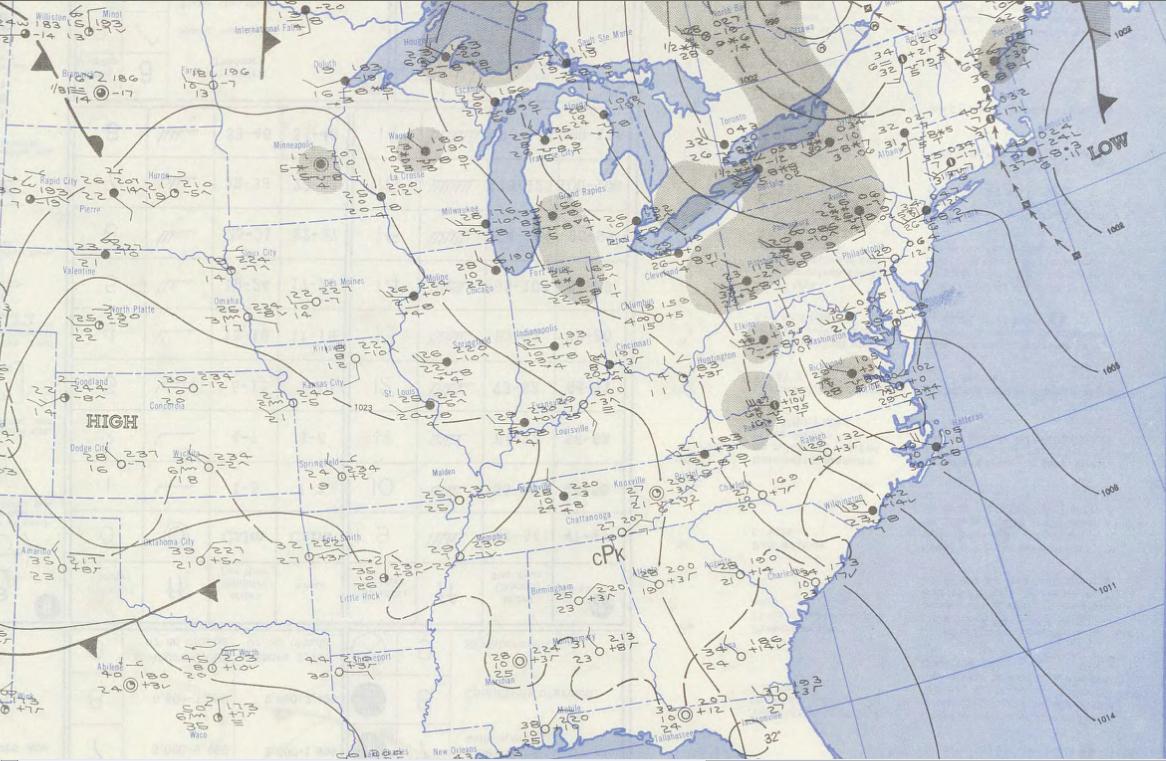
Low pressure quickly developed on the arctic front over the Carolinas on the 25th. The low tracked northwestward into Ohio by midday on the 26th with a shield of heavy snow expanding back to the northwest as it did so. The storm slowly wound down as it spun in place over Lake Erie on the 27th and 28th before it finally weakened and exited into Canada on the 29th and 30th.
Surface maps are included below for each day from the 24th through the 29th. Click on each map to enlarge.
 |
 |
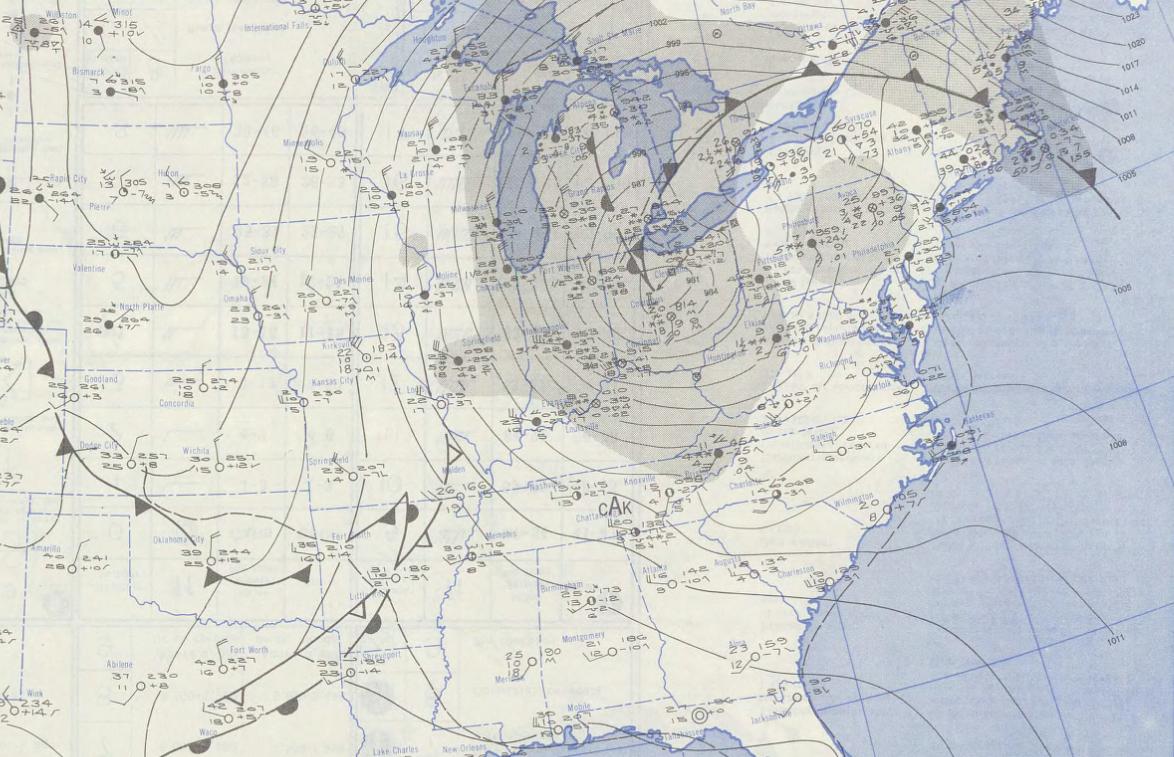 |
| Surface Chart, 1:30 am November 24, 1950 | Surface Chart, 1:30 am November 25, 1950 | Surface Chart, 1:30 am November 26, 1950 |
 |
 |
 |
| Surface Chart, 1:30 am November 27, 1950 | Surface Chart, 1:30 am November 28, 1950 | Surface Chart, 1:30 am November 29, 1950 |
|
|
More information on this storm can be found in the article "The Great Appalachian Storm in Historical Context" courtesy of the National Centers for Environmental Information.


