Fast Facts | Temperatures | Heat Indices | Records | Meteorology | Other Links
Chicago
Rockford
Area-wide
Nationwide
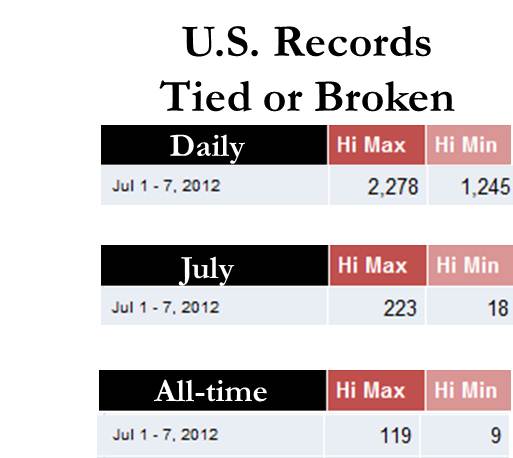
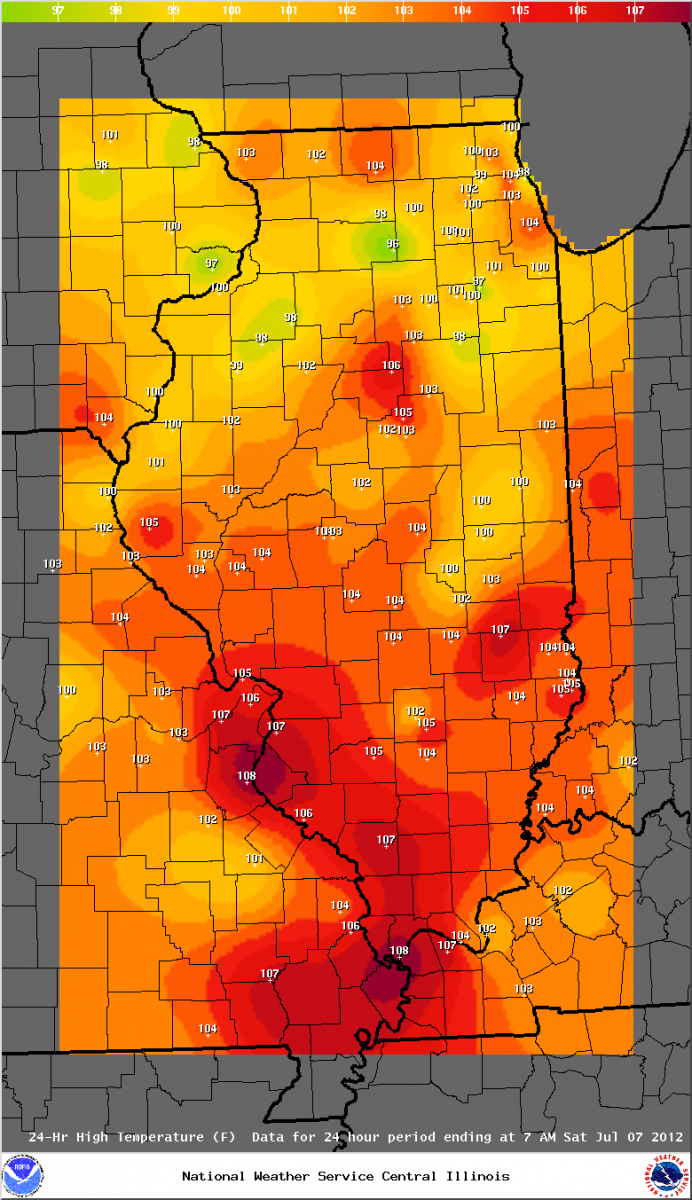
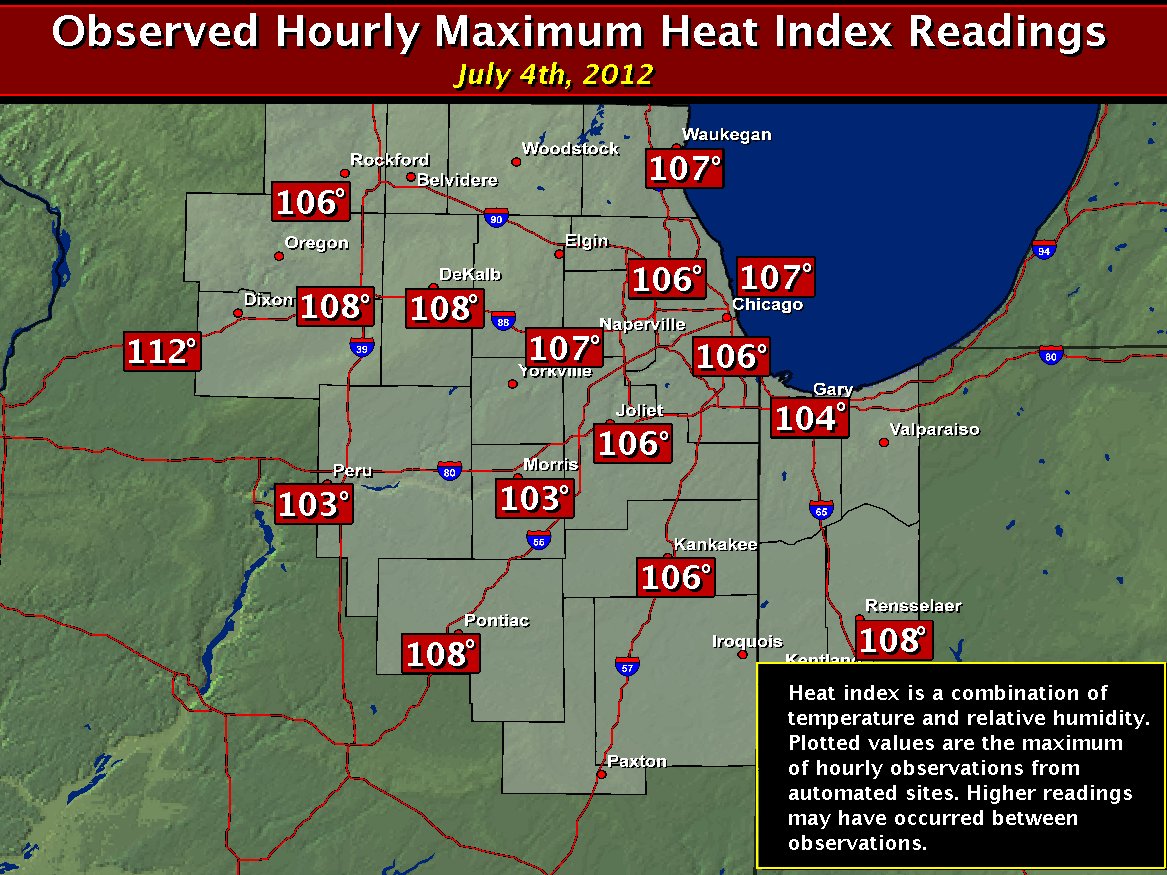
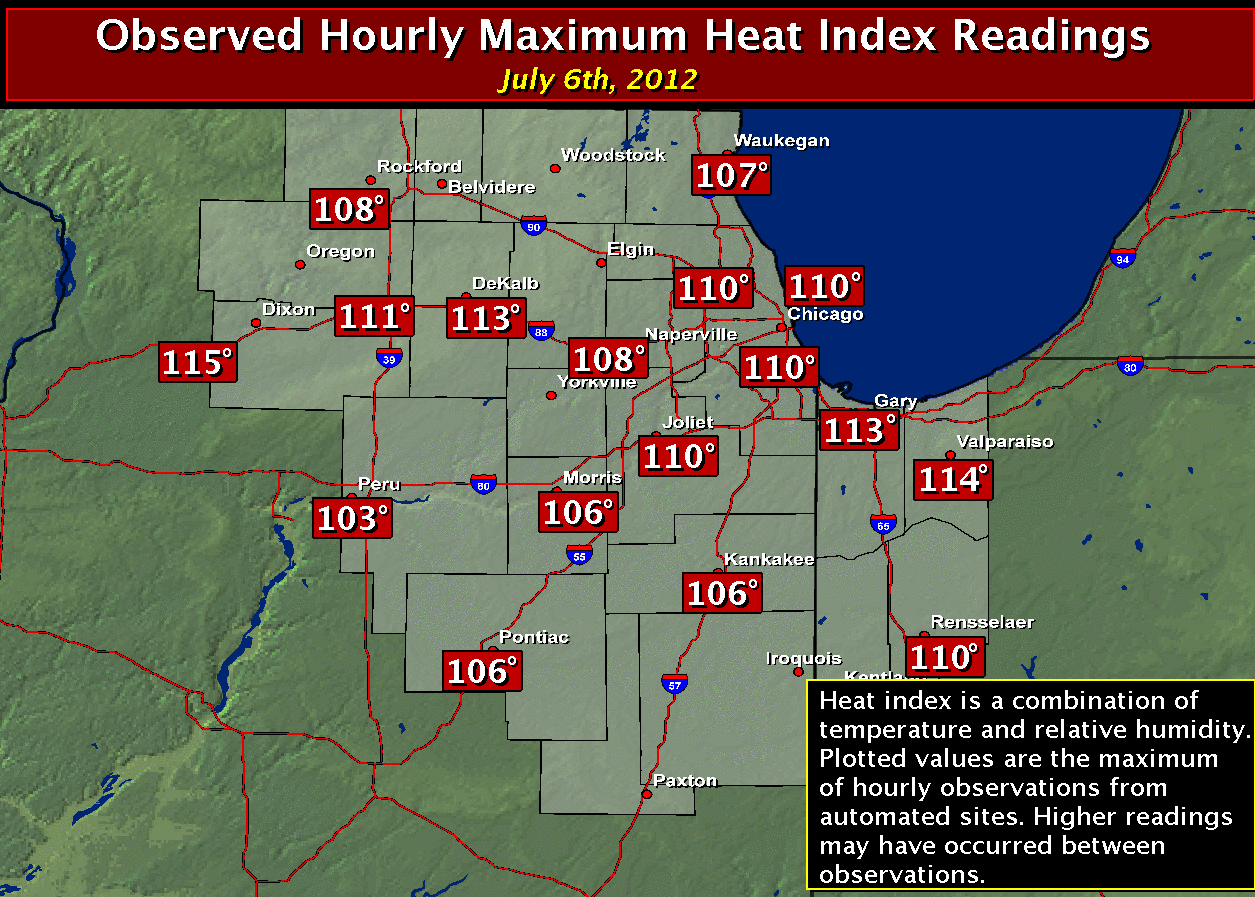
Below is a table showing the amount of daily, July, and all-time records broken in the first week of July 2012. These are for NWS ASOS and Cooperative Observer sites.
|
High Temperatures |
|||
|
July 4th |
July 5th |
July 6th |
July 7th |
|
|
|
|
 |
LOCATION TEMPERATURE DATE OBSERVATION TYPE
------------------------------------------------------------------
CHICAGO BOTANIC GARDENS 105 7TH COOP
CHICAGO MIDWAY 3SW 105 6TH COOP
CHICAGO NORTHERLY ISLAND 105 5TH HO83
ROCKFORD AIRPORT 105 7TH ASOS
OTTAWA 5 SW 104 7TH COOP
WAUKEGAN AIRPORT 104 4TH/5TH ASOS
WHEELING/CHI EXEC 104 6TH ASOS
AURORA 103 7TH COOP
CHICAGO OHARE 103 5TH/6TH ASOS
MORRIS 1 NW 103 7TH COOP
MUNDELEIN 4 WSW 103 5TH/6TH COOP
AURORA/SUGAR GROVE 102 7TH ASOS
ELGIN 102 6TH/7TH COOP
JOLIET 102 7TH AWOS
JOLIET BRANDON ROAD DAM 102 7TH COOP
MARSEILLES LOCK 102 7TH COOP
PONTIAC 102 7TH AWOS
DE KALB 101 7TH COOP
DRESDEN LOCK&DAM 101 5TH/7TH COOP
LANSING 101 6TH AWOS
MC HENRY-WG STRATTON L&D 101 5TH COOP
PERU 101 7TH AWOS
RENSSELAER IN 101 7TH COOP
WFO ROMEOVILLE 101 6TH/7TH NWS
DEKALB 100 7TH AWOS
DUPAGE AIRPORT 100 6TH/7TH ASOS
INDIANA DUNES 100 4TH/5TH COOP
MARENGO 100 5TH COOP
PARK FOREST 100 6TH COOP
PONTIAC 100 7TH COOP
VALPARAISO IN 100 5TH/6TH/7TH ASOS
BARRINGTON 3 SW 99 5TH/6TH COOP
DWIGHT 99 7TH COOP
KANKAKEE 99 7TH AWOS
ROCHELLE 99 7TH COOP
VALPARAISO 5 NNE IN 99 6TH COOP
MORRIS 98 7TH AWOS
ROCHELLE 98 7TH AWOS
RENSSELAER IN 97 6TH/7TH AWOS
Click for the Highest Temperature List and Day by Day Breakdown (pdf)
|
July 4th |
July 5th |
 |
|
|
July 6th |
July 7th |
 |
|
Chicago Record Highs Broken & Tied
A RECORD HIGH TEMPERATURE OF 102 DEGREES WAS TIED AT CHICAGO-OHARE
IL ON JULY 4TH. THIS TIED THE OLD RECORD OF 102 SET IN 1911.
A RECORD HIGH TEMPERATURE OF 103 DEGREES WAS SET AT CHICAGO-OHARE
IL ON JULY 5TH. THIS BREAKS THE OLD RECORD OF 102 SET IN 1911.
A RECORD HIGH TEMPERATURE OF 103 DEGREES WAS SET AT CHICAGO-OHARE
IL ON JULY 6TH. THIS BREAKS THE OLD RECORD OF 99 SET IN 1988.
Rockford Record Highs Broken & Tied
A RECORD HIGH TEMPERATURE OF 102 DEGREES WAS SET AT ROCKFORD IL
ON JULY 4TH. THIS BREAKS THE OLD RECORD OF 101 SET IN 1911.
A RECORD HIGH TEMPERATURE OF 102 DEGREES WAS SET AT ROCKFORD IL
ON JULY 5TH. THIS BREAKS THE OLD RECORD OF 100 SET IN 1911.
A RECORD HIGH TEMPERATURE OF 104 DEGREES WAS SET AT ROCKFORD IL
ON JULY 6TH. THIS BREAKS THE OLD RECORD OF 102 SET IN 1936.
A RECORD HIGH TEMPERATURE OF 105 DEGREES WAS TIED AT ROCKFORD IL
ON JULY 7TH. THIS TIES THE OLD RECORD OF 105 SET IN 1936.
|
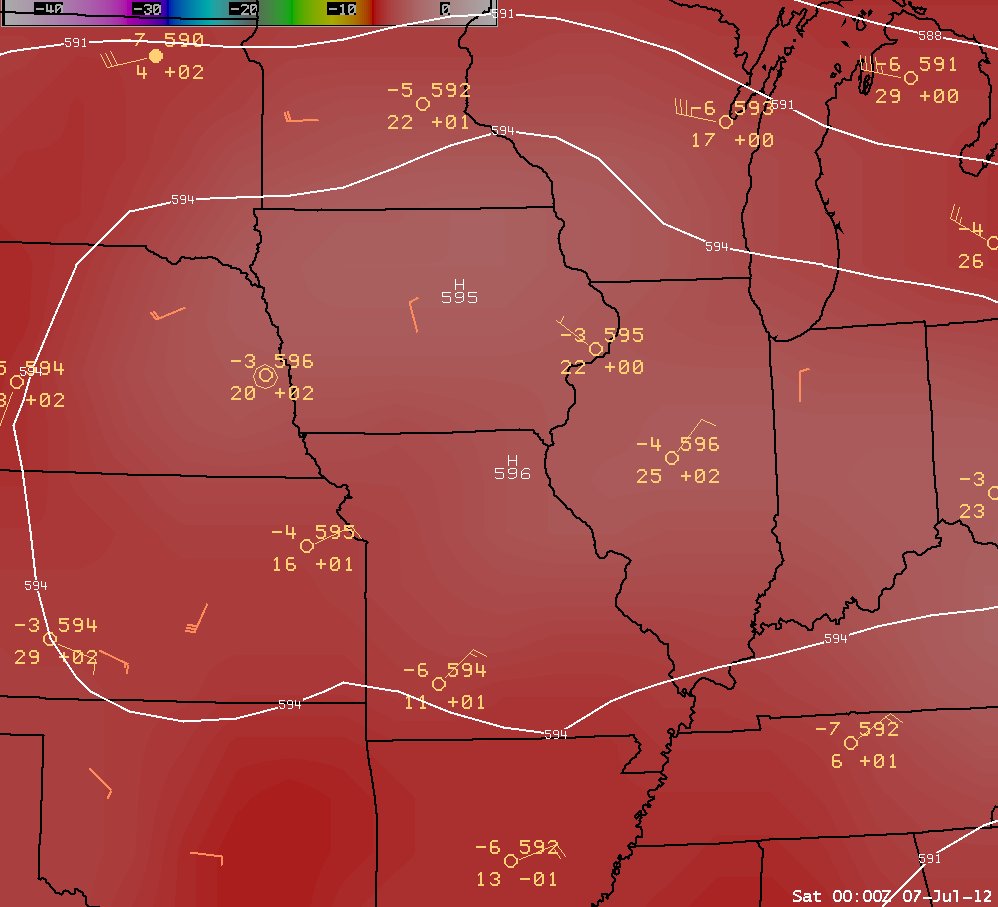
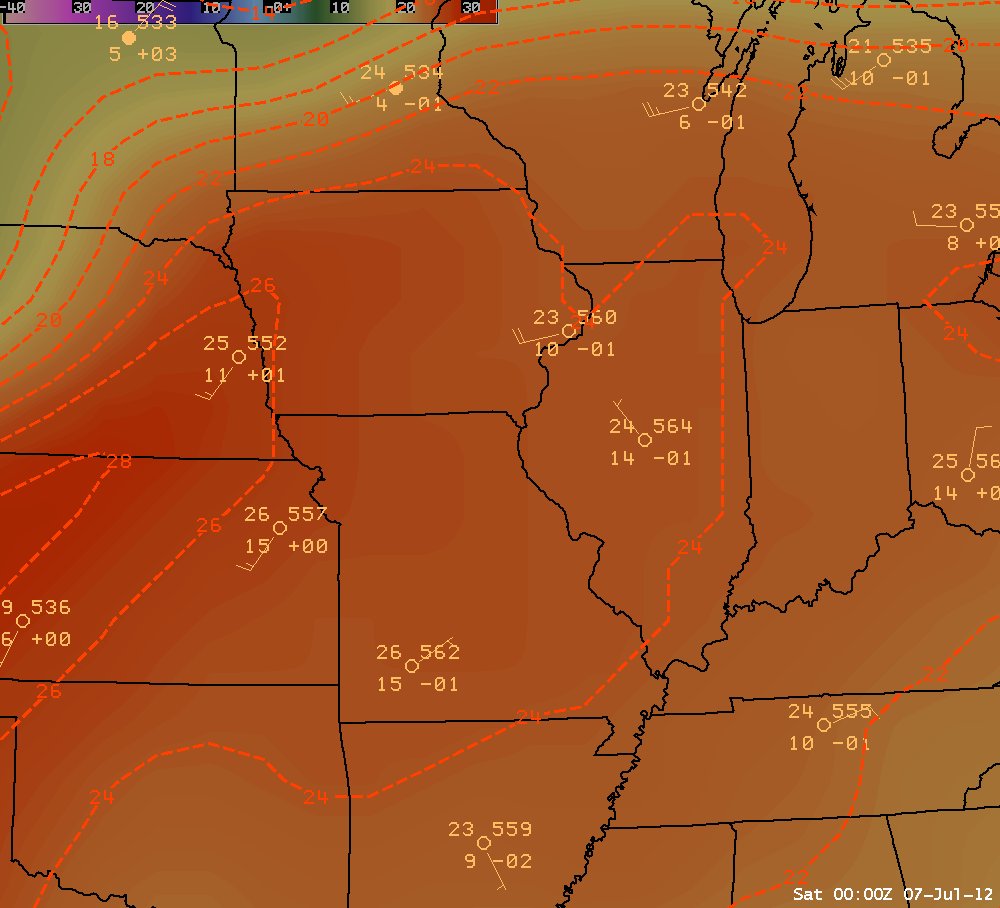
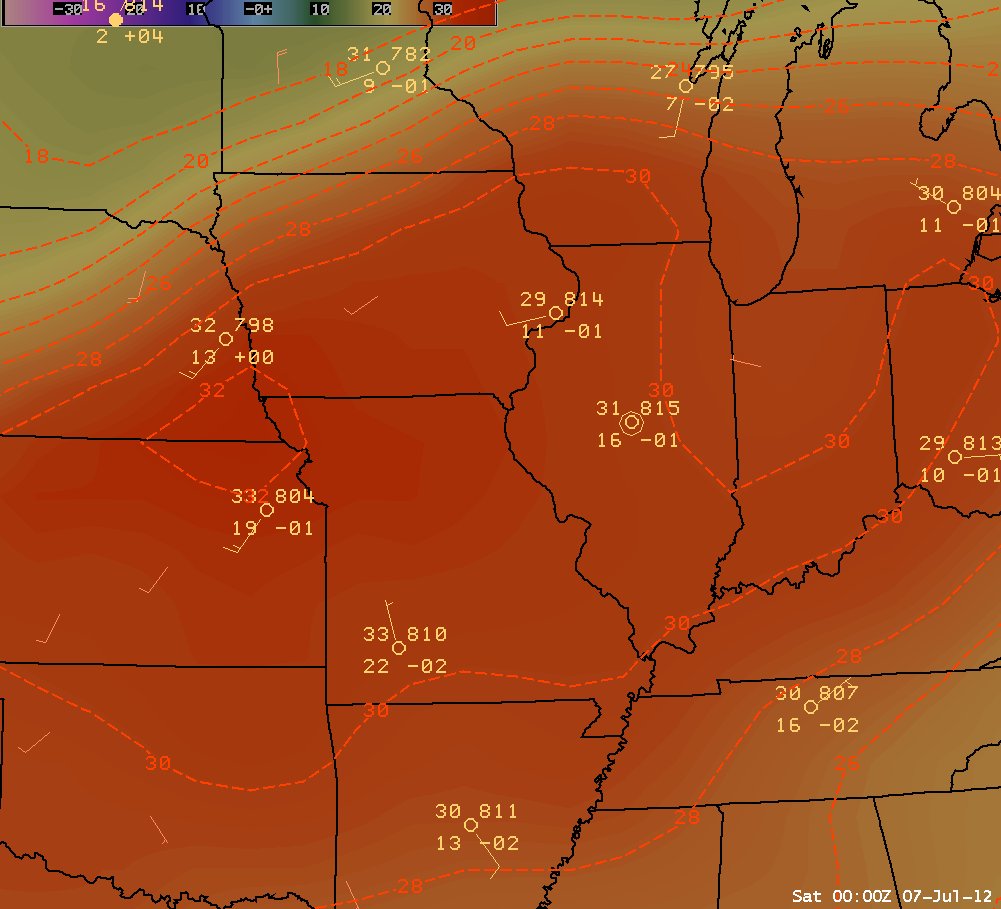
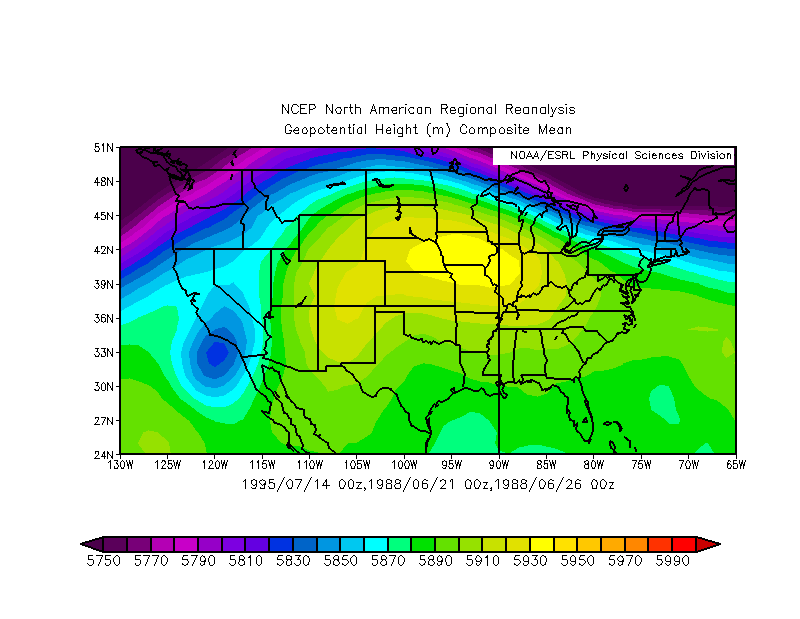
The heat wave of early July 2012 had several meteorological ingredients come together on large (synoptic) and local (meso) scales. For much of the spring into the early part of the summer, the jet stream has remained well to the north of the area. The first week of July was similar, but even more extreme with the upper level westerlies amplified and a deep ridge over the central U.S. under very light upper level winds. To the right is an image of the 500 mb height (~18,000 ft) anomalies. Note the well above normal heights associated with the central North American ridge. Height anomalies are not uncommon, but are usually most pronounced in the transition seasons of spring and autumn. To have such well above normal height anomalies in summer and over such a large area is quite rare. Above normal heights are almost always associated with warmer than normal temperatures in the atmosphere. In order for a heat wave to persist and be extreme at the surface, much of the lower atmosphere needs to be warmer than normal. NWS weather balloons observed such well above normal temperatures aloft, as the below upper air maps color contoured with temperatures show. These were from the evening balloon launch on July 6th. The -3°C observed at 500mb on the KDVN balloon launch that evening tied for the second warmest 500 mb reading with multiple other days from the period 1995 to present. |
|
|
500 mb |
850 mb |
925 mb |
|
|
|
|
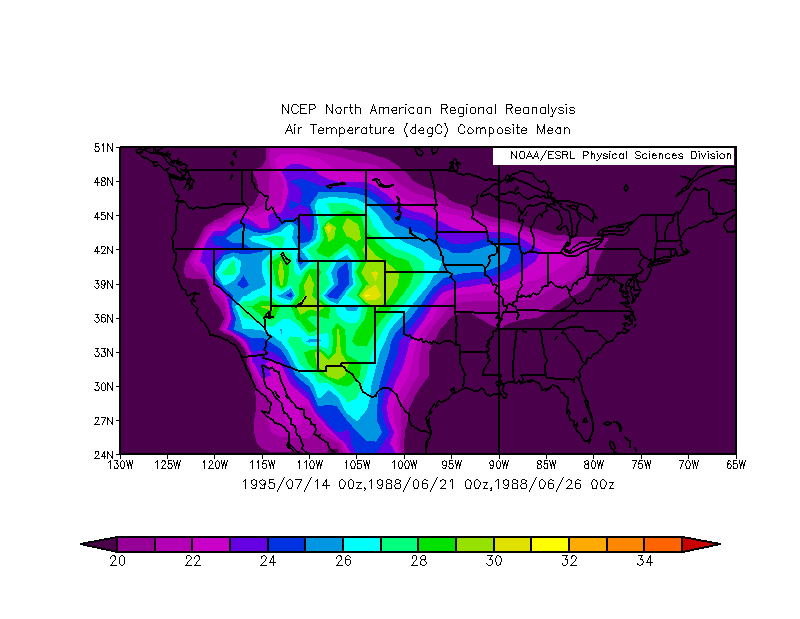
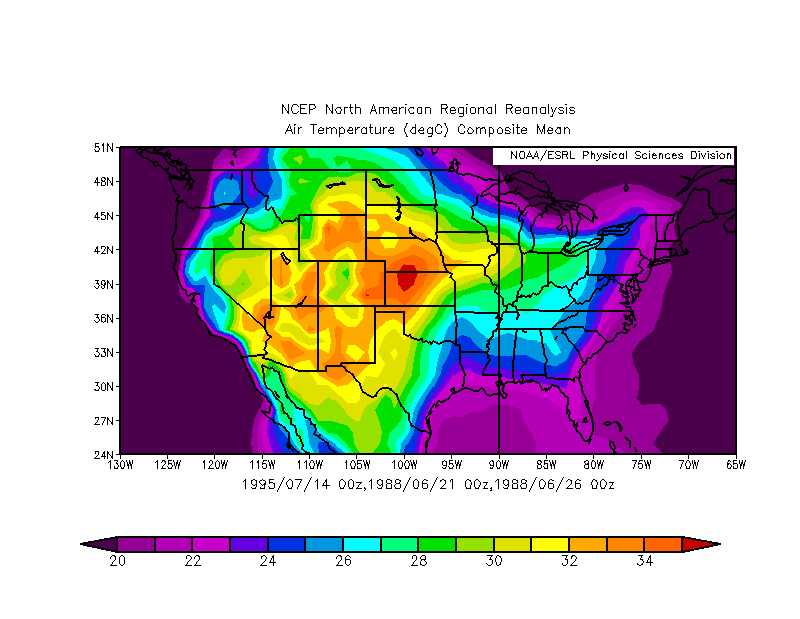
The below composite maps of temperatures at the same three pressure levels as above are averages from the only three other days where Chicago reached 103° since 1980. Note the similarities to the above maps, implying a similar very anomalous pattern.
|
500 mb |
850 mb |
925 mb |
|
|
|
|
|
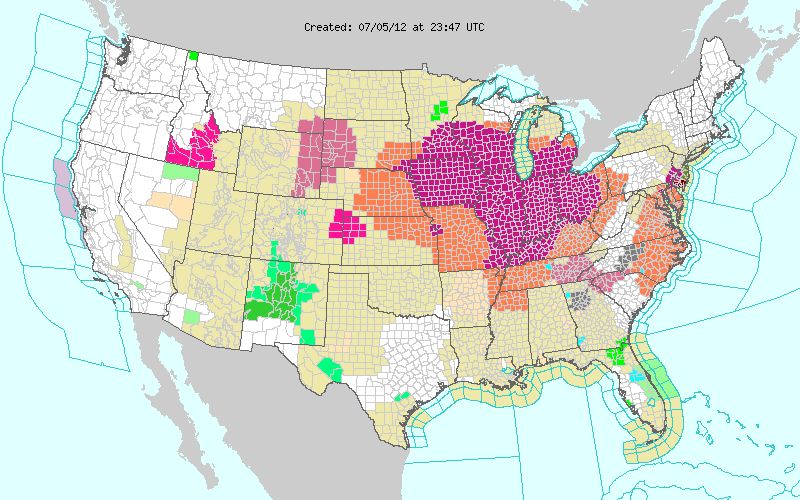
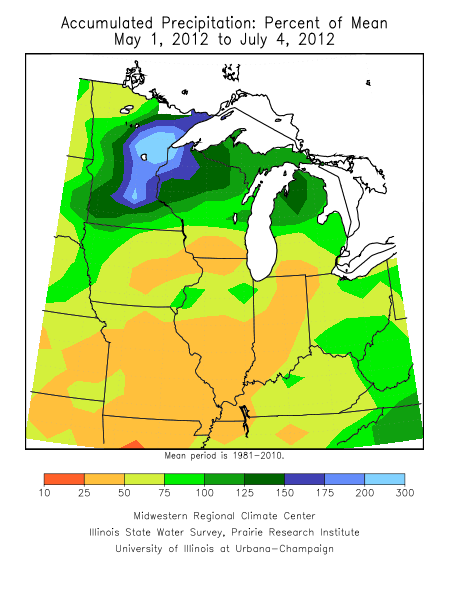
In many respects, the heat wave had begun before the month had started. June saw well above normal temperatures, including triple digits on the 28th. Prolonged warmth and dryness across the middle Mississippi Valley and lower Great Lakes regions leading up to this period had allowed for the already hot conditions to be further enhanced. A map of the dryness can be seen to the left. A dry and warm ground can be more readily heated by the sun than can a moist surface. This is one reason why Rockford and Waukegan were some of the warmer sites during the heat wave, as they had seen below half of their normal precipitation since May 1st. The prolonged warmth from the winter into the spring also allowed Lake Michigan to be well above normal (10-15°F), and minimized the influence of the lake breeze. For more on the warm Lake Michigan water, see this article. Many of the aforementioned parameters were taken into account in the forecast process by meteorologists. These include noting local effects, bias-correcting too cool model guidance, and simple recognition of a record pattern. The NWS had issued Excessive Heat Warnings and Heat Advisories across numerous states in the middle part of the country. The below national map from the evening of July 4th depicts the headlines in effect for the subsequent days, with the magenta indicating Excessive Heat Warnings and the orange depicting Heat Advisories. |