
Severe thunderstorms will remain possible in the Mid-Atlantic through Tuesday. Severe thunderstorms and heavy rain will also be possible in the central/southern Plains on Tuesday and Wednesday. Hazardous heat will linger across the southern U.S. and build across the West through mid-week. Hot and dry weather will create Elevated to Critical fire weather conditions in the Four Corners Region. Read More >
 |
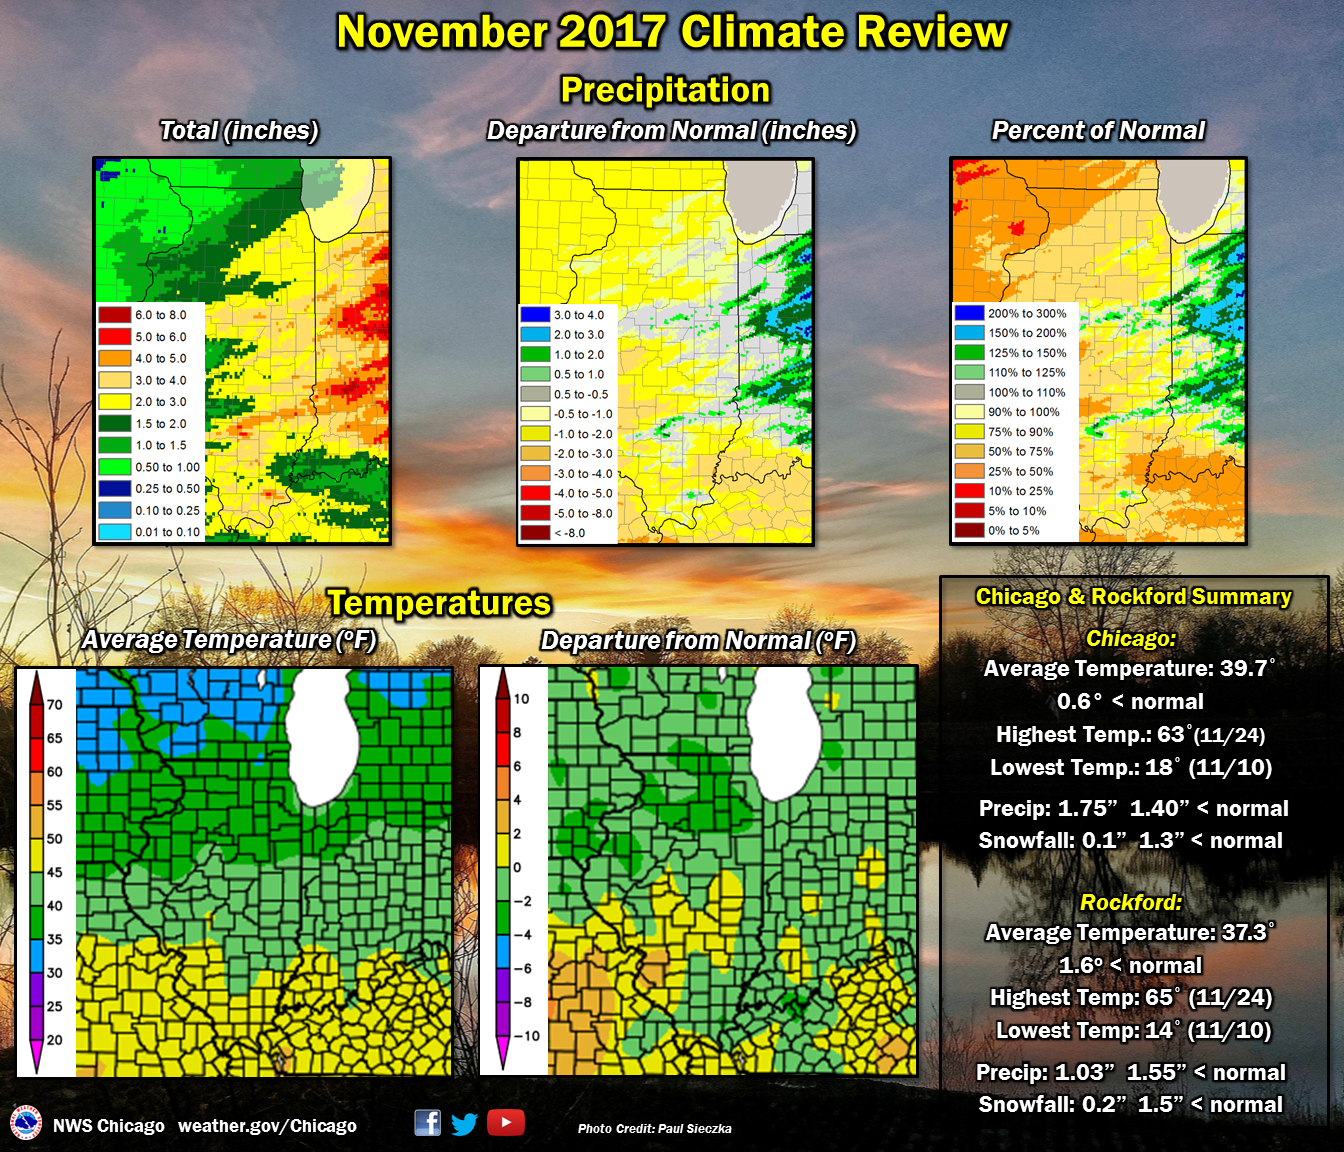 |
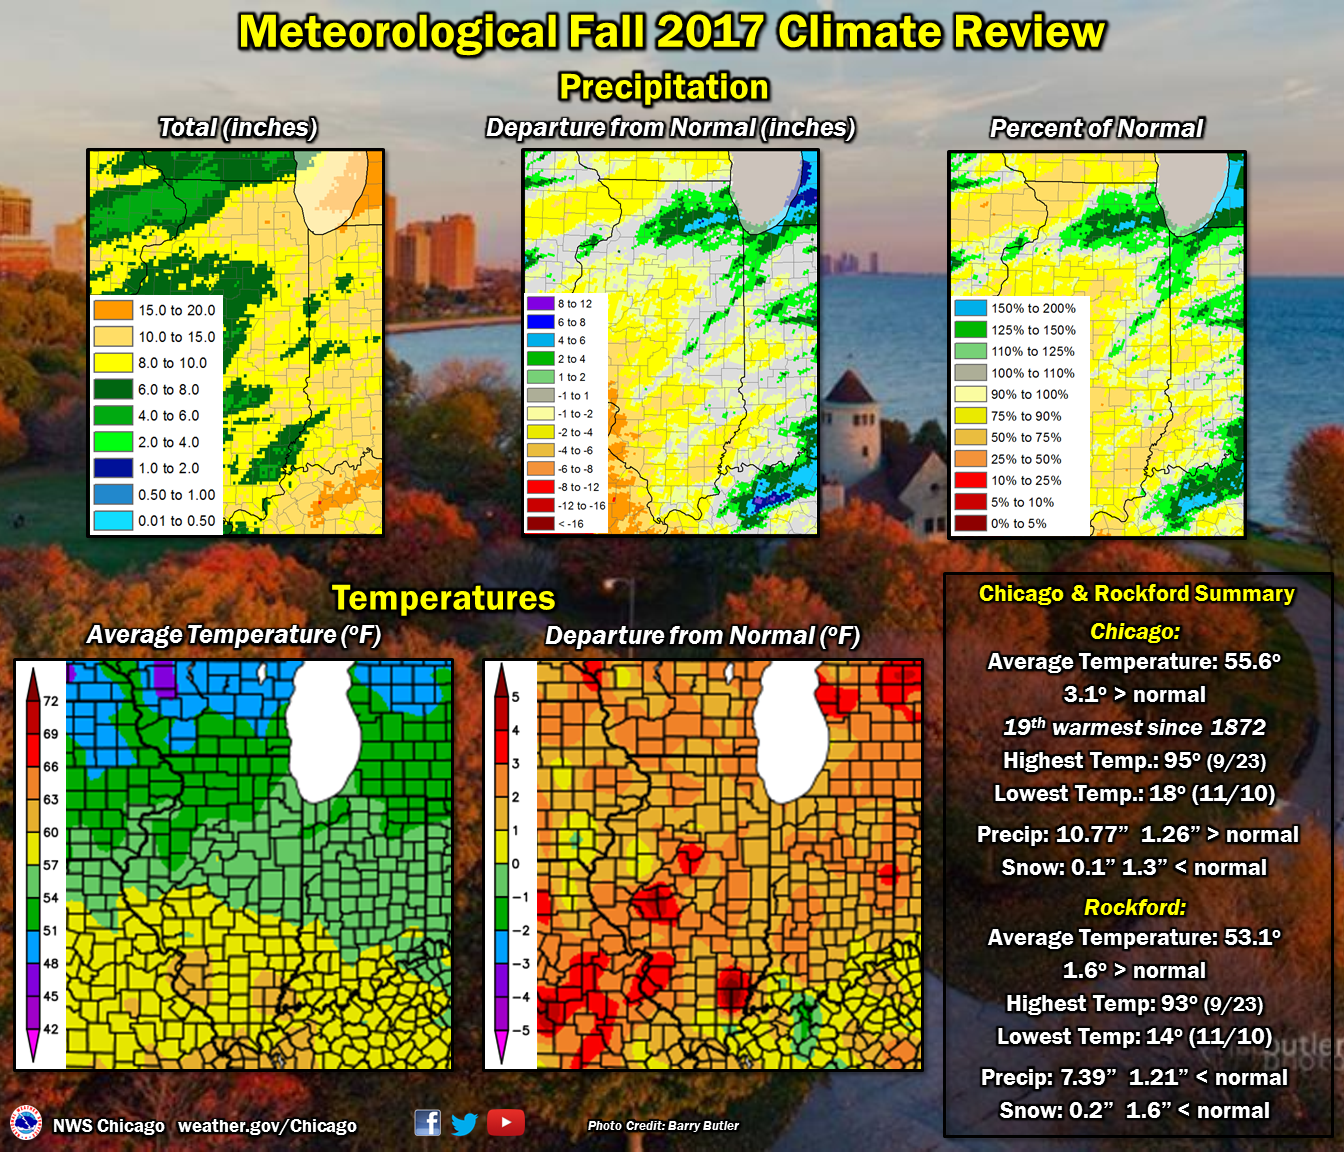
| Fall was warmer than average due to Sep.& Oct. Precipitation was variable, with dry Sep. & Nov. surrounding a wet Oct. | Nov. was near to below normal, with a cold first half & generally mild second half. Precipitation was below normal for most. |
Public Information Statemment
National Weather Service Chicago/Romeoville
1137 AM CST Fri Dec 01 2017

...A Look Back at the Climate for Meteorological Fall (September,
October, November) 2017 for Chicago and Rockford...

At Chicago, the average high temperature for the fall season was 64
degrees, which is 2.2 degrees above the 1981 to 2010 average. The
average low temperature was 47.1 degrees, which is 3.9 degrees above
normal. The mean temperature for the season was 55.6 degrees, which
is 3.1 degrees above normal.

A total of 10.77 inches of precipitation was recorded during this
past fall, which is 1.26 inches above normal. There was a total of
0.1 of an inch of snow recorded at Chicago, which is 1.3 inches
below normal.

Records established or tied during the fall months:

September:
* Record daily maximum temperature of 92 degrees on the 20th.
* Record daily maximum temperature of 94 degrees on the 21st.
* Record daily maximum temperature of 94 degrees on the 22nd.
* Record daily maximum temperature of 95 degrees on the 23rd.
* Record daily highest minimum temperature of 72 degrees on the
  23rd.
* Record daily maximum temperature of 93 degrees on the 24th.
* Record daily maximum temperature of 92 degrees on the 25th.
* Record daily maximum temperature of 92 degrees on the 26th.

October:
* Record daily rainfall of 4.19 inches on the 14th.
* This also set a record for most rainfall in a calendar day for any
  day in the month of October. The old record was 3.95 inches on
  October 3, 1954.

November:
* Record daily minimum temperature of 18 degrees on the 10th.

At Rockford, the average high temperature was 63.2 degrees, which is
1.3 degree above normal. The average low temperature was 43 degrees,
which is 1.9 degree above normal. The mean temperature for the
season was 53.1 degrees, which is 1.6 degrees above normal.

A total of 7.39 inches of precipitation was recorded during this
past fall, which was 1.21 inch below normal. In addition, a total of
0.2 inches of snow was recorded, which is 1.6 Inches below normal.

Records established or tied during the summer months:

September:
* Record daily highest minimum temperature of 67 degrees on the 22nd.
* Record daily maximum temperature of 93 degrees on the 23rd.
* Record daily highest minimum temperature of 66 degrees on the
  23rd.

October:
* Record daily rainfall of 1.8 inches on the 14th.

November:
* Record daily minimum temperature of 14 degrees on the 10th.
* Tied daily maximum temperature of 65 degrees on the 24th.
$$
Public Information Statement
National Weather Service Chicago/Romeoville
1047 AM CST Fri Dec 01 2017

...A Look Back at the Climate for the Month of November 2017 for
Chicago and Rockford...

At Chicago, the average high temperature was 46.9 degrees, which is
1.3 degrees below normal. The average low temperature was 32.5
degrees, which is 0.1 degree above normal. The average temperature
for the month was 39.7 degrees which is 0.6 degree below normal.
During the month of November, 1.75 inches of precipitation were
recorded, which is 1.40 inches below normal. 0.1 of an inch of snow
was recorded, which is 1.1 inch below normal.

One record was set for Chicago for the month of November 2017:
* Tied daily minimum temperature of 18 degrees on the 10th.

At Rockford, the average high temperature was 45.9 degrees, which is
1.7 degrees below normal. The average low temperature was 28.7
degrees, which is 1.6 degrees below normal. The average temperature
for the month was 37.3 degrees, which is 1.6 degrees below normal.
During the month of November, 1.30 inches of precipitation were
recorded, which is 1.55 inches below normal. 0.2 of an inch of snow
was recorded, which is 1.5 inches below normal.

There were 2 records for Rockford for the month of November 2017:
* Record daily minimum temperature of 14 degrees on the 10th.
* Tied daily maximum temperature of 65 degrees on the 24th.

$$

