This page presents a 75-year climatology of severe weather reports in the NWS Chicago forecast area broken down by hazard (Tornadoes, Damaging Winds, Damaging Hail, and Marine Thunderstorm Hazards) and county. All statistics were derived by collecting and analyzing certified storm reports in NOAA's StormData publication for all counties currently being served by NWS Chicago. Edits were made to a small number of reports owing to known data quality problems within StormData.
Total Number of Reports:
1950 - 2024
| Number of Reports | Significant Reports | Non-Significant Reports | |
| Any Report | 8881 | 991 | 7860 |
| Tornado | 801 | 144 | 657 |
| Damaging Wind |
5974 |
734 | 5240 |
| Damaging Hail | 2106 | 143 | 1963 |
Page last updated: May 24, 2025
Period of record: 1950 - 2024
Find any errors or have questions? Email nws.chicago@noaa.gov
Tornadoes
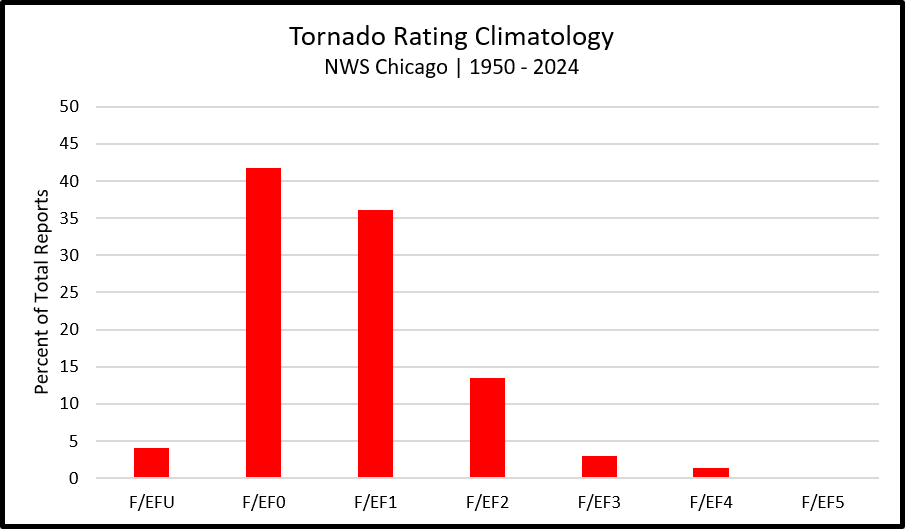
Tornado Report Climatology:
 |
 |
Tornadoes by Rating:
| Rating | Number of Tornadoes | Percent of Total |
| F/EF-U | 33 | 4.1% |
| F/EF-0 | 335 | 41.8% |
| F/EF-1 | 289 | 36.1% |
| F/EF-2 | 108 | 13.5% |
| F/EF-3 | 24 | 3.0% |
| F/EF-4 | 11 | 1.4% |
| F/EF-5 | 1 | 0.1% |
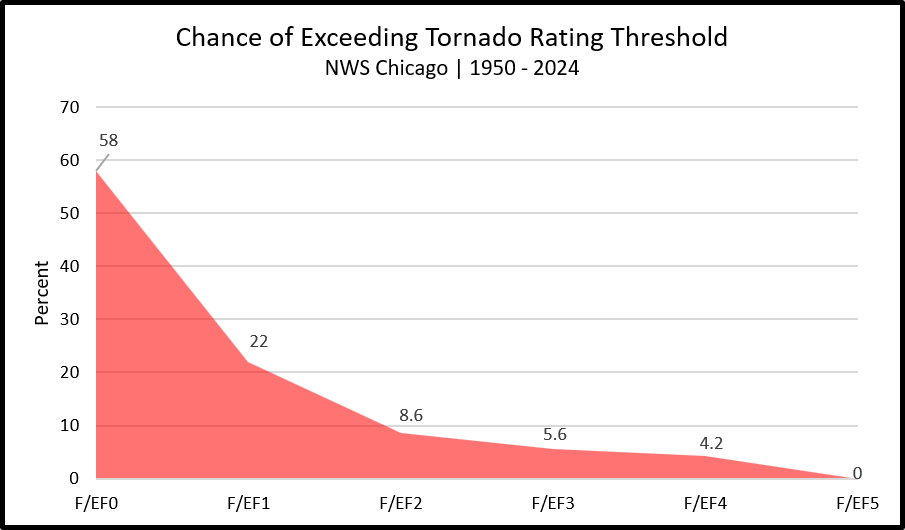
Insights:
Four out of five tornadoes (~82%) in our area have a rating of F/EF-U, F/EF-0 or F/EF-1, which are classified as non-significant. Hence, the chance that any given tornado report is an EF-2 or greater is only about 20%.
The chance that any given tornado report is rated an F/EF-3 or greater is only about 4.5% (Roughly 1 in 20).
There has been only one F/EF-5 rating in our area -- the August 30, 1990 Plainfield Tornado. We're glad there haven't been more.
Tornado Statistics by Rating from 1950 to 2024 (75 years)
| Maximum F/EF Rating | Count | Median Path Length | Median Path Width | Injuries | Fatalities |
| F/EF-0 | 335 | 0.57 miles | 50 yards | 8 (0.3%) | 0 (0.0%) |
| F/EF-1 | 289 | 1.66 miles | 90 yards | 94 (3.6%) | 3 (2.3%) |
| F/EF-2 | 107 | 2.00 miles | 77 yards | 467 (18.1%) | 9 (6.8%) |
| F/EF-3 | 24 | 11.75 miles | 233 yards | 132 (5.1%) | 5 (3.8%) |
| F/EF-4 | 11 | 5.97 miles | 310 yards | 1535 (59.4%) | 87 (65.4%) |
| F/EF-5 | 1 | 16.40 miles | 600 yards | 350 (13.5%) | 29 (21.8%) |
| Weak (F/EF-0, F/EF-1) | 624 | 1.00 miles | 50 yards | 102 (3.9%) | 3 (2.3%) |
| Strong (F/EF-2, F/EF-3) | 131 | 5.00 miles | 75 yards | 599 (23.1%) | 14 (10.5%) |
| Violent (F/EF-4, F/EF-5) | 12 | 15.07 miles | 310 yards | 1885 (72.9%) | 116 (87.2%) |
| All Tornadoes | 767* | 1.30 miles | 50 yards | 2586 (100%) | 133 (100%) |
*This table excludes EF-U tornadoes
Damaging Winds
Damaging Wind Reports are initially cataloged into two categories: Thunderstorm Wind Gust and Thunderstorm Wind Damage. The Thunderstorm Wind Gust category is used in instances where a measured wind gust greater than 50 knots (58 mph) is reported. Meanwhile, the much more common Thunderstorm Wind Damage category is used in instances where damage due to damaging winds are reported without a measurement of a wind gust (e.g., downed tree limbs). When the data are certified in NOAA's StormData publication, both categories are combined. For Thunderstorm Wind Damage reports, a wind speed is estimated based on the description of the damage. The climatology below does not include measured thunderstorm wind gust reports from marine platforms.
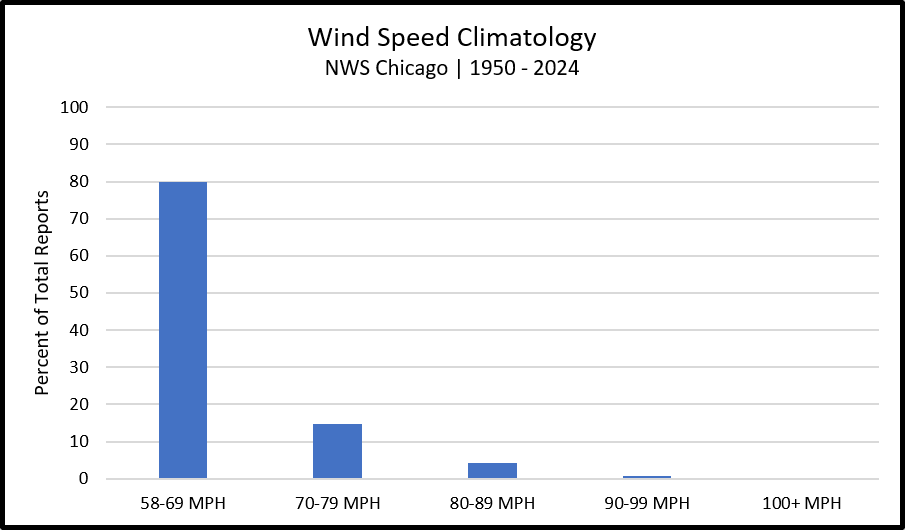
Damaging Wind Report Climatology:
 |
 |
| Wind Speed | Number of Reports | Percent of Reports |
| 58-69 mph | 4478 | 80% |
| 70-79 mph | 879 | 14.7% |
| 80-89 mph | 254 | 4.3% |
| 90-99 mph | 45 | 0.8% |
| 100+ mph | 18 | 0.3% |
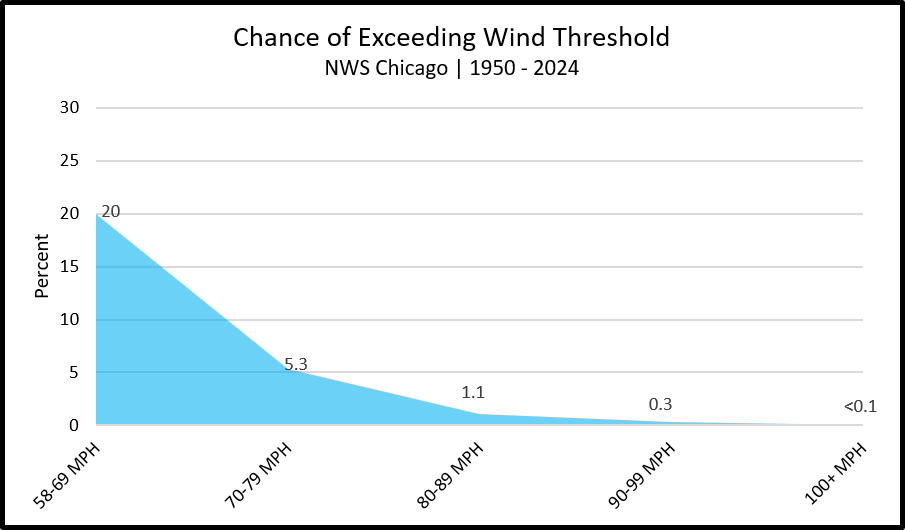
Insights:
Four in five (~80%) damaging wind reports are associated with wind speeds less than 70 mph, while only about 5% are associated with wind speeds greater than 80 mph.
Reports with wind speeds greater than 100 mph are relatively rare (0.3%, or about 1 in 250 reports).
The highest estimated wind speed report in our area is listed as 130 mph which occurred on June 29, 1990, when a microburst impacted Streamwood in northwestern Cook County. One person lost their life in that storm. We believe the wind speed assigned at the time was based on the original Fujita Scale, which overestimated wind speeds. (Local news clip)
The highest measured wind speed report in our area is listed as 104 mph which was measured on July 5, 2003, in Pecatonica as a derecho raced through northern Illinois.
Maximum Measured Wind Gust by County from 1950 to 2024 (75 years):
The table below lists the highest measured thunderstorm wind gusts within StormData across the NWS Chicago CWA. Data come from a variety of sources including but not limited to ASOS/AWOS stations, mesonets, hand-held anemometers, and personal weather stations -- all of which may vary in calibration. In addition, it is possible (if not likely) that higher wind gusts have occurred in each of the counties listed below but were either not measured and/or reported to the NWS.
| County Name | Maximum Measured Wind Gust | Date |
| Winnebago, IL | 104 mph | 7/5/2003 |
| Boone, IL | 85 mph | 4/4/2023 |
| McHenry, IL | 75 mph | 5/20/2012 |
| Lake, IL | 81 mph | 7/28/2024 |
| Ogle, IL | 73 mph | 7/28/2023 |
| Lee, IL | 92 mph | 8/10/2020 |
| De Kalb, IL | 75 mph | 3/31/2023 |
| Kane, IL | 86 mph | 5/12/2004 |
| DuPage, IL | 82 mph | 7/1/2012 |
| Cook, IL | 85 mph | 8/10/2020 |
| La Salle, IL | 91 mph | 8/10/2020 |
| Kendall, IL | 92 mph | 6/29/2012 |
| Grundy, IL | 81 mph | 7/28/2023 |
| Will, IL | 88 mph | 6/29/2011 |
| Livingston, IL | 71 mph | 6/21/2011 |
| Ford, IL | 81 mph | 5/23/2019 |
| Iroquois, IL | 84 mph | 5/31/2013 |
| Kankakee, IL | 74 mph | 6/30/2019 |
| Lake, IN | 96 mph | 8/2/2011 |
| Porter, IN | 81 mph | 11/17/2013 |
| Newton, IN | 73 mph | 5/25/2022 |
| Jasper, IN | 86 mph |
6/4/2011 |
| Benton, IN | 86 mph | 7/19/2020 |
Maximum Measured Wind Gust by ASOS/AWOS Station 1950 to 2024 (75 years):
The table below lists the highest measured thunderstorm wind gusts at each individual ASOS/AWOS station across the NWS Chicago forecast area that was listed within StormData. It is possible that higher thunderstorm wind gusts have occurred but were failed to be documented (submitted to StormData) at each of the stations listed below. Note that the period of record varies by station.
| Station ID | Maximum Measured Wind Gust | Date(s) |
| Rockford Airport ASOS (RFD) | 81 mph (70 kt) | 3/5/2022 |
| Aurora Municipal Airport ASOS (ARR) | 79 mph (69 kt) | 11/10/2020 |
| DuPage County Airport ASOS (DPA) | 77 mph (67 kt) | 4/20/2023, 11/5/2022 |
| Chicago O'Hare ASOS (ORD) | 84 mph (73 kt) | 6/13/2022 |
| Chicago Midway ASOS (MDW) | 72 mph (63 kt) | 8/10/2020, 6/23/2010 |
| Waukegan Airport ASOS (UGN) | 66 mph (57 kt) | 7/1/2018 |
| Valparaiso Airport ASOS (VPZ) | 79 mph (69 kt) | 9/20/2014 |
| Chicago Executive Airport ASOS (PWK) | 81 mph (70 kt) | 6/21/2011 |
| Gary Municipal Airport AWOS (GYY) | 96 mph (83 kt) | 8/2/2011 |
| Peru / Illinois Valley Regional Airport AWOS (VYS) | 75 mph (65 kt) | 6/21/2011 |
| DeKalb Municipal Airport AWOS (DKB) | 74 mph (64 kt) | 6/28/2008 |
| Rochelle Municipal Airport AWOS (RPJ) | 67 mph (58 kt) | 8/2/2011 |
| Rensselaer Jasper Airport AWOS (RPJ) | 67 mph (58kt) | 8/2/2011 |
| Pontiac AWOS (PNT) | 68 mph (59 kt) | 6/22/2016 |
| Kankakee Airport AWOS (IKK) | 64 mph (56 kt) | 5/9/2018 |
| Morris Municipal Airport AWOS (C09) | 71 mph (62 kt) | 6/26/2020 |
| Lockport Lewis Airport AWOS (LOT) | 66 mph (57 kt) | 6/21/2011 |
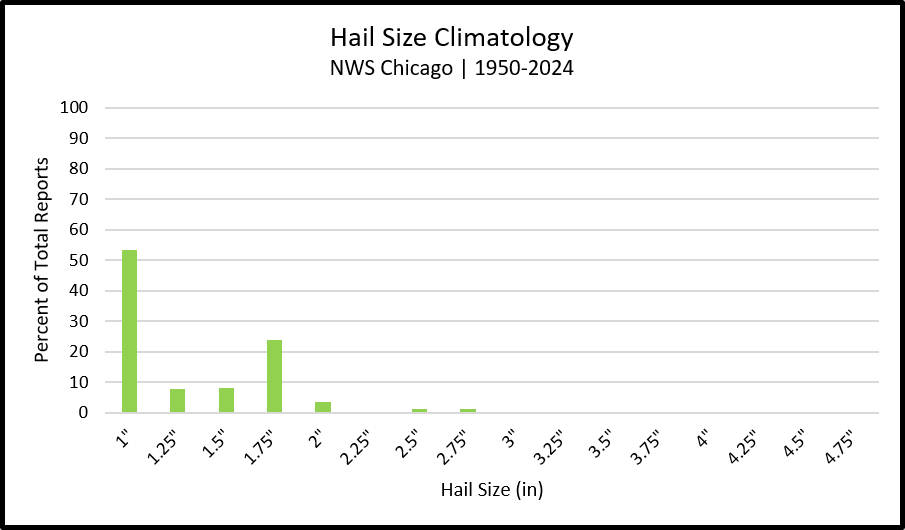
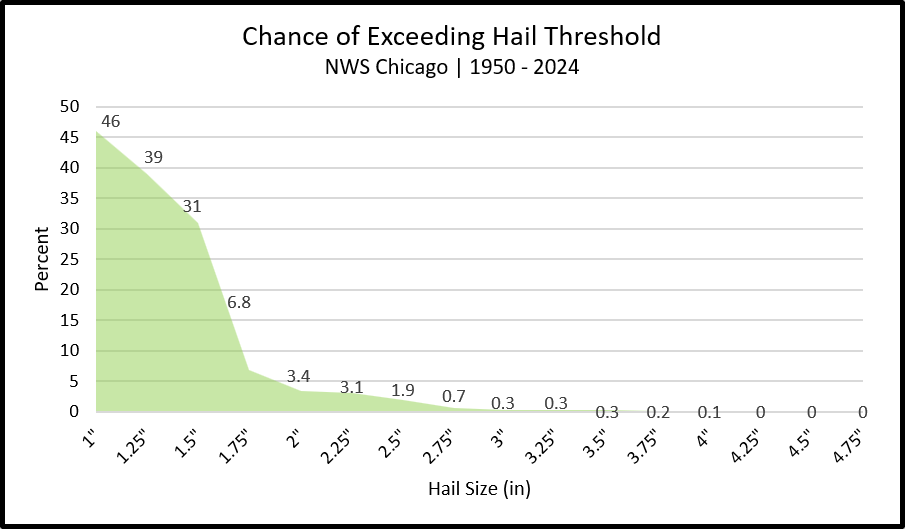
Damaging Hail
Damaging Hail Report Climatology from 1950 to 2024 (75 years):
 |
 |
|
|
Maximum Hail Size by County from 1950 to 2024 (75 years):
The table below lists the largest reported hail within StormData across the NWS Chicago CWA. It is possible (if not likely) that larger hailstones have occurred in each of the counties listed below, but were not reported to the NWS.
| County Name | Maximum Hail Size | Date(s) |
| Winnebago, IL | 3.00" | 4/7/2020, 5/2/2018, 6/7/1980 |
| Boone, IL | 2.00" | 4/12/2014 |
| McHenry, IL | 2.75" | 5/2/2018, 7/20/2013 |
| Lake, IL | 2.75" | 7/18/1967 |
| Ogle, IL | 3.00" | 9/21/1973 |
| Lee, IL | 4.00" | 7/13/2004 |
| De Kalb, IL | 2.75" | 4/4/2023 |
| Kane, IL | 2.75" | 5/12/1998 |
| DuPage, IL | 2.50" | 2/27/2024 |
| Cook, IL | 2.75" | 4/7/2020, 6/30/2011, 4/5/2010, 5/18/2000 |
| La Salle, IL | 3.75" | 7/13/2015 |
| Kendall, IL | 4.75"* | 6/10/2015 |
| Grundy, IL | 2.75" | 6/10/2015 |
| Will, IL | 3.00" | 4/23/1961 |
| Livingston, IL | 3.00" | 4/19/1996 |
| Ford, IL | 2.50" | 6/20/1981 |
| Iroquois, IL | 3.00" | 6/7/1980 |
| Kankakee, IL | 4.00" | 6/8/1981 |
| Lake, IN | 2.75" | 7/13/2015 |
| Porter, IN | 2.00" | 5/5/1997 |
| Newton, IN | 2.75" | 8/9/2012 |
| Jasper, IN | 1.75" |
8/9/2012, 6/22/2008, 4/14/2006, 7/21/203, 7/4/2003, 7/7/1991, 8/28/1990, 5/15/1988, 6/2/1987, 8/6/1985, 5/12/1970 |
| Benton, IN | 4.25" | 6/14/2010 |
* The 4.75" hail stone that fell near Minooka, IL on 6/10/2015 is the current record for the largest hailstone ever reported in the state of Illinois.
Lake Michigan Hazards
The National Weather Services issues Special Marine Warnings (the equivalent of Severe Thunderstorm Warnings) for thunderstorms for the southwestern portion of Lake Michigan anytime one or more of the following criteria are met:
Verifying Special Marine Warnings is more difficult than land-based warnings, as there are fewer observation platforms over the nearshore and open water zones of Lake Michigan. A majority of reports are for damaging winds either measured by shoreline observation platforms (mesonets on piers and lighthouses) and buoys. Waterspouts are most often sighted from shore. There are very few observations of damaging hail over the nearshore or open waters of Lake Michigan. Here is a breakdown of all reports from 2001-2024:
| Hazard |
Damaging Winds (>33kt) |
Waterspouts |
Damaging Hail (>0.75" in diameter) |
| Number of Reports | 586 | 64 | 586 |
Hazard Breakdown:
|
(click on image to make larger) |
(click on image to make larger) |
|
(click on image to make larger) |
(click on image to make larger) |
Much like the severe weather season over land, severe weather is most likely on the southwestern portion of Lake Michigan during the warm season months from May through September. The severe weather season is dominated by damaging wind events, which are most likely from May through August. Waterspouts typically occur in the fall, with more than half of all reports occurring in September, alone. Finally, reports of damaging hail are rare over southwestern Lake Michigan, though it has been reported during the late summer to early fall months.
Marine Damaging Winds Breakdown:
Maximum Measured Wind Gust by Marine Platform or Buoy (2001-2024):
| Location | Wind Gust | Date(s) |
| Chicago Harrison-Dever Crib | 96 mph (83 kt) | 8/4/2008, 7/5/2012 |
| Michigan City C-MAN Station | 106 mph (92 kt) | 8/23/2006 |
| Montrose Harbor - Chicago | 81 mph (70 kt) | 8/10/2020 |
| Northerly Island | 60 mph (52 kt) | 6/2/2014 |
| Waukegon Harbor | 94 mph (82 kt) | 6/30/2011 |
| Winthrop Harbor | 75 mph (65 kt) | 6/30/2011 |
| Indiana Harbor | 81 mph (70 kt) | 6/8/2008 |
| Calumet Harbor | 62 mph (54 kt) | 11/11/2015 |
| Burns Harbor | 66 mph (57 kt) | 6/19/2009 |
| Chicago Buoy | 49 mph (43 kt) | 7/14/2023 |
| Michigan City Buoy | 56 mph (49 kt) | 7/15/2024 |
| Wilmette Buoy | 54 mph (47 kt) | 9/7/2021 |
 |
Media use of NWS Web News Stories is encouraged! Please acknowledge the NWS as the source of any news information accessed from this site. Additional recaps can be found on the NWS Chicago Past Events Page |
|


