Numerous severe thunderstorms are expected across a broad region from the Ohio Valley to the Mid-Atlantic and Northeast States today into tonight. Swaths of damaging wind gusts are expected and some tornadoes are possible. Bertha is expected to bring tropical storm conditions to portions of the Gulf Coast from the Florida Panhandle westward to southeastern Louisiana later today and Wednesday. Read More >
| New Year's Day Weather for Northern Illinois: Statistics for Chicago and Rockford
Rockford: The following statistics comprises 112 years of data. Data collection for Rockford was at the Greater Rockford Airport.
 |
||||||||
|
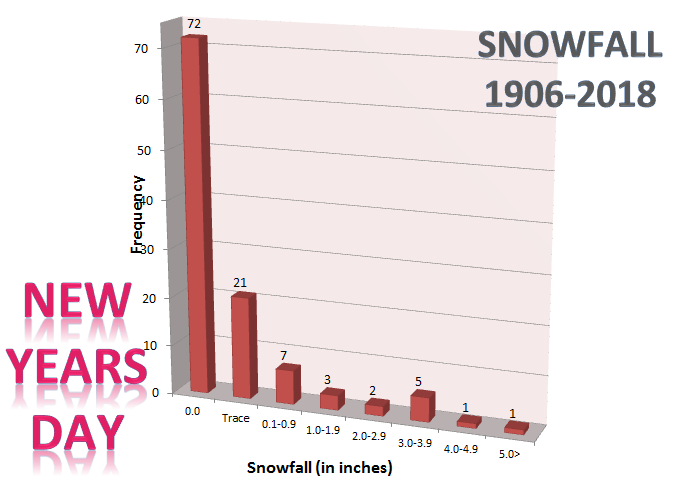
Frequency distribution of snowfall for Rockford. This dataset shows that the most frequent amount of snowfall recorded on New Year’s Day is 0.0”, which accounts for 64% of the days in the dataset. The next most frequent range is a trace. The highest amount of snow that has fallen on New Year’s Day is 9.0” in 1942. In 2018, no snow fell. |
||||||||
|
MAX TEMP |
MIN TEMP WARMEST |
PCPN WETTEST |
SNOW MOST |
| 49 1916 |
40 1950 |
1.33 1948 |
5.0 1918 |
| 45 1950 * |
35 1965 * |
1.25 1891 |
4.6 1978 |
| 44 2007 |
34 1916 * |
0.94 1965 |
4.4 1948 |
| 43 2006 * |
33 1941 * |
0.70 1941 |
4.3 1985 |
| 42 2012 * |
31 1996 * |
0.68 1916 |
3.2 2014 |
| 41 2004 * |
30 1997 * |
0.61 1985 |
|
| 40 2005 * |
29 2006 * |
0.57 1892 |
|
| 39 2017 * |
28 2007 |
0.48 1890 |
|
| 38 1994 * |
27 2012 * |
0.47 1918 |
|
| 37 2011 * |
26 1951 |
0.44 1876 |
|
| MAX TEMP COLDEST |
MIN TEMP COLDEST |
PCPN DRIEST |
SNOW LEAST |
| -1 2018 |
-13 2018 * |
0.00 2018 * |
0.0 2018 * |
| 4 1974 |
-10 1974 * |
T 2016 * |
T 2016 * |
| 5 1969 * |
-8 1964 |
0.01 1997 * |
0.1 1967 * |
| 6 1988 |
-7 1979 |
0.02 1995 * |
0.2 1995 |
| 10 1928 |
-6 1978 |
0.03 2006 * |
0.3 1959 |
| 11 2010 * |
-5 1988 * |
0.04 1971 * |
|
| 13 1968 |
-3 1935 |
0.05 2008 * |
|
| 14 1957 |
-2 1977 * |
0.06 1911 |
|
| 15 1958 |
-1 2010 * |
0.08 2012 * |
|
| 16 2014 * |
1 2008 * |
0.09 1921 |
|
12/22/2018