
Strong to severe thunderstorms and heavy rain will impact portions of the central Plains into the Upper Midwest and the Mid-Atlantic through the weekend. A stretch of unusually hot and humid weather is expected across portions of the central U.S. and the Southeast beginning this weekend and continuing through next week. The heat may reach dangerous levels, particularly mid to late next week. Read More >
 |
 |
| Climate Maps are from the Midwest and Northeast Regional Climate Centers and Illinois State Water Survey |
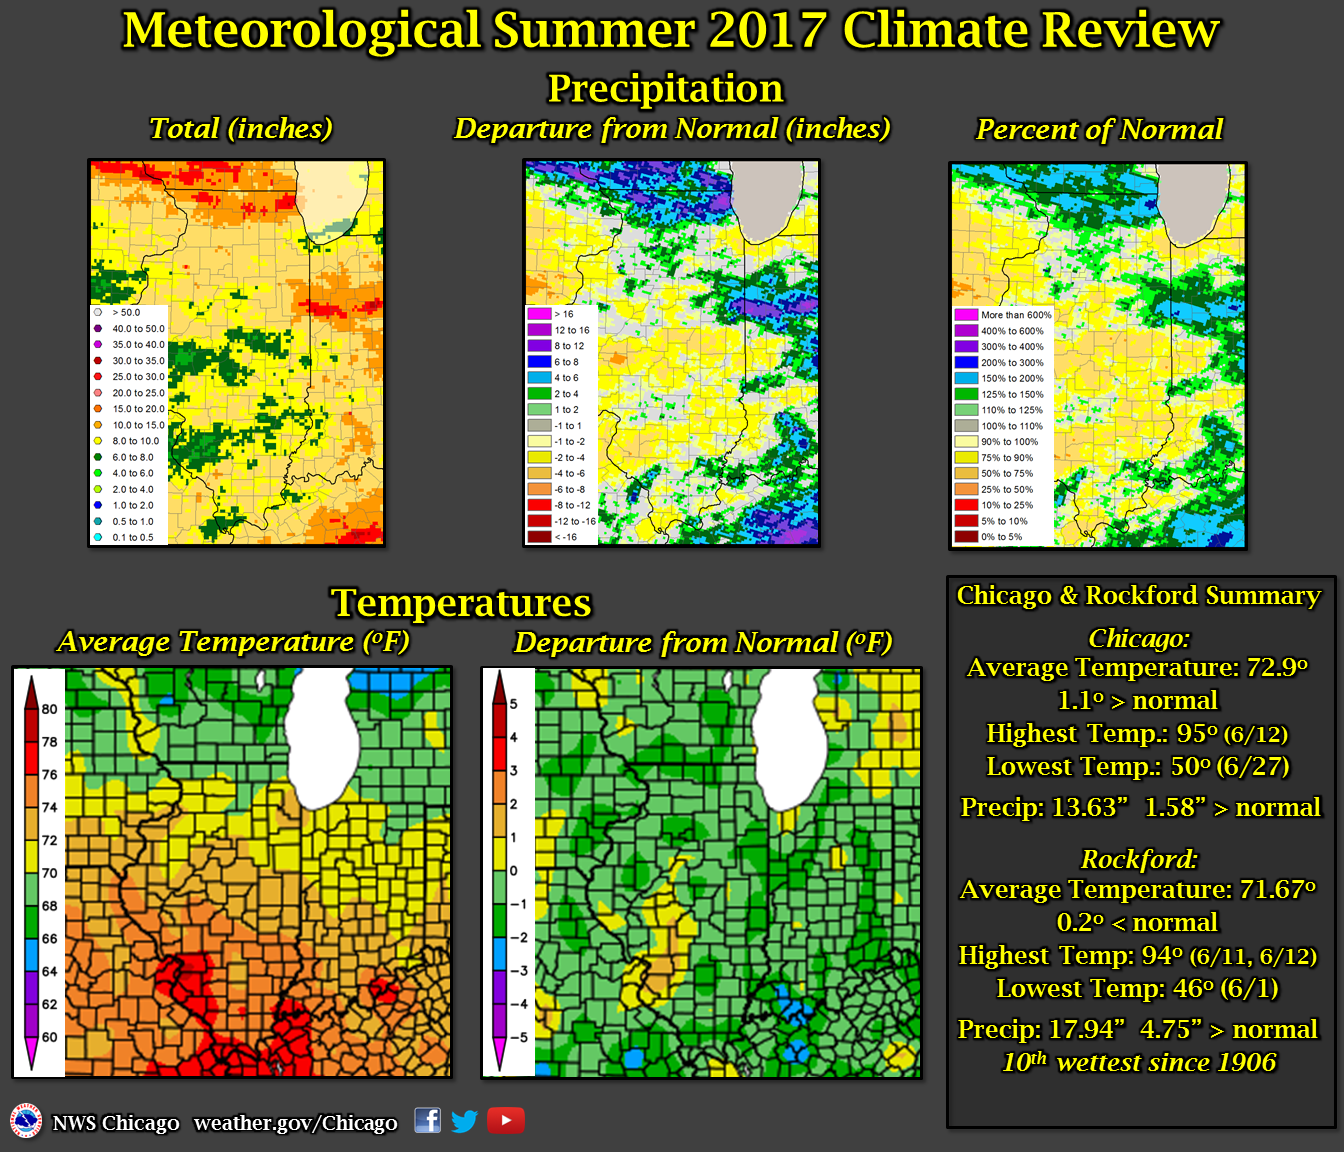
Public Information Statement
National Weather Service Chicago IL
754 AM CDT Fri Sep 1 2017 /854 AM EDT Fri Sep 1 2017/

...A Look Back at the Climate for Meteorological Summer (June, July,
August) 2017 for Chicago and Rockford...

At Chicago, the average high temperature for the summer season was
82.6 degrees, which is 0.7 degrees above the 1981 to 2010
average. The average low temperature was 63.1 degrees, which is
1.4 degrees above normal. The mean temperature for the season was
72.9 degrees, which is 1.1 degrees above normal. A total of 13.63
inches of precipitation was recorded during this past summer,
which is 1.58 inches above normal.

Records established or tied during the summer months:

June: Record daily precipitation of 1.30 inches on the 28th.

July: None.

August: None.


At Rockford, the average high temperature was 82.5 degrees, which
is 0.2 degree below normal. The average low temperature was 60.7
degrees, which is 0.3 degrees below normal. The mean temperature
for the season was 71.6 degrees, which is 0.2 degrees below
normal. A total of 17.94 inches of precipitation was recorded
during this past summer, which was 4.75 inches above normal.

Records established or tied during the summer months:

June:
* Daily highest minimum temperature of 73 degrees on the 11th.
* Daily highest minimum temperature of 72 degrees on the 12th.
* Daily precipitation of 4.11 inches on the 28th.

July:
* Daily precipitation of 2.45 inches on the 20th.

August: None.

Summer:
* 10th wettest summer on record since 1906 with 17.94 inches.

$$
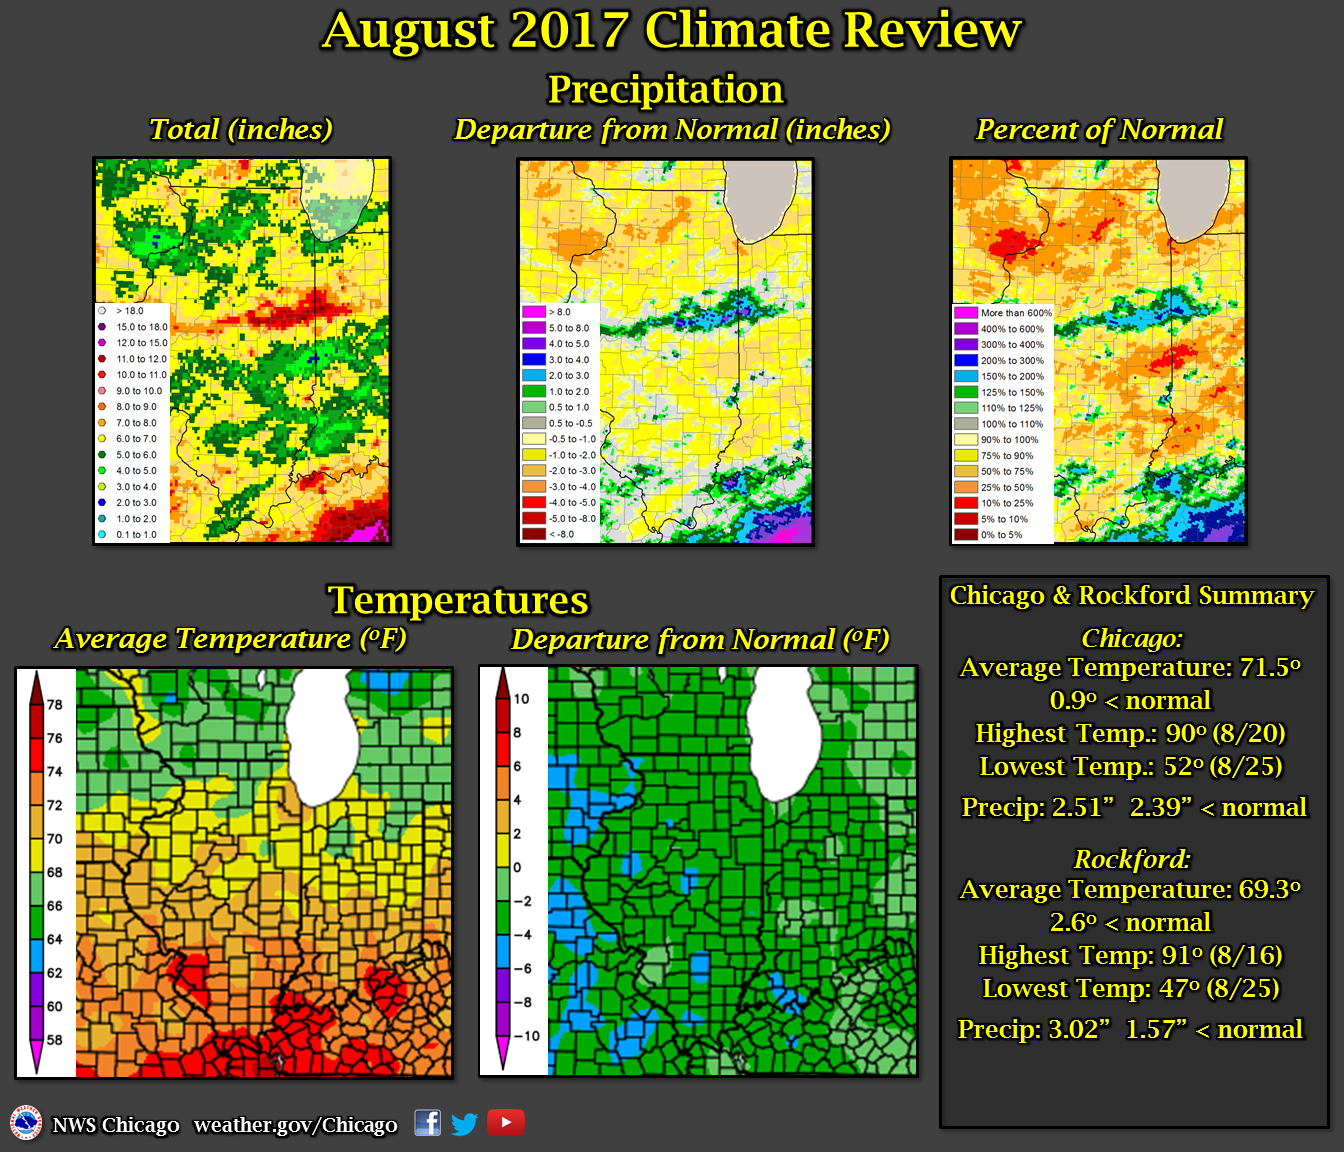
Public Information Statement
National Weather Service Chicago IL
644 AM CDT Fri Sep 1 2017 /744 AM EDT Fri Sep 1 2017/

...A Look Back at the Climate for the Month of August 2017 for
Chicago and Rockford...

At Chicago, the average high temperature was 80.7 degrees, which
is 1.2 degrees below normal. The average low temperature was 62.2
degrees, which is 0.7 degrees below normal. The average
temperature for the month was 71.5 degrees which is 0.9 degrees
below normal. During the month of August, 2.51 inches of
precipitation were recorded, which is 2.39 inches below normal.

There were no records set during the month of August 2017 for
Chicago.

At Rockford, the average high temperature was 80.1 degrees, which
is 2.3 degrees below normal. The average low temperature was 58.5
degrees, which is 2.8 degrees below normal. The average
temperature for the month was 69.3 degrees, which is 2.6 degrees
below normal. During the month of August, 3.02 inches of
precipitation were recorded, which is 1.57 inches below normal.

There were no records set during the month of August 2017 for
Rockford.

