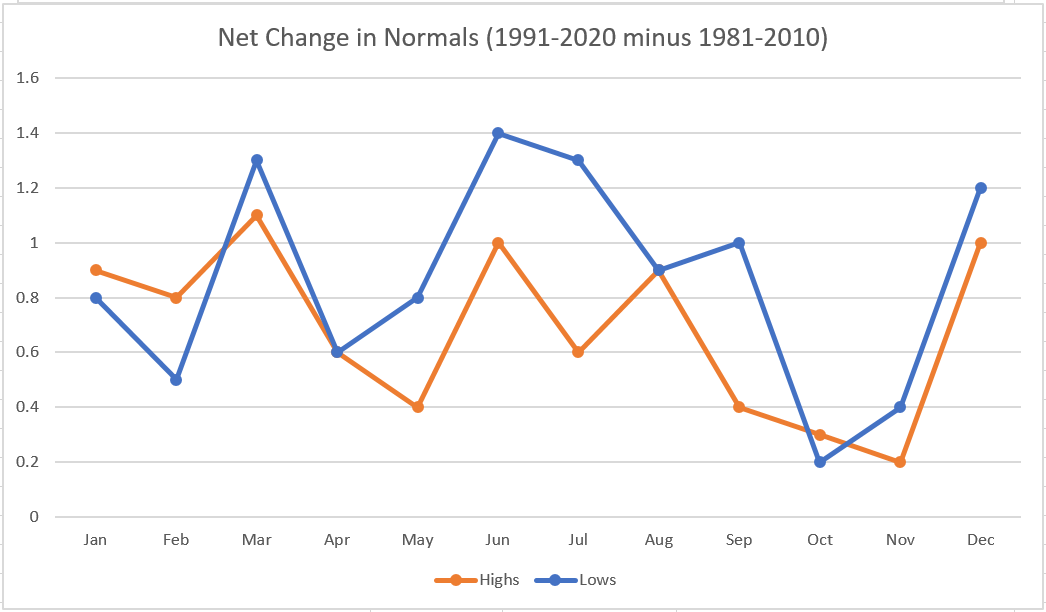
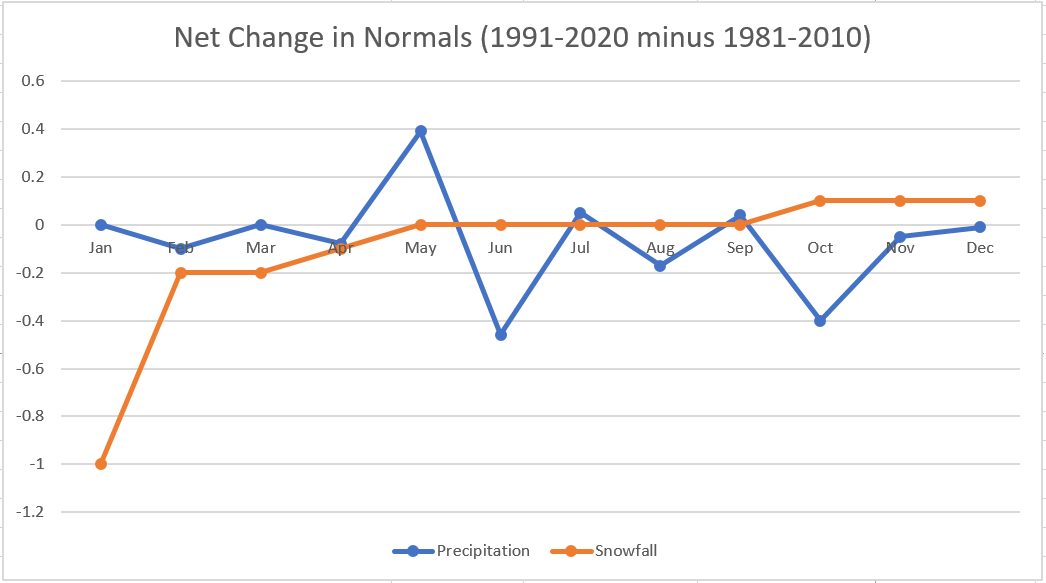
Comparison of the 30 Year Climatological Normals for Lubbock
(1971-2000 vs. 1981-2010 vs. 1991-2020)
In mid-2021, the National Centers for Environmental Information (NCEI) released the latest 30 year climatological normals. The latest 30 year span encompasses 1991-2020, replacing the 1981-2010 time frame which has been the climatological mainstay for the past decade. The following is a comparative look at the new monthly normals at the Lubbock International Airport (KLBB) against the previous 30 year normals and the 1971-2000 normals. The 1991-2020 normals officially become operational in early May of 2021.
Overall, the latest normals depict a warmer and drier period than its predecessor. In fact, the average annual temperature at Lubbock increased by 0.7 degrees, and that is on top of a full degree rise the previous set of normals (between 1971-2000 and 1981-2010). Meanwhile, less precipitation fell in the 2010s than the 1980s, causing the new average annual precipitation for Lubbock to fall from 19.12 inches to 18.33 inches, a decrease of 0.79 inches. Regarding snowfall, the 1980s produced more snowfall across the area than the 2010s. With the 1980s snowfall no longer part of the 30-year climate record, the annual average snowfall has decreased by 1.2 inches.
|
|
Jan
|
Feb
|
Mar
|
Apr
|
May
|
Jun
|
Jul
|
Aug
|
Sep
|
Oct
|
Nov
|
Dec
|
Avg
|
|
1971-2000
|
38.1
|
43.3
|
51.2
|
60.0
|
69.2
|
77.1
|
79.8
|
78.0
|
70.9
|
60.7
|
48.1
|
39.7
|
59.7
|
| 1981-2010 | 40.2 | 44.5 | 51.9 | 60.5 | 69.8 | 77.4 | 80.3 | 79.0 | 71.7 | 61.5 | 49.8 | 40.6 | 60.7 |
| Change 1971-2000 vs. 1981-2010 | +2.1 | +1.2 | +0.7 | +0.5 | +0.6 | +0.3 | +0.5 | +1.0 | +0.8 | +0.8 | +1.7 | +0.9 | +1.0 |
| 1991-2020 | 41.1 | 45.1 | 53.0 | 61.2 | 70.4 | 78.6 | 81.2 | 79.9 | 72.3 | 61.8 | 50.0 | 41.7 | 61.4 |
| Change 1981-2010 vs. 1991-2020 | +0.9 | +0.6 | +1.1 | +0.7 | +0.6 | +1.2 | +0.9 | +0.9 | +0.6 | +0.3 | +0.2 | +1,1 | +0.7 |
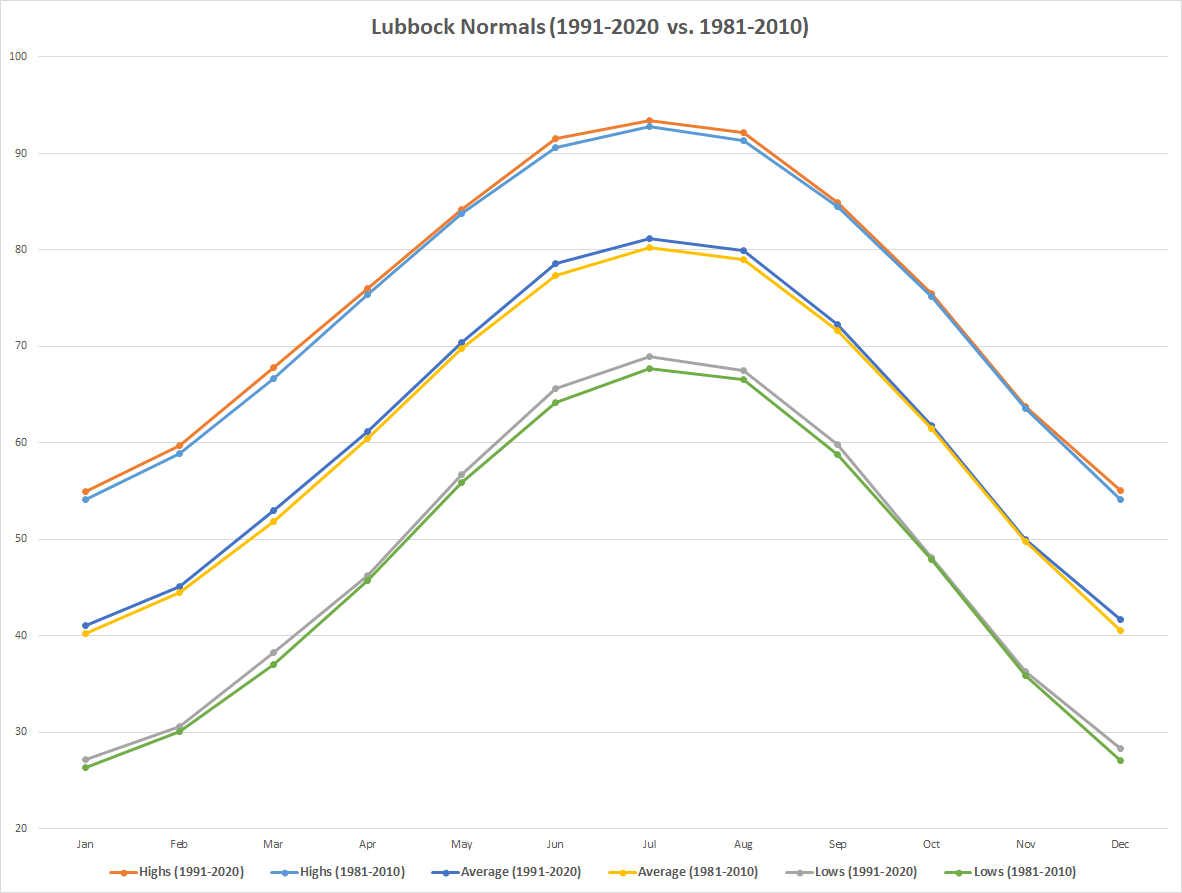 |
| Plot of the climate normals (highs, lows and average temperature) at Lubbock for the 30 year periods of 1991-2020 and 1981-2010. A graph of the change (difference) between the 1991-2020 and 1981-2010 normals can be VIEWED HERE. |
|
|
Jan
|
Feb
|
Mar
|
Apr
|
May
|
Jun
|
Jul
|
Aug
|
Sep
|
Oct
|
Nov
|
Dec
|
Avg
|
|
1971-2000
|
0.50
|
0.71
|
0.76
|
1.29
|
2.31
|
2.98
|
2.13
|
2.36
|
2.57
|
1.70
|
0.71
|
0.67
|
18.69
|
| 1981-2010 | 0.65 | 0.75 | 1.10 | 1.41 | 2.30 | 3.04 | 1.91 | 1.91 | 2.51 | 1.93 | 0.85 | 0.76 | 19.12 |
| Change 1971-2000 vs. 1981-2010 |
0.15 |
0.04 |
0.34 |
0.12 |
-0.01 |
0.06 |
-0.22 |
-0.45 |
-0.06 |
0.23 |
0.14 |
0.09 |
0.43 |
| 1991-2020 | 0.65 | 0.65 | 1.10 | 1.33 | 2.69 | 2.58 | 1.96 | 1.74 | 2.55 | 1.53 | 0.80 | 0.75 | 18.33 |
| Change 1981-2010 vs. 1991-2020 |
0 |
-0.10 |
0 |
-0.08 |
0.39 |
-0.46 |
0.05 |
-0.17 |
0.04 |
-0.40 |
-0.05 |
-0.01 |
-0.79 |
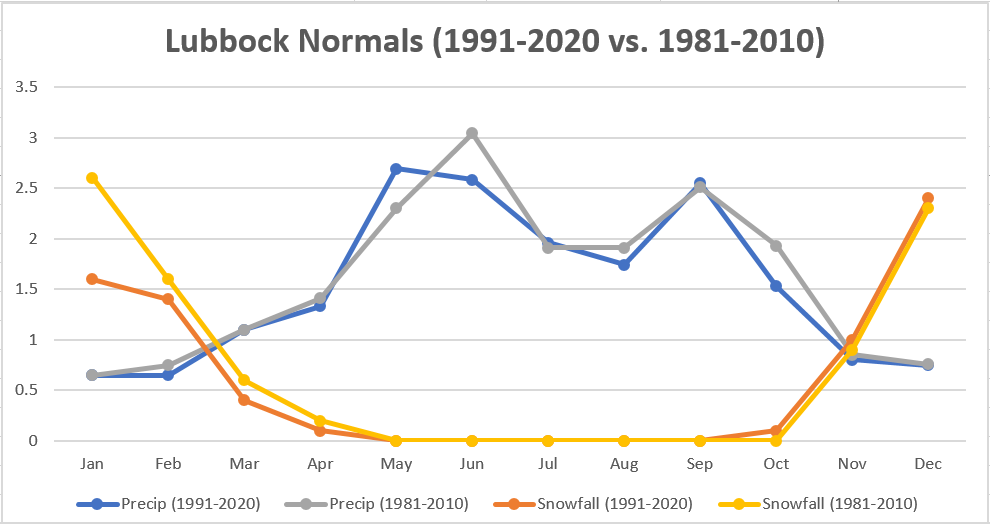 |
| Plot of the climate normals (precipitation and snowfall) at Lubbock for the 30 year periods of 1991-2020 and 1981-2010. A graph of the change (difference) between the 1991-2020 and 1981-2010 precipitation normals can be VIEWED HERE. |
|
|
Jan
|
Feb
|
Mar
|
Apr
|
May
|
Jun
|
Jul
|
Aug
|
Sep
|
Oct
|
Nov
|
Dec
|
Avg
|
|
1971-2000
|
3.0
|
2.4
|
0.5
|
0.2
|
0.0
|
0.0
|
0.0
|
0.0
|
0.0
|
0.3
|
1.6
|
2.4
|
10.4
|
| 1981-2010 | 2.6 | 1.6 | 0.6 | 0.2 | 0.0 | 0.0 | 0.0 | 0.0 | 0.0 | 0.0 | 0.9 | 2.3 | 8.2 |
| Change 1971-2000 vs. 1981-2010 | -0.4 | -0.8 | 0.1 | 0 | - | - | - | - | - | -0.3 | -0.7 | -0.1 | -2.2 |
| 1991-2020 | 1.6 | 1.4 | 0.4 | 0.1 | 0.0 | 0.0 | 0.0 | 0.0 | 0.0 | 0.1 | 1.0 | 2.4 | 7.0 |
| Change 1981-2010 vs. 1991-2020 | -1.0 | -0.2 | -0.2 | -0.1 | - | - | - | - | - | 0.1 | 0.1 | 0.1 | -1.2 |



 Follow us on X
 Follow us on Facebook
 Follow us on YouTube
 LUB RSS Feed