|
Scorching Summer Heat |
|
 |
|
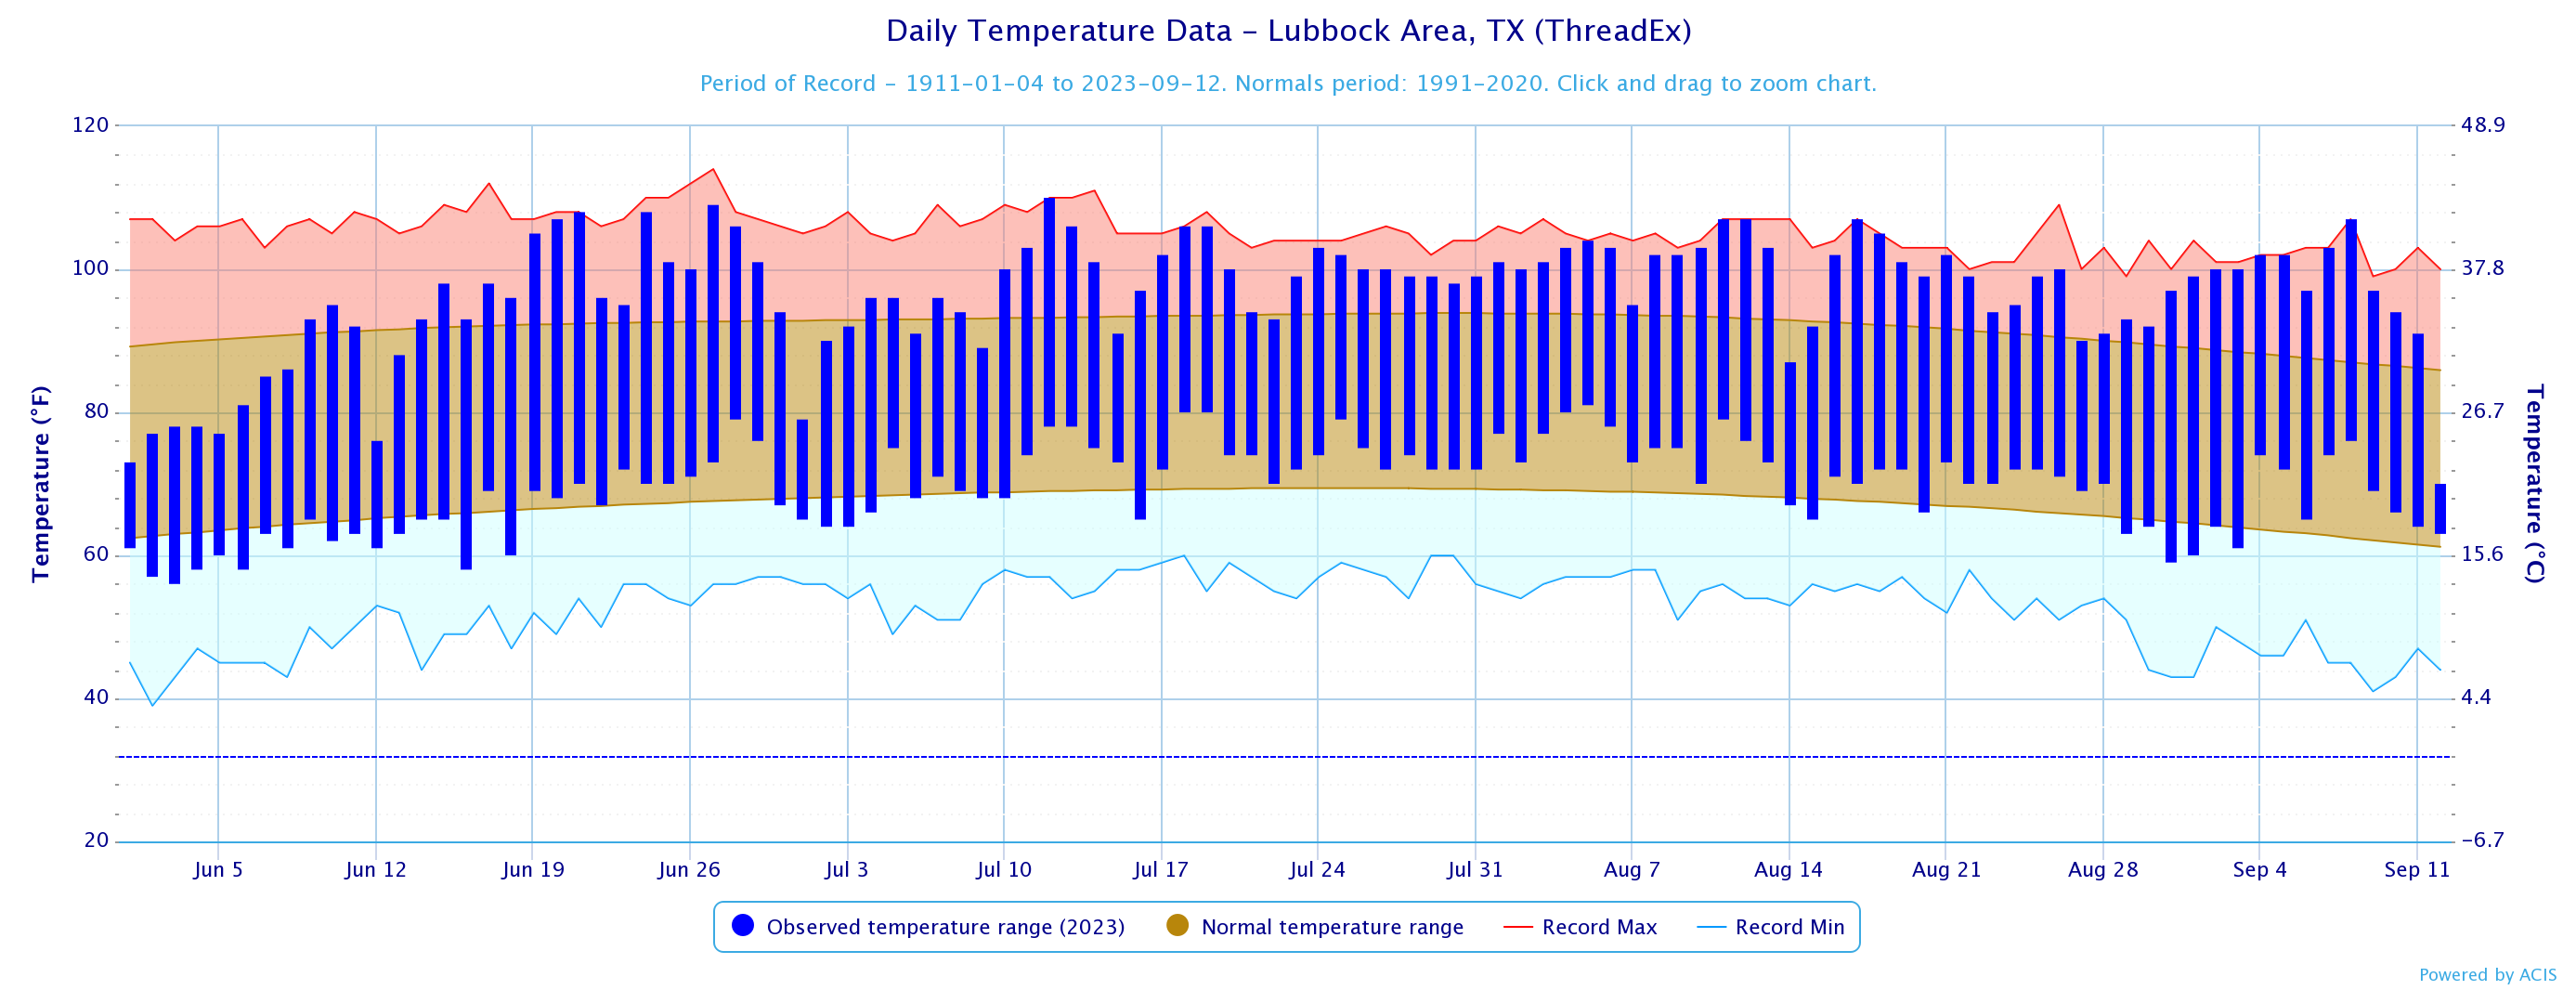
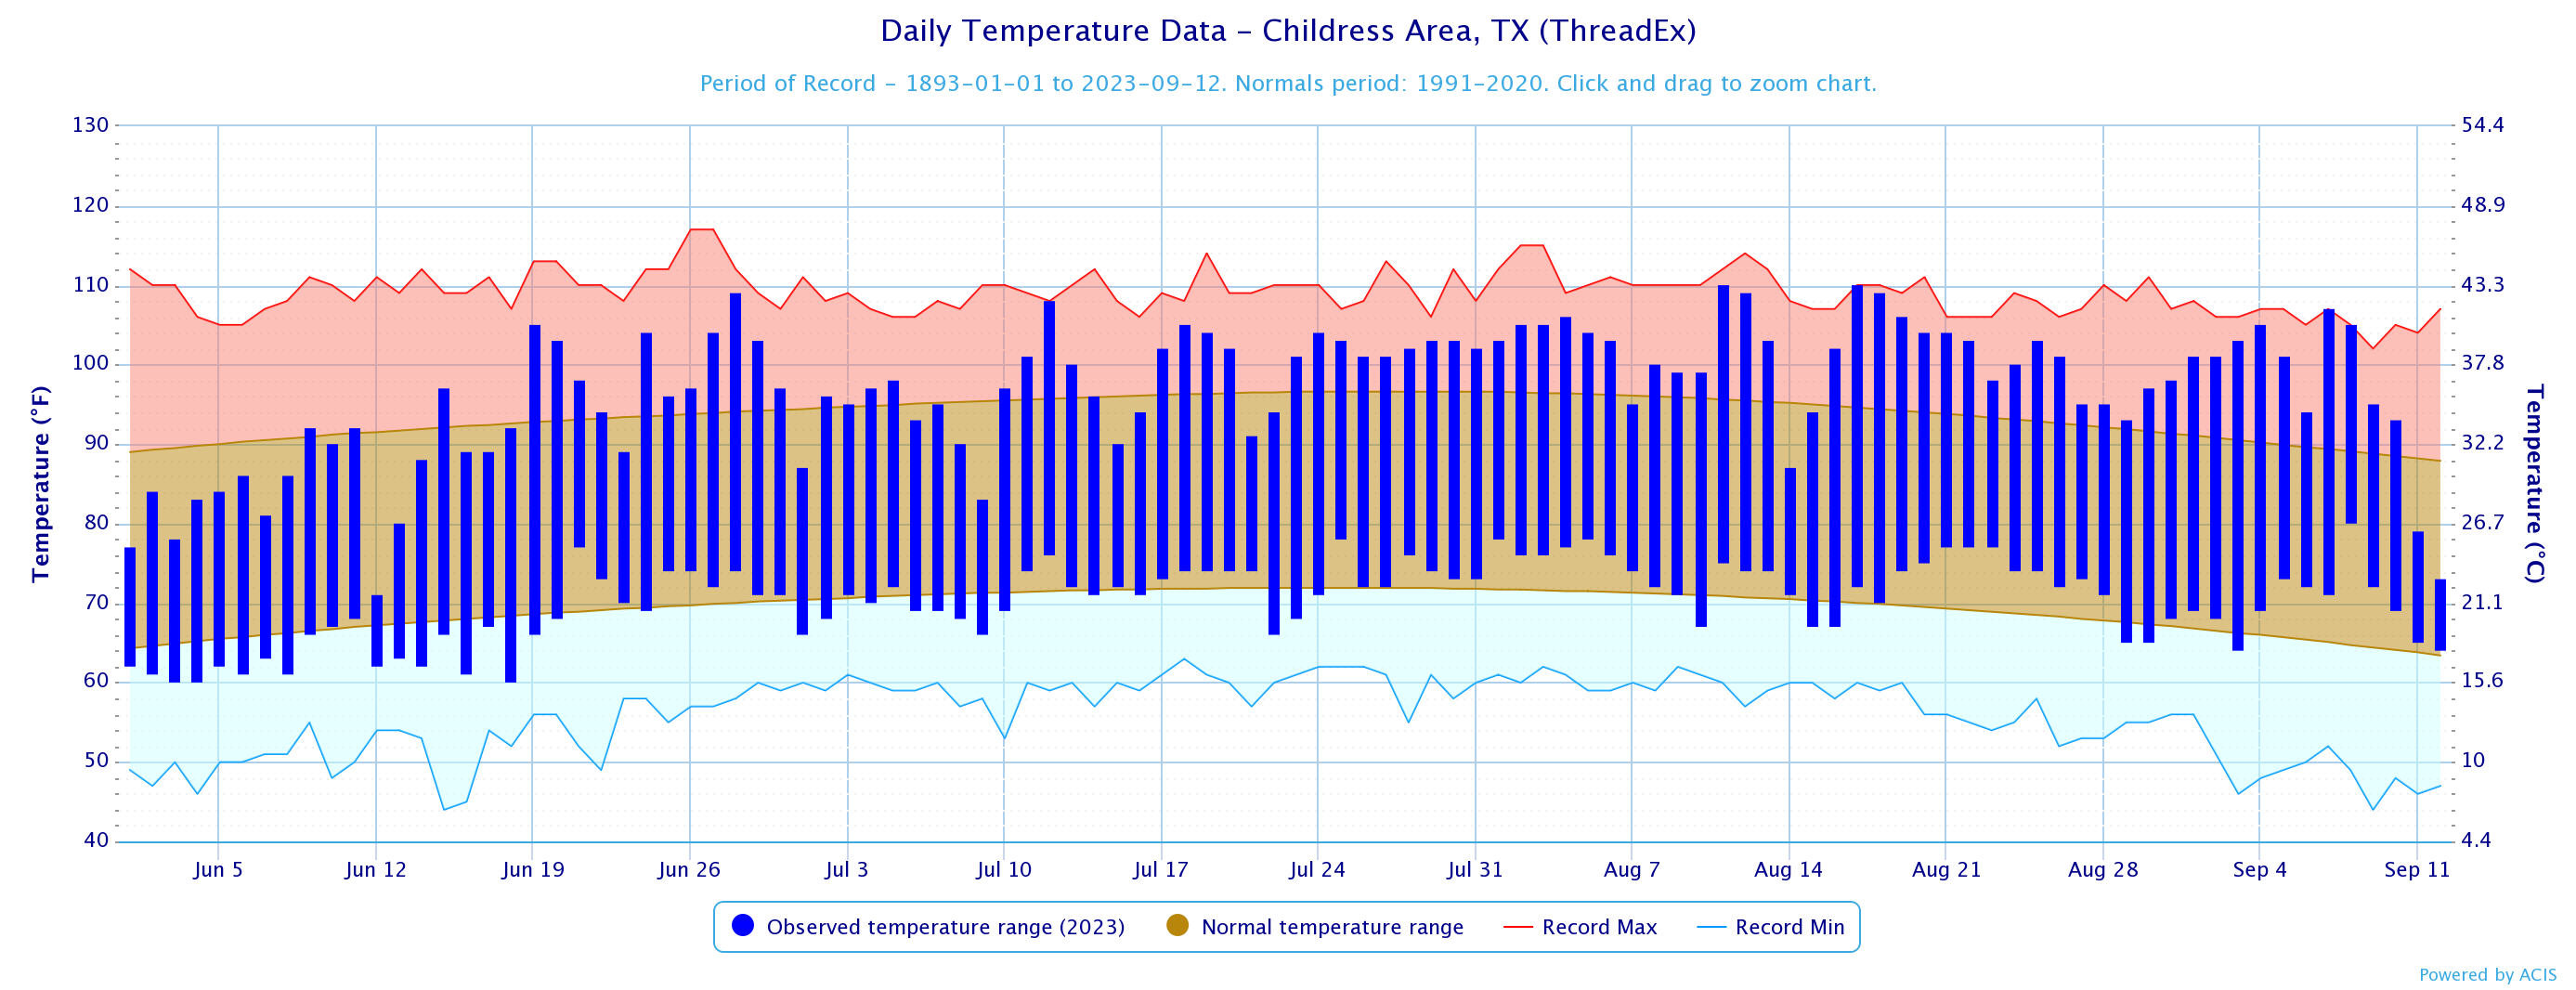
| Daily temperature range for Lubbock from June 1st through September 12th, 2023. Also plotted are the daily record highs (red) and lows (blue). The brown shaded area contains the 30-year average highs and lows. A similar plot for Childress can be VIEWED HERE. | |
|
It is no surprise to those who lived through it, but the summer of 2023 brought the heat to the South Plains region, and to all of Texas. After a pleasantly cool and wet start to June, the weather turned drier and much hotter, especially by the second half of the month, as the above plot of temperatures at Lubbock shows. Lubbock observed its first 100 degree temperature of the year on June 19th, relatively late in the season for what ended up being an exceptionally hot summer. However, by the end of June Lubbock had reached 100 degrees or higher on 9 days, just shy of the long term average for the entire summer. This included 109ËšF on the 27th, 108ËšF on the 21st and 24th, 107ËšF on the 20th, 106ËšF on the 28th and 105ËšF on the 19th. |
|
 |
|
| Lubbock's high temperatures, as a function of the departure from normal, from June 1st through September 26th, 2023. The orange shading is for above normal departures and the blue represents below normal departures. To view the same graphic, but for Childress, CLICK HERE. | |
|
The final day of June into early July provided modest relief, with temperatures closer to average. Unfortunately, the "cool" temperatures didn't last, with triple digits returning to northwest Texas the second week of July, and becoming a mainstay until late August, with only a few short interludes of minor cooling. The hottest temperature reached in Lubbock was 110ËšF, which set a daily record high on July 12th, while August saw three days that reached 107ËšF (August 11th, 12th and 17th), all records for the day. The heat continued into early September, with Lubbock reaching 100ËšF on 6 of the first 8 days, including an all-time September record high of 107ËšF on the 8th. |
|
 |
|
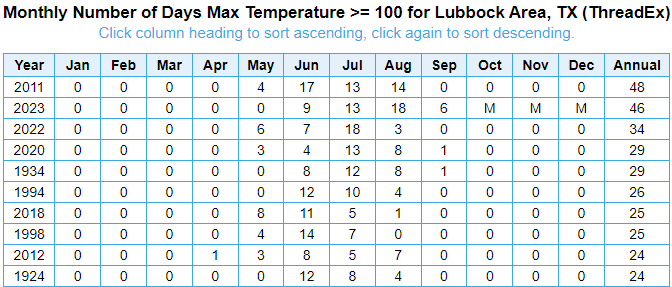
| Plot of the number of 100 degree days for the summer (June, July and August) of 2023. The plot is courtesy of scacis.rcc-acis.org. | |
|
Altogether, Lubbock recorded 46 total 100-degree days in 2023, finishing second, just shy of the ridiculously hot and dry summer of 2011, which had 48 triple digit days. The number was even higher further east, as the above map illustrates, which is common for the lower elevations off the Caprock. Officially, Childress recorded 50 total 100-degree days (through September 28th), which tied for the 12th most, far behind the record of 99 days, set in 2011. |
|
 |
|
| Table showing the top 10 number of 100 degree days recorded at Lubbock. To view a similar table, valid for Childress, CLICK HERE. | |
|
The hot summer included three 6-day stretches where Lubbock reached 100ËšF or higher, each of which tied for the 13th longest such streak. This could have been even more impressive except for a 95ËšF high on August 7th, which separated two of the 6-day stretches. This "chilly" day preserved the all-time consecutive 100-degree streak of 12 days, set in Lubbock back in 1980. Childress observed 15 straight days at or above 100ËšF from late July into early August, which ranks 16th overall and well behind the absurd record of 50 straight days in 2011. |
|
| Mean average temperature rank for the summer of 2023 (June-August). The plot is courtesy of the SERCC ClimPer. | |
| The hot summer wasn't confined to the South Plains region, but affected all of Texas and beyond. The above plot shows that the summer of 2023 ranked as the second hottest on record at Lubbock, while many stations downstate, from Central Texas through the coastal sites, as well as El Paso, recorded their hottest summer ever. | |
 |
|
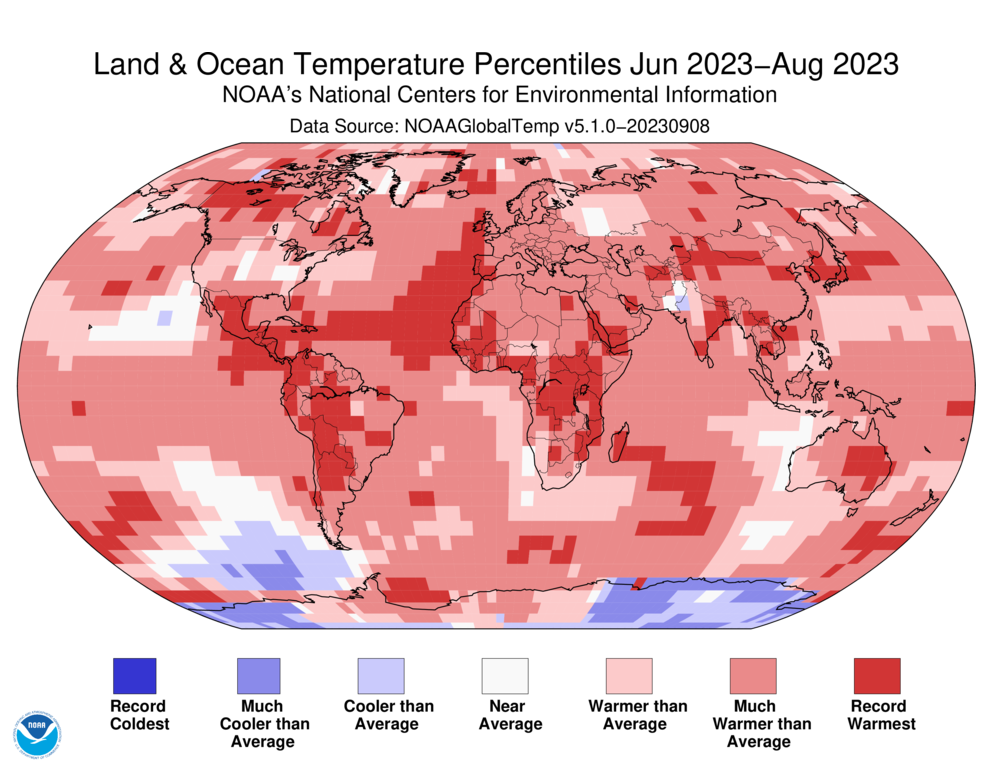
| Land and ocean temperature percentiles for the summer of 2023. The image is courtesy of NCEI. | |
| Expanding the view even further, the above image shows that much of the globe experienced temperatures warmer than average from June through August, including many pockets in the record warmest category. | |
 |
|
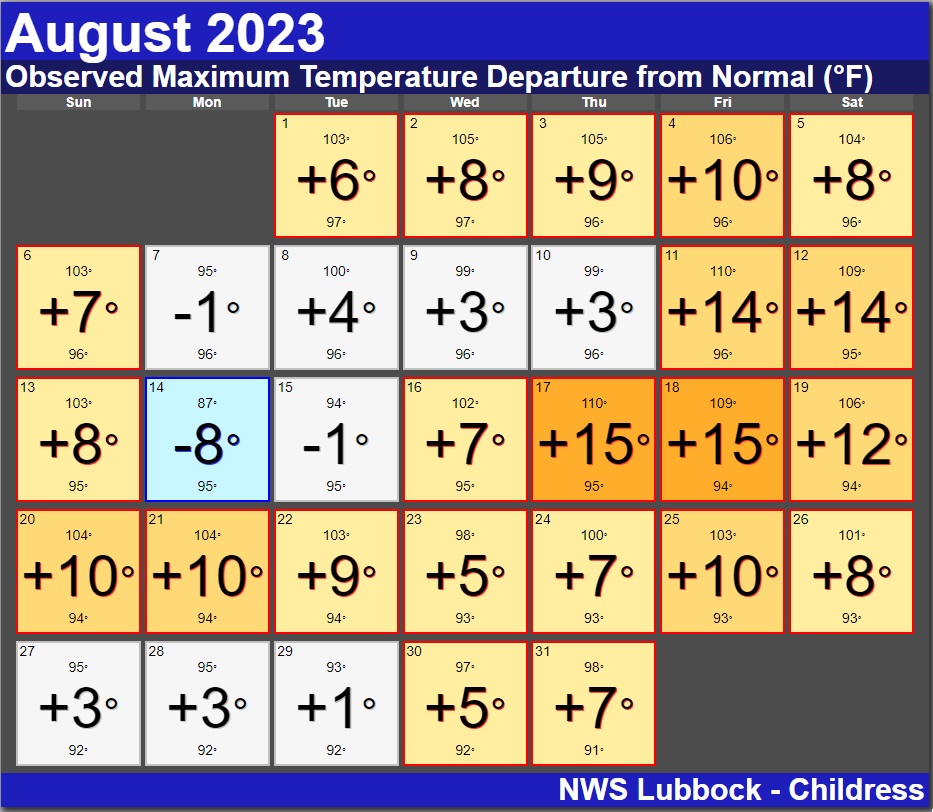
| Lubbock's high temperatures and departures from average for August 2023. A similar plot for Childress can be VIEWED HERE. | |
|
Coming back to West Texas, August was particularly toasty, even in comparison to the summer as a whole. The daily average temperature at Lubbock was 85.5 degrees, an impressive 5.6 degrees above average, and second only to 2011 at 86.0 degrees. The average high measured at Lubbock was 99.2 degrees, a whopping 7.0 degrees above average, which tied for the second hottest August on record with 2011 (just shy of the all-time August record of 99.5 degrees, set in 1943). For Childress, the monthly average temperature was 87.0 degrees. This made it the sixth warmest August at Childress (2011 remains #1 with an average of 90.9 degrees). In terms of the high temperature, the monthly average was 101.3 degrees, which puts it in 4th place overall (1943 was the hottest with an amazing 106 degrees!).
|
|
 |
|
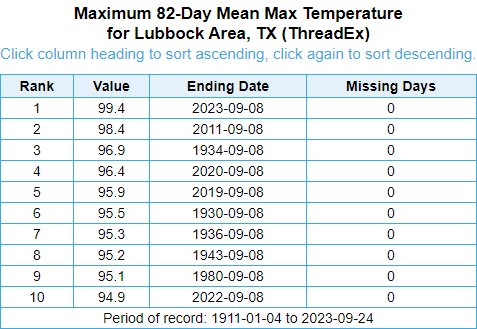
| Mean high temperature and ranking for Lubbock, valid from 19 June through 8 September 2023. The same table, valid for Childress, can be VIEWED HERE. The mean average temperature over this same period can be found for: Lubbock and Childress. | |
|
Not surprisingly, the hottest weather in 2023 occurred during a prolonged stretch of dry weather, between the wet end of May and start to June and the brief return of widespread rain and thunderstorms the second week of September. Looking at this dry and hot stretch, specifically from June 19th through September 8th, Lubbock recorded it hottest readings on record with respect to average highs and average temperatures, beating out 2011 in both cases (it also tied 2011 for the warmest average lows over this same period). For Childress, from June 19th through September 8th, they finished with the 7th hottest average high, the 5th highest average temperature and 10th warmest average low on record. The robust green up after the widespread significant rain in late May and early June, combined with a bit more precipitation through the heart of summer (than Lubbock), contributed to the slightly "cooler" temperatures in Childress versus Lubbock when looking at historic rankings. That said, actual temperatures measured at Childress (average highs, lows and mean temperature) during this stretch were warm/hotter than Lubbock. |
|
 |
|
| Plot of the total precipitation (PRISM data) from 19 June through 8 September 2023. The plot is courtesy of scacis.rcc-acis.org. | |
|
The above image shows the approximate amount of rainfall that fell across northwestern Texas from mid-June through early September. Rain totals below 2 to 3 inches were common over most of the South Plains during this 2.5+ month stretch. Spotty heavier totals were found over parts of the southern Texas Panhandle into the Rolling Plains, but it did come with severe weather too, including the tornadic storm that impacted Matador on June 21st. |
|
 |
|
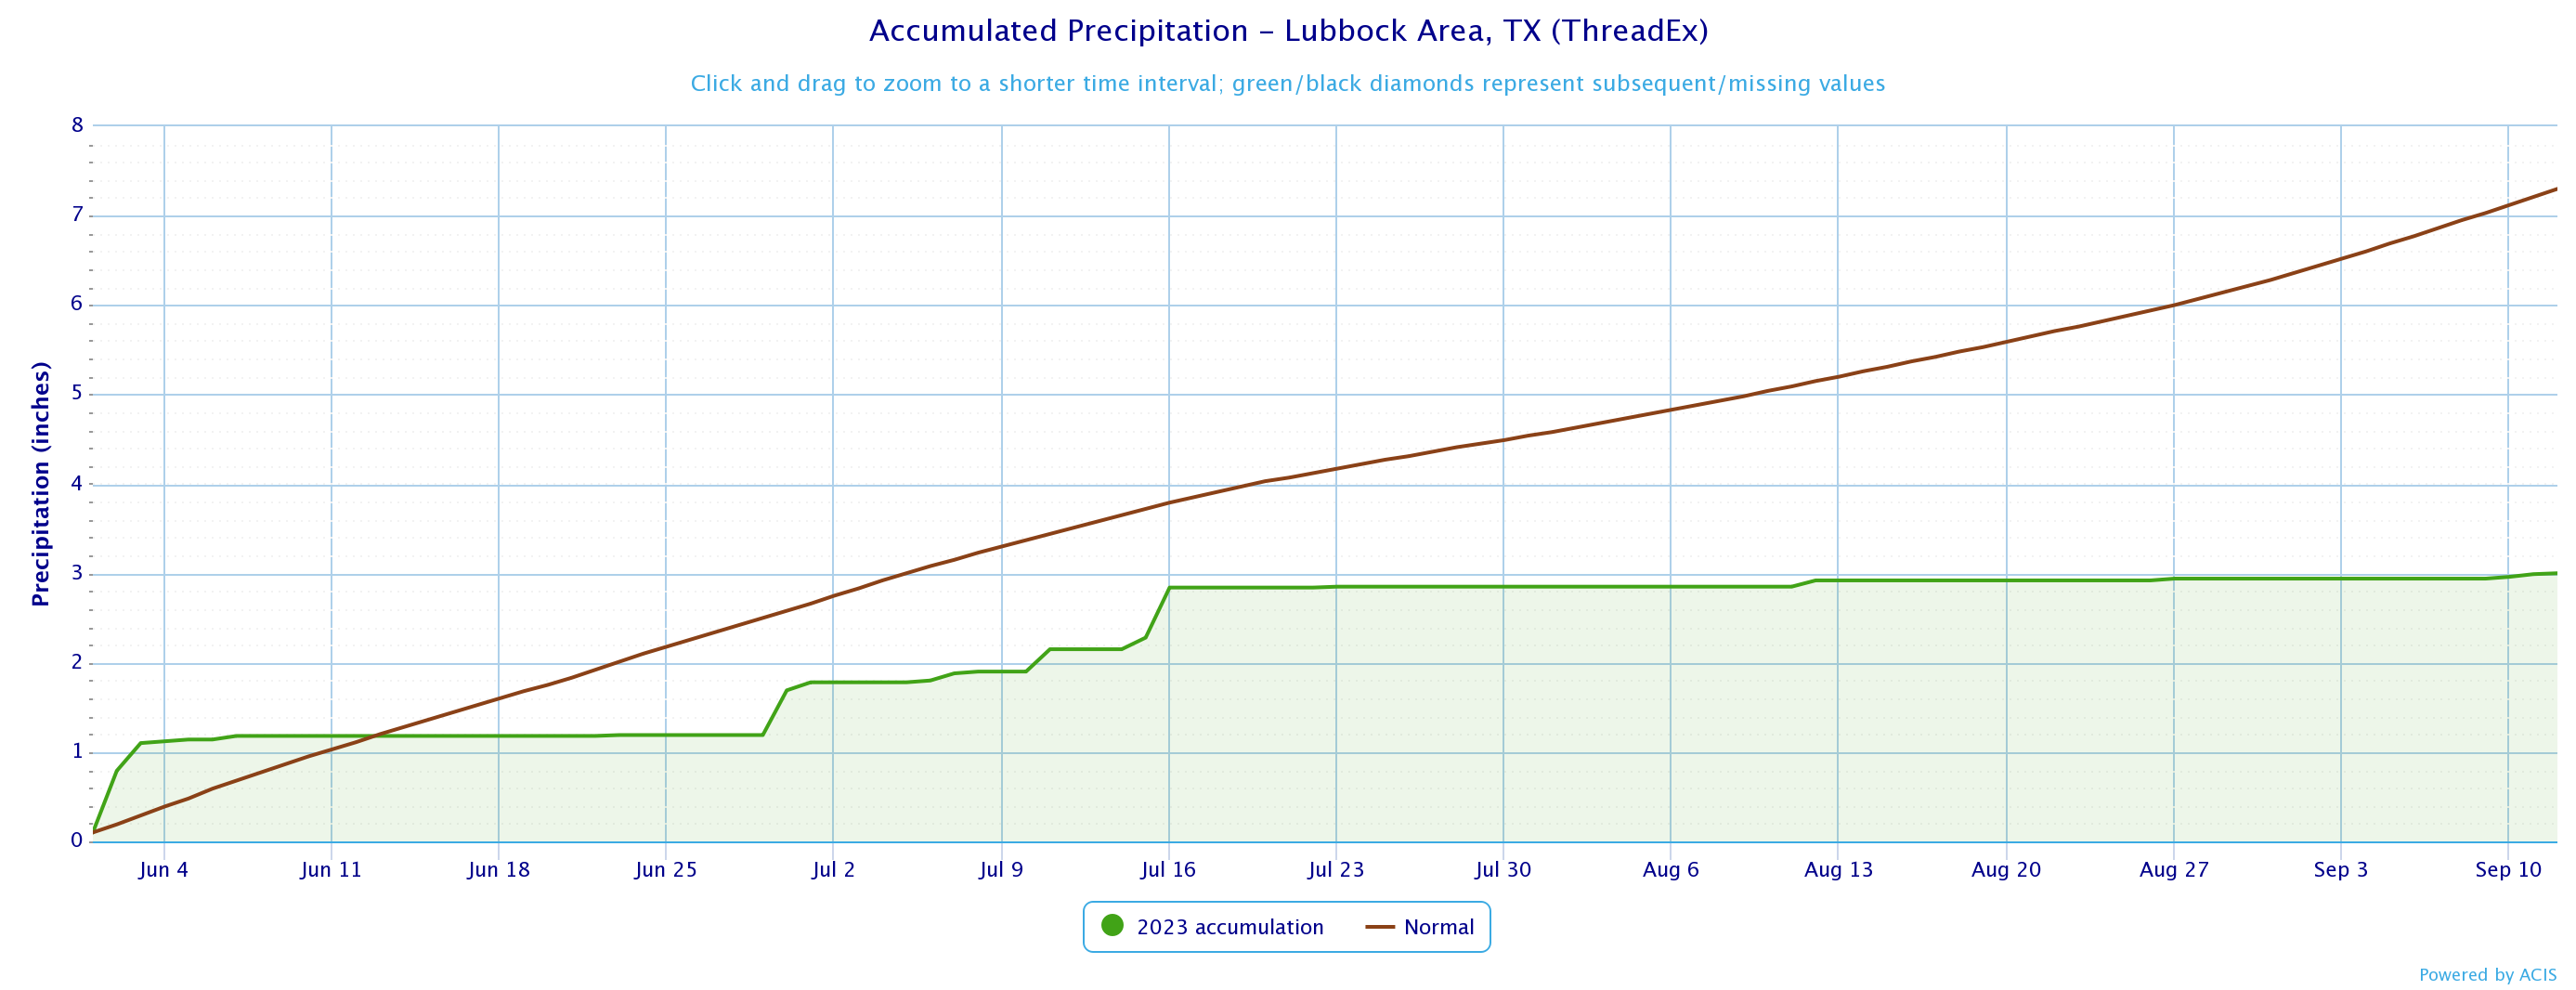
| Accumulated precipitation trace (green) and normal rainfall (brown) for Lubbock, valid from 1 June through 12 September 2023. A comparable trace for Childress can be FOUND HERE. | |
| Officially, Lubbock measured 1.76 inches between June 19th and September 8th, the 4th driest on record, and about 33% of the normal of 5.35 inches. As the above graph shows, outside of the spotty rainfall from the final day of June into the first half of July, very little rain fell at Lubbock in the summer of 2023. This same trend, although not as pronounced at some sites, was the general rule for the entire region. Unfortunately, after the wet and cool start to the summer, the prolonged period of intense heat and minimal rainfall caused the briefly subdued drought to reemerge and flex. This stressed plants/crops, with relief not experienced until the second week of September when cooler weather and widespread rain finally returned to the southern High Plains. |

