| A Review of Local Weather in 2011 |
Overview
As in 2010, weather headlines in 2011 included many temperature extremes that occurred during both the winter and summer months, a rare winter weather event, and a lack of direct local tropical cyclone impacts despite a busy Atlantic Hurricane Season overall. While delayed by the cold winter temperatures, a brief severe weather season did occur in late March and early April. Tallahassee went on to experience its hottest summer on record for the second consecutive year and also set a new all-time high temperature record for the observing location. The year will also go into the books as one of the driest on record with rainfall coming in two feet below normal.
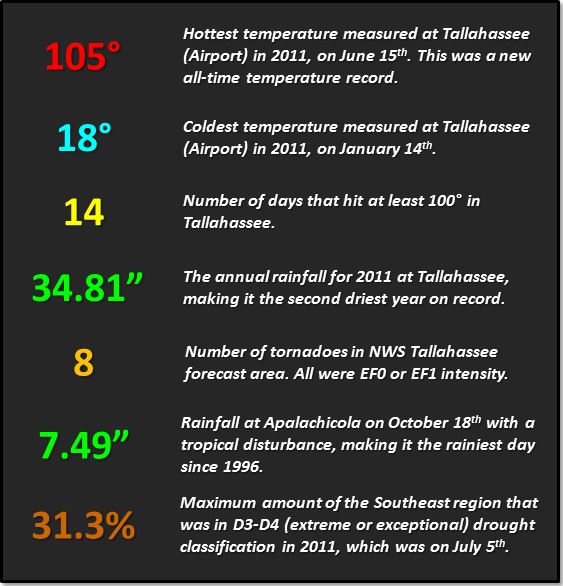
Figure 1. 2011 Weather-by-the-Numbers, highlighting a few weather statistics for the NWS Tallahassee forecast area.
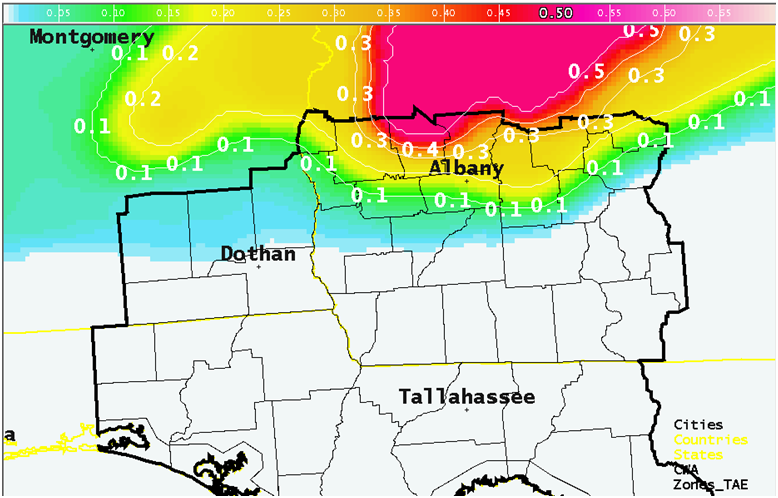
Rare Ice Storm
An extremely rare ice storm impacted northern portions of the WFO Tallahassee County Warning area on January 10th. Some areas north of Albany, GA, received a quarter to half inch of ice accumulation. Details on this event can be found in the event web page. An analyzed map of ice accumulation based on spotter reports and observations can be found here. This winter storm also brought ice accumulation to other parts of the South - from central Mississippi into central Georgia. Snow fell to the north of that, with some areas in northern Mississippi, northern Alabama, southern Tennessee, and north Georgia receiving upwards of 8 inches of snow.
Severe Weather
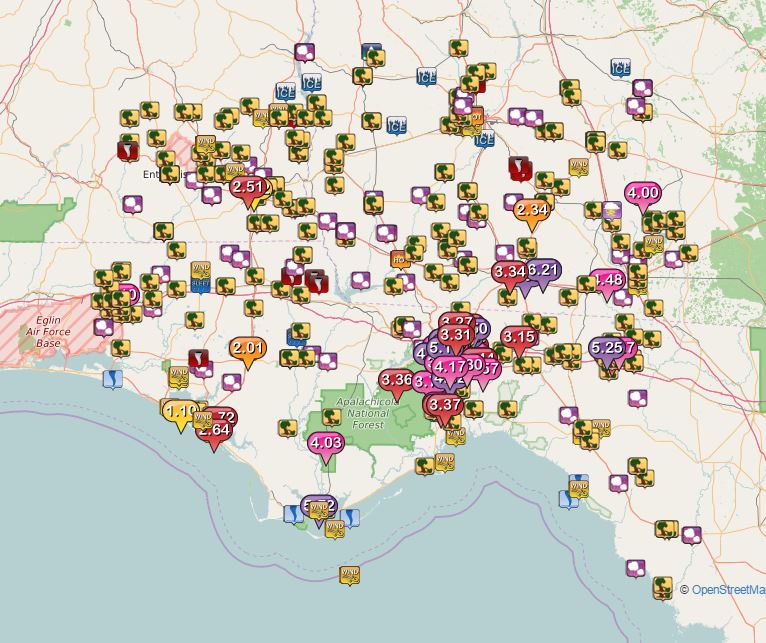
Figure 2. (Left) Radar composite of the developing, extensive squall line on the afternoon of April 4th. Figure 3. (Right) A map of all the severe weather reports across our area in 2011.
For the second spring in a row, the typical peak of severe weather season was negatively impacted by unusually cold winter temperatures. However, unlike 2010 when cold temperatures lasted well into March, 2011 saw a rapid warm up in mid February. This allowed Gulf sea surface temperatures to recover sufficiently to allow for the instability needed for severe weather. There were three severe weather episodes of note during the spring including back-to-back days with large hailstorms on March 26th and 27th, and a large squall line that brought damaging winds to nearly every county in the forecast area on April 5th. This latter event was one of the most prolific severe weather events to ever impact the Southeastern United States. Locally, severe weather also occurred on Labor Day in association with Post-Tropical Storm Lee (see next section).
Hurricane Season
La Niña re-developed in 2011 and once again enhanced hurricane season activity across the Atlantic Basin. NOAA described this season as "breaking hurricane amnesia," but that pertains mainly to the east coast where the only U.S. hurricane landfall occurred this year. Hurricane Irene made landfall in both North Carolina and New Jersey in August. A total of 19 named storms formed again this season – tied with 1887, 1995 and 2010 for third highest number on record. Of those, only 7 became hurricanes. Three of those reached major hurricane status of Category 3 or higher. As can be seen in Figure 4 (below), despite all of this activity, impact on the southern United States was minimal. There was not a single tropical cyclone landfall in the state of Florida and only two along the Gulf Coast. 2011 marked the second year in a row that there were absolutely no tropical storm or hurricane watches or warnings issued for the NWS Tallahassee county warning area. The area did see peripheral impacts from Tropical Storm Lee in the form of a severe weather episode that occurred on Labor Day. Unlike most TC-related severe weather events, this one involved mainly straight-line wind damage as opposed to tornadoes. Details on this event can be found in our event web page.
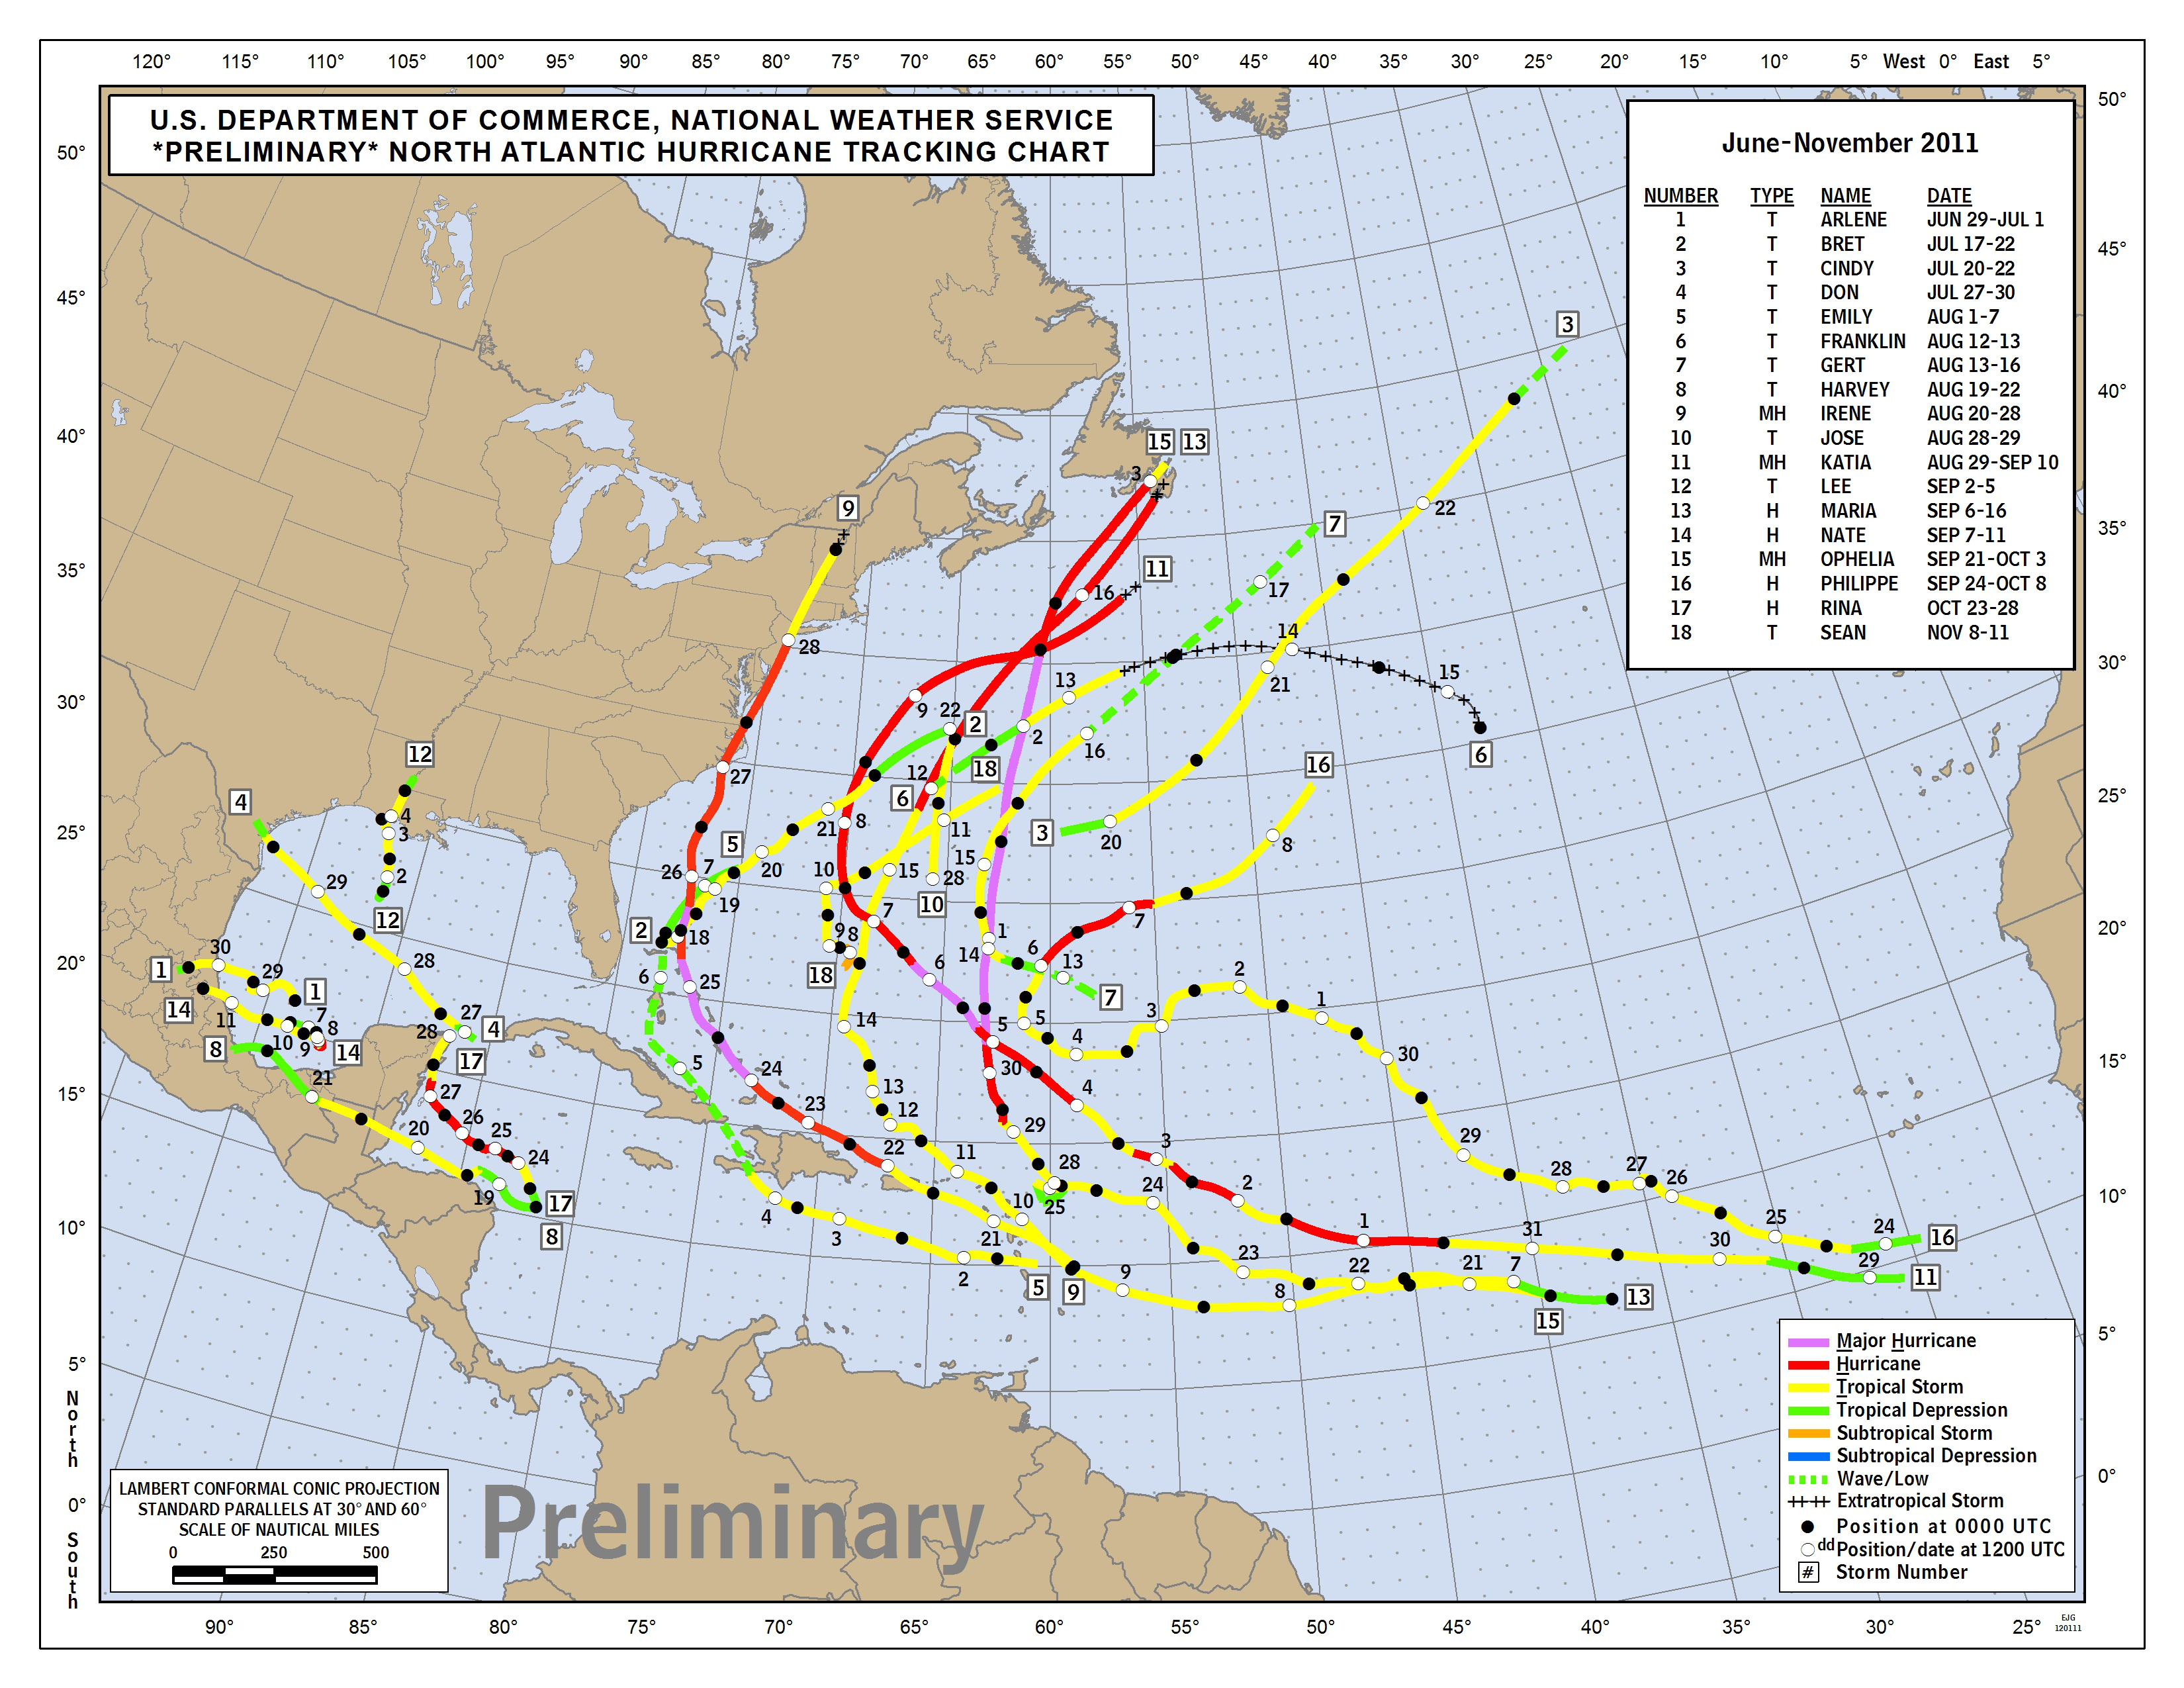
Figure 4. Preliminary storm tracks for the 2011 Atlantic Hurricane Season.
Temperature Extremes
As can be seen in the upper half of Figure 5 (below), there were several periods of very cold weather during the first 6 weeks of the year as much of the eastern U.S. was under the influence of the negative phase of the North Atlantic and Arctic Oscillations for a second consecutive winter. The coldest temperature of the year occurred on January 14th, when the mercury dipped to 18 degrees. With the exception of the very beginning and end of the month, January saw temperatures that were persistently below normal. In fact, January 2010 was tied for the 10th coldest on record. A sudden warm-up occurred in mid February that prevented the winter of 2010-2011 (Dec.-Feb.) from being in the top 5 coldest on record. We settled for 6th coldest instead, which knocked the 2009-10 winter season down to 7th coldest.
Valentine's Day marked a transition to a persistent pattern of above normal temperatures that continued through the spring and summer months. Each month from February through August recorded above normal temperatures. The summer months were particularly hot. June was the second hottest on record behind only June 1998. In addition, a new all-time temperature record was established on June 15th when the mercury soared to 105 degrees. August was the hottest on record and 3rd hottest month ever at Tallahassee. Four of the 6 hottest Augusts have now occurred since 2006. The persistent heat made the meteorological summer of June through August the hottest on record, eclipsing 1998 and 2010 by 0.2 degrees. While 1998 still has the most 100-degree days at 16, 2011 came in second place with 14, half of which occurred in August.
The excessive heat broke at the very end of August and the autumn months of September and October actually had below normal temperatures. November was warmer than average, despite an unusually cold morning on the 12th that saw the mercury plunge to 22 degrees, breaking the daily record by five degrees. December was warmer than normal as well with many days above 70 degrees. There were only three days, the first three of the month, that saw the mercury drop below freezing at the Tallahassee Regional Airport, with the lowest temperature of the month (27 degrees) recorded on the first.
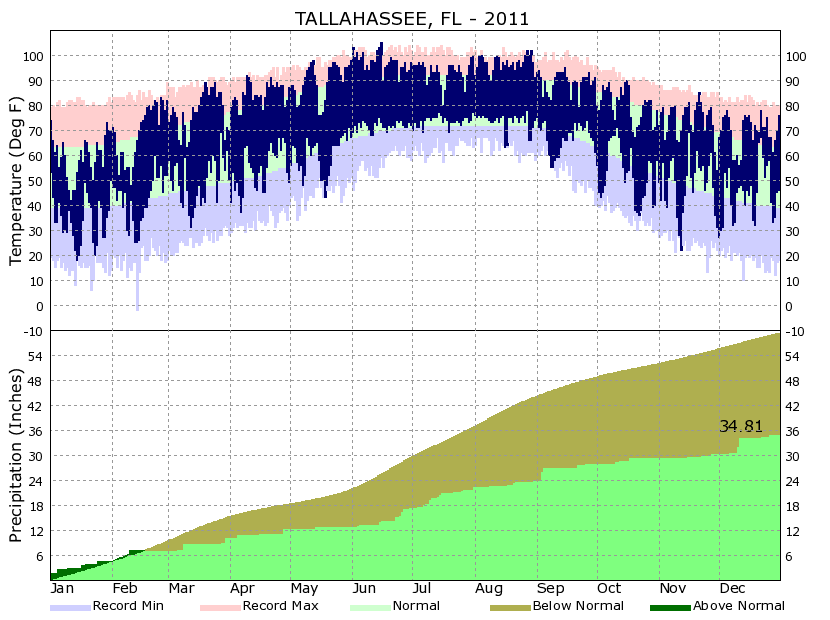
Figure 5. Temperatures and precipitation in Tallahassee during the year 2011.
Ongoing Drought Conditions Worsen
As can be seen in the lower portion of Figure 5 (above), 2011 was a very dry year, in fact the 2nd driest of all time. Only 1954 was drier. Rainfall for the calendar year came in at 34.81 inches, which is 24.42 inches below normal. Every month during the year had below normal rainfall, except December. May was the 8th driest on record and August ranked as the driest of all time. The summer months of June through August were the driest on record, eclipsing the record set way back in 1925. November 2011 marked the 12th consecutive month to record below average rainfall in Tallahassee. Other areas north and west of the Florida Big Bend will end the year in extreme drought (Figure 6, below). These conditions are expected to worsen through the remaining winter months as the area remains under the drying influence of La Niña.
Figure 6. U.S. Drought Monitor from December 27, 2011 depicting severe (medium orange) to exceptional (brown) drought conditions across much of the Gulf Coast region.
Previous Years
Reviews of local weather in 2010, 2009, 2008, 2007, 2006, 2005, 2004, 2003, 2002, 2001 and 2000 are also available.
National Weather in 2011
NCDC provides a review of annual weather across the nation in 201 including significant events.

