| West Central and Southwest Florida 2018 Annual Climate Summary and Tables |
||
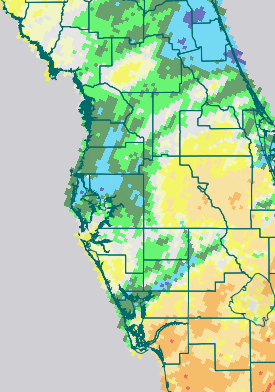
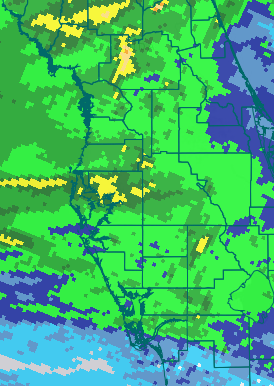
2018 across West Central and Southwest Florida saw ups and downs in the temperatures and rainfall. The year started out cool and generally wetter than normal in January then became much warmer and drier than normal with February becoming the Warmest on record across most of the area. The pendulum swung back to cooler than normal temperatures for March then back to above normal for April with the rather dry weather persisting. As we moved into May a summer-like pattern developed with showers and thunderstorms on numerous days which kept temperatures closer to normal, but rainfall was well above normal with a many locations setting a new record for the most rain in any May. For the summer months of June, July, and August temperatures were generally near to above normal while rainfall was highly variable thanks to many days with winds coming from a southerly to westerly direction, which is in contrast to what is considered our more typical summertime east to southeast flow. This led to many areas near the coast from Tampa Bay southward seeing well below normal rainfall for much of the Summer. However, during the last two weeks of August our more classic summertime east to southeast flow setup and this brought many locations near the coast back closer to normal. During the September we saw numerous days in the 90s which led to many locations setting a new record for the Warmest September on record. The warm weather persisted into the first half of November, then we finally saw a decent cold front sweep through ushering a brief cool down during mid-month followed by a stronger cold front toward the end of the month. The summer rainy season came to a gradual end right on schedule during late September and early October with rainfall below normal for most of the Autumn across the area. For December an El Niño like pattern setup with three separate storm system moving across the southern U.S. bringing widespread rain and strong to severe thunderstorms to much of the region. The first system brought heavy rainfall of 2 to 4 inches to parts of the Tampa Bay region. The second brought heavy rainfall from around the Interstate 4 corridor northward with the most, 6 to 9 inches, occurring across parts of Levy and Citrus counties. The third system setup a little further south with widespread rainfall of 3 to 6 inches north of a line from around Venice to Wauchula to Frostproof. |
Click on a "Site" name for more detailed information |
| 2018 Temperature (°F) - Graphics | ||||
| Site | Average | Normal | Dep fm Normal | Ranking |
| Arcadia | 73.2 | 72.1 | +1.1 | Tied 25th Warmest |
| Archbold | 73.3 | 71.7 | +1.6 | 7th Warmest |
| Bartow | 73.6 | 73.6 | 0.0 | Tied 12th Warmest |
| Brooksville | 71.9 | 70.1 | +1.8 | Tied 18th Warmest |
| Chiefland 5 ESE | 71.5 | 68.5 | +3.0 | 3rd Warmest |
| Fort Myers | 76.2 | 75.1 | +1.1 | Tied 7th Warmest |
| Inverness 3 SE | 70.5 | 70.3 | +0.2 | Tied 25th Warmest |
| Lakeland | 74.7 | 72.6 | +2.1 | 7th Warmest |
| Myakka Rvr St Pk | 74.5 | 73.1 | +1.4 | Tied 6th Warmest |
| Plant City | 74.9 | 72.4 | +2.5 | 3rd Warmest |
| Punta Gorda | 75.6 | 73.8 | +1.8 | Tied 4th Warmest |
| Sarasota-Bradenton | 74.4 | 72.9 | +1.5 | Tied 5th Warmest |
| St. Leo | 72.7 | 73.0 | -0.3 | Tied 34th Warmest / 81st Coolest |
| St. Petersburg | 75.4 | 74.2 | +1.2 | 10th Warmest |
| Tampa | 75.6 | 73.4 | +2.2 | 3rd Warmest |
| Tarpon Springs | 74.0 | 72.1 | +1.9 | Tied 9th Warmest |
| Venice | 74.5 | 73.0 | +1.5 | Tied 8th Warmest |
| Wauchula 2 N | 73.1 | 73.7 | -0.6 | Tied 20th Warmest |
| Winter Haven | 75.1 | 73.3 | +1.8 | Tied 4th Warmest |
| 2018 Rainfall (inches) - Graphics | ||||
| Site | Total | Normal | Dep fm Normal | Ranking |
| Arcadia | 55.41 | 52.24 | +3.17 | 41st Wettest / 65th Driest |
| Archbold | 54.77 | 52.15 | +2.62 | 25th Wettest |
| Bartow | 56.70 | 52.08 | +4.62 | 43rd Wettest / 77th Driest |
| Brooksville | 64.52 | 52.77 | +11.75 | 27th Wettest |
| Chiefland 5 ESE | 76.86 | 58.53 | +18.33 | 3rd Wettest |
| Fort Myers | 52.12 | 55.93 | -3.81 | 64th Wettest / 53rd Driest |
| Inverness 3 SE | 68.65 | 51.79 | +16.86 | 6th Wettest |
| Lakeland | 78.15 | 54.79 | +23.36 | Wettest |
| Myakka Rvr St Pk | 78.82 | 59.57 | +19.25 | 3rd Wettest |
| Plant City | 68.88 | 53.56 | +15.32 | 10th Wettest |
| Punta Gorda | 63.30 | 52.02 | +11.28 | 8th Wettest |
| Sarasota-Bradenton | 48.71 | 53.01 | -4.30 | 65th Wettest / 43rd Driest |
| St. Leo | 65.58 | 54.17 | +11.41 | 16th Wettest |
| St. Petersburg | 47.99 | 50.81 | -2.82 | 58th Wettest / 45th Driest |
| Tampa | 61.48 | 46.30 | +15.18 | 13th Wettest |
| Tarpon Springs | 63.60 | 52.62 | +10.98 | 16th Wettest |
| Venice | 51.79 | 50.48 | +1.31 | 21st Wettest |
| Wauchula 2 N | 51.53 | 51.20 | +0.33 | 39th Wettest / 34th Driest |
| Winter Haven | 54.41 | 50.94 | +3.47 | 18th Wettest |
| Temperature Graphics |
||||
 |
🡰 |
Click to magnify these images, click again to resize back to original |
🡲 |
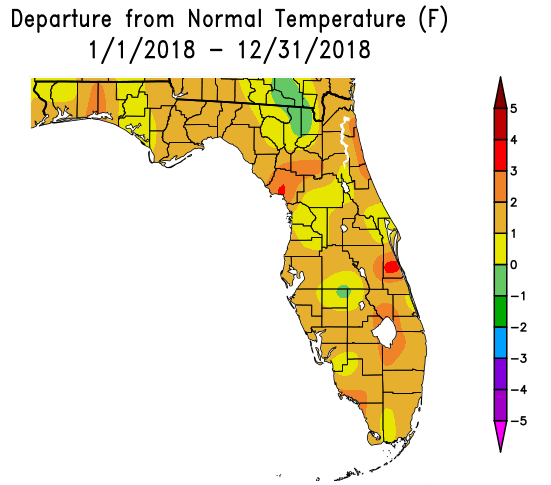 |
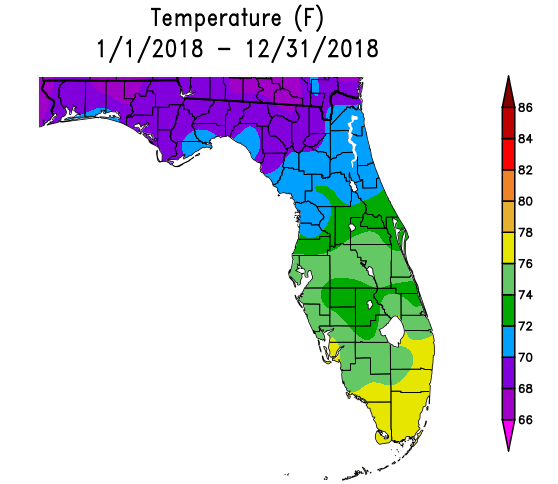
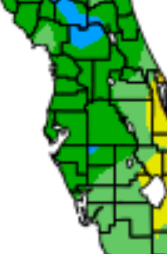
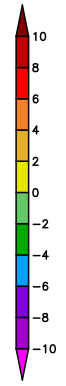
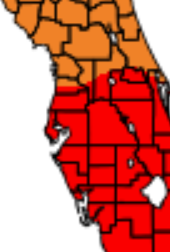
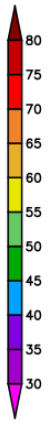
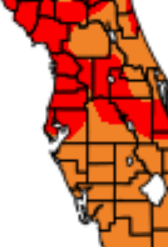
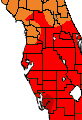
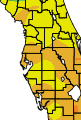
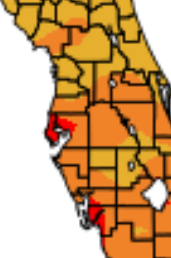
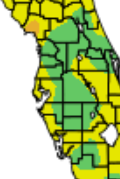
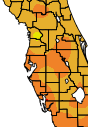
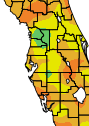
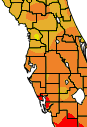
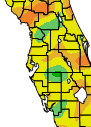
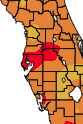
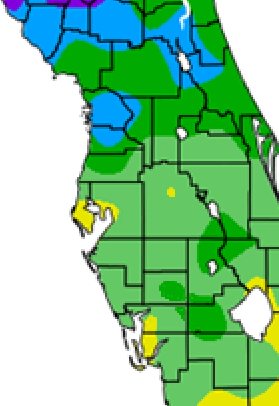
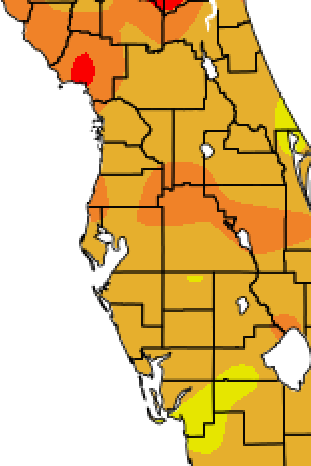
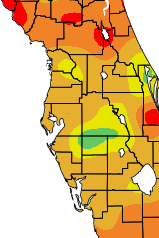
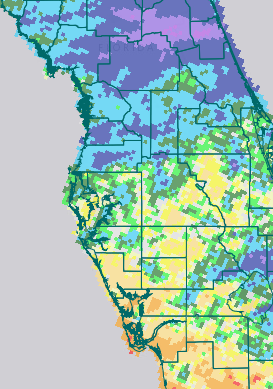
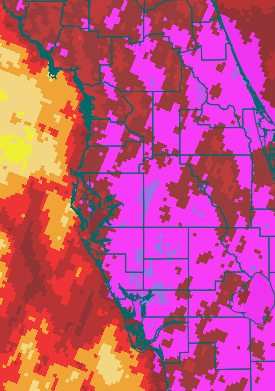
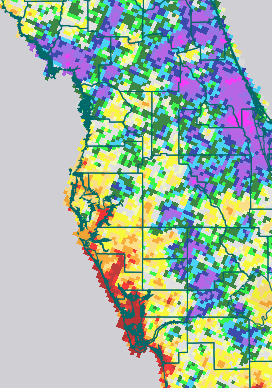
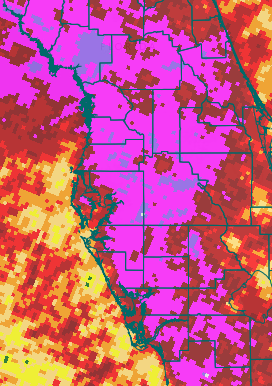
| 2018 Average Temperature (°F) | 2018 Departure from Normal (°F) | |||
 |
 |
 |
 |
 |
 |
 |
 |
|
| January Average Temp (°F) | January Dep fm Normal (°F) | February Average Temp (°F) | February Dep fm Normal (°F) | |||||
 |
|
 |
|
 |
|
 |
|
|
| March Average Temp (°F) | March Dep fm Normal (°F) | April Average Temp (°F) | April Dep fm Normal (°F) | |||||
 |
 |
 |
|
 |
 |
 |
 |
|
| May Average Temp (°F) | May Dep fm Normal (°F) | June Average Temp (°F) | June Dep fm Normal (°F) | |||||
 |
|
 |
|
 |
|
 |
|
|
| July Average Temp (°F) | July Dep fm Normal (°F) | August Average Temp (°F) | August Dep fm Normal (°F) | |||||
 |
 |
 |
|
 |
 |
 |
|
|
| September Average Temp (°F) | September Dep fm Normal (°F) | October Average Temp (°F) | October Dep fm Normal (°F) | |||||
 |
 |
 |
 |
 |
 |
 |
|
|
| November Average Temp (°F) | November Dep fm Normal (°F) | December Average Temp (°F) | December Dep fm Normal (°F) | |||||
| (Back to Top) | ||||||||
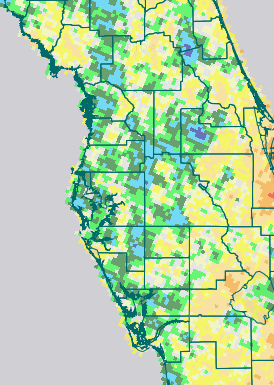
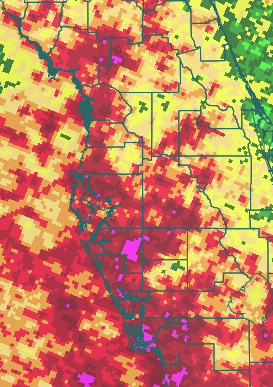
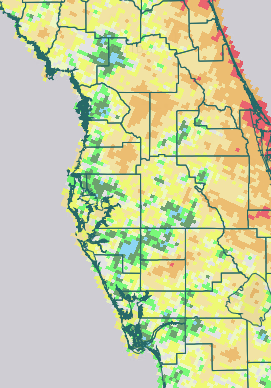
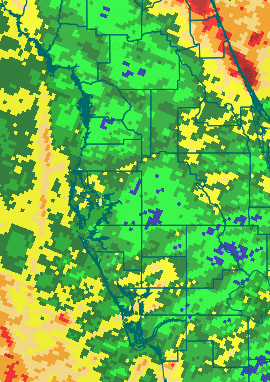
| Rainfall Graphics |
||||
 |
🡰 |
Click to magnify these images, click again to resize back to original |
🡲 |
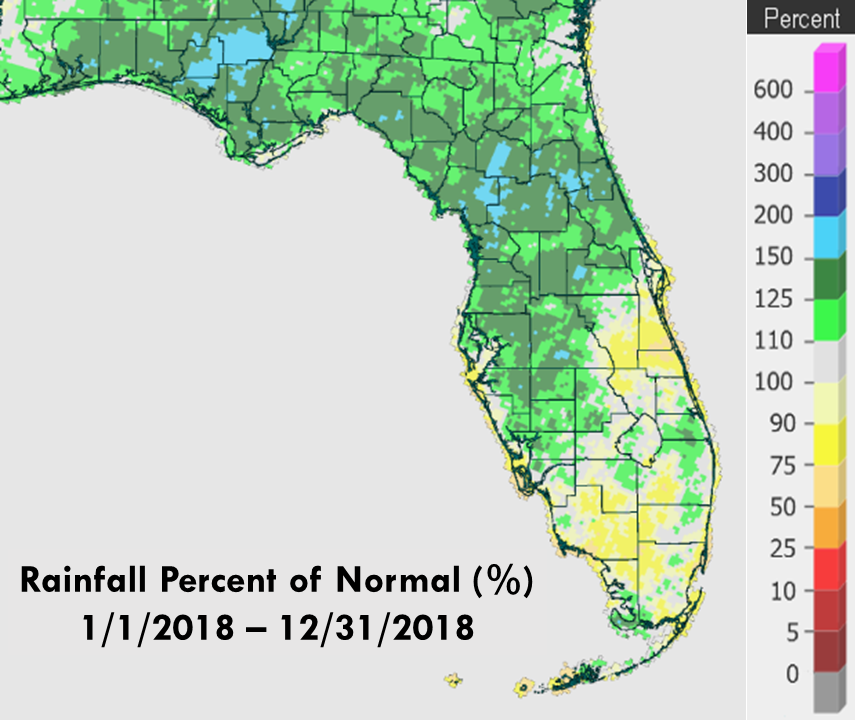 |
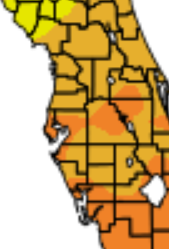
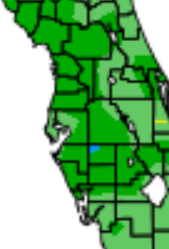
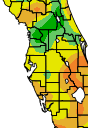
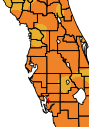
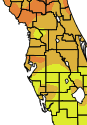
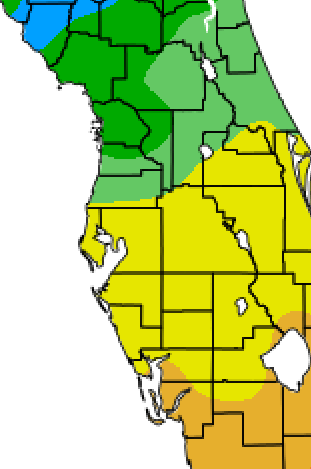
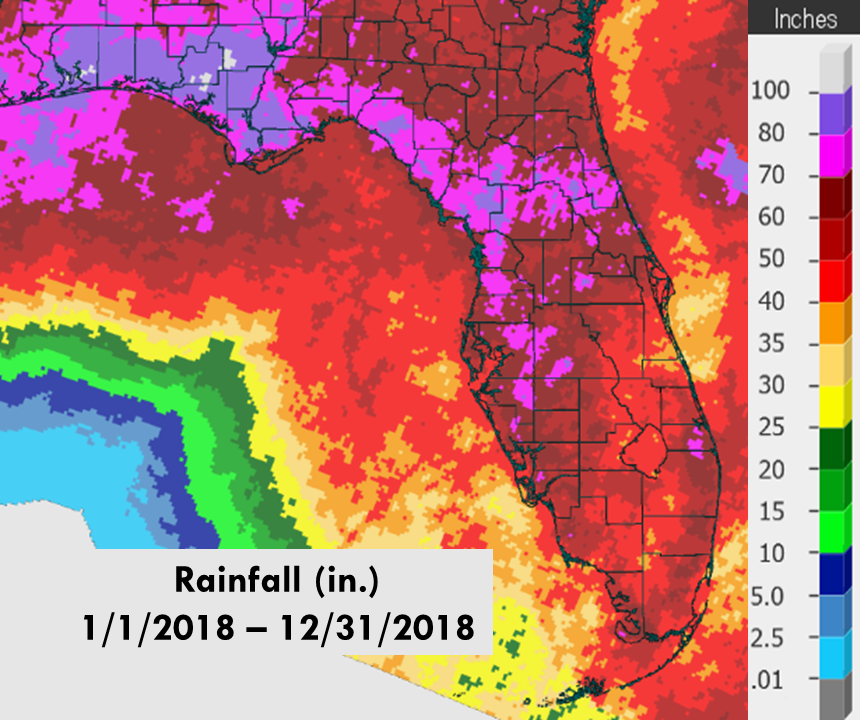
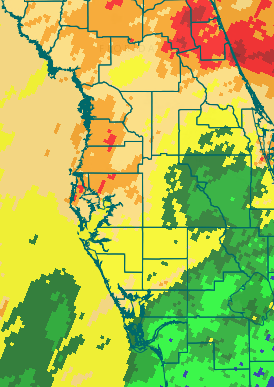
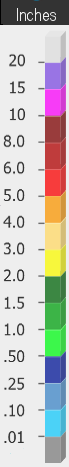
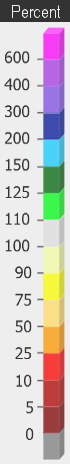
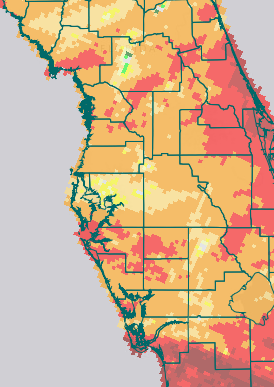
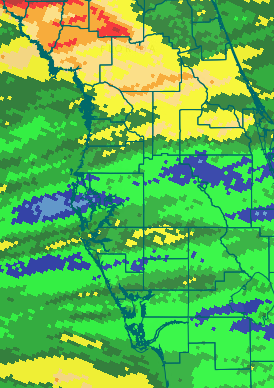
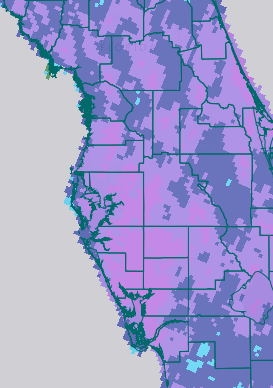
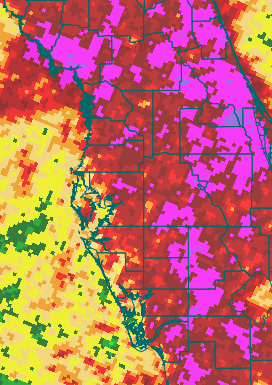
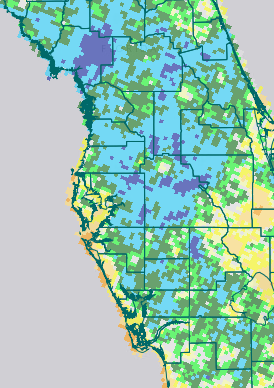
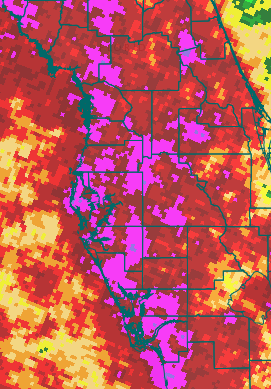
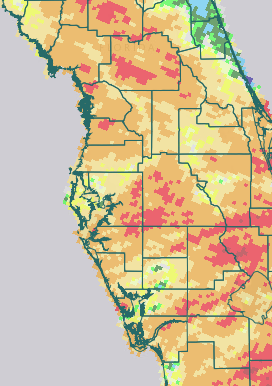
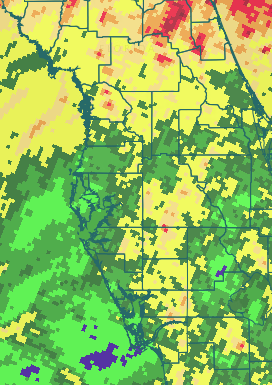
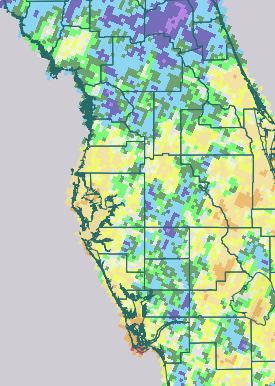
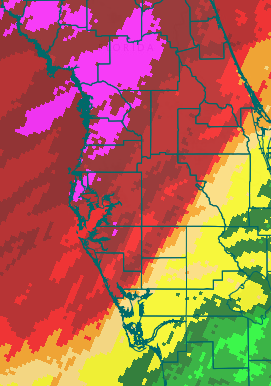
| 2018 Rainfall (in.) | 2018 Rainfall Percent of Normal (%) | |||
 |
 |
 |
 |
 |
|
 |
|
|
| January Rainfall (in.) | January Pct of Normal (%) | February Rainfall (in.) | February Pct of Normal (%) | |||||
 |
|
 |
|
 |
|
 |
|
|
| March Rainfall (in.) | March Pct of Normal (%) | April Rainfall (in.) | April Pct of Normal (%) | |||||
 |
|
 |
|
 |
|
 |
|
|
| May Rainfall (in.) | May Pct of Normal (%) | June Rainfall (in.) | June Pct of Normal (%) | |||||
 |
|
 |
|
 |
|
 |
|
|
| July Rainfall (in.) | July Pct of Normal (%) | August Rainfall (in.) | August Pct of Normal (%) | |||||
 |
|
 |
|
 |
|
 |
|
|
| September Rainfall (in.) | September Pct of Normal (%) | October Rainfall (in.) | October Pct of Normal (%) | |||||
 |
|
 |
|
 |
|
 |
|
|
| November Rainfall (in.) | November Pct of Normal (%) | December Rainfall (in.) | December Pct of Normal (%) | |||||
| (Back to Top) | ||||||||


