Days included in this study included June 1st through September 15th for the years 2002 through 2016.
1) 1200 UTC data from the Climate Forecast System Reanalysis (CFSR) and Climate Forecast System Reanalysis Version 2 (CFSRv2) for each day was downloaded and analyzed.
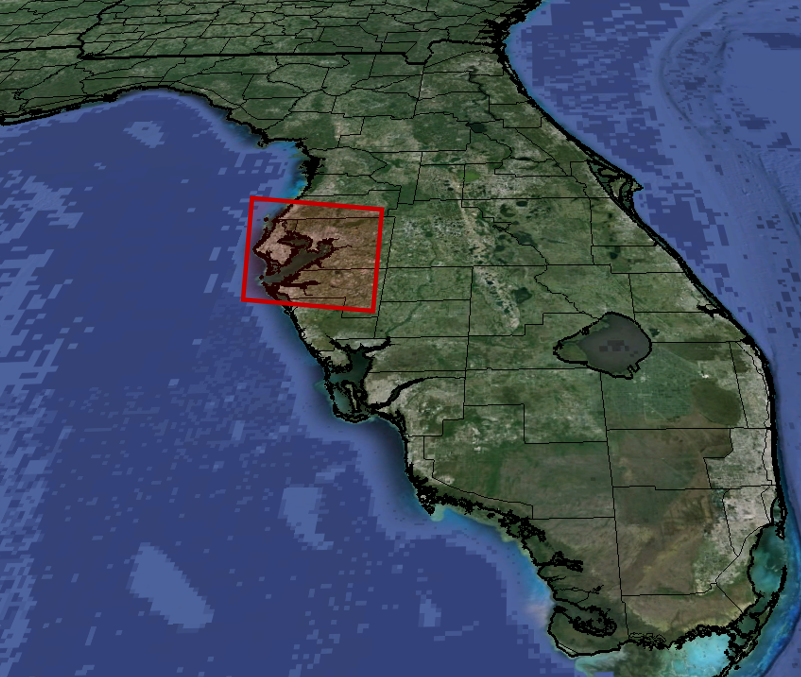
2) A mean vector wind was calculated from U and V components at each of the following levels with the red box outlined in Fig 1. The size and location of the box was chosen to be a good mid-point value in the study area. However, any location could have been chosen as the wind data is used to define a postion and strength of the subtropical ridge relative to that location.
1000mb, 925mb, 850mb, and 700mb
3) A final mean vector wind was then calculated through the 1000-700mb layer. This layer has been established from earlier Florida Sea-breeze studies to correspond best to the layer with direct interaction with the sea-breeze.
All images on this page can be magnified by clicking, and resized back to original size with a second click.
Fig 1) Fig 2)
 |
|
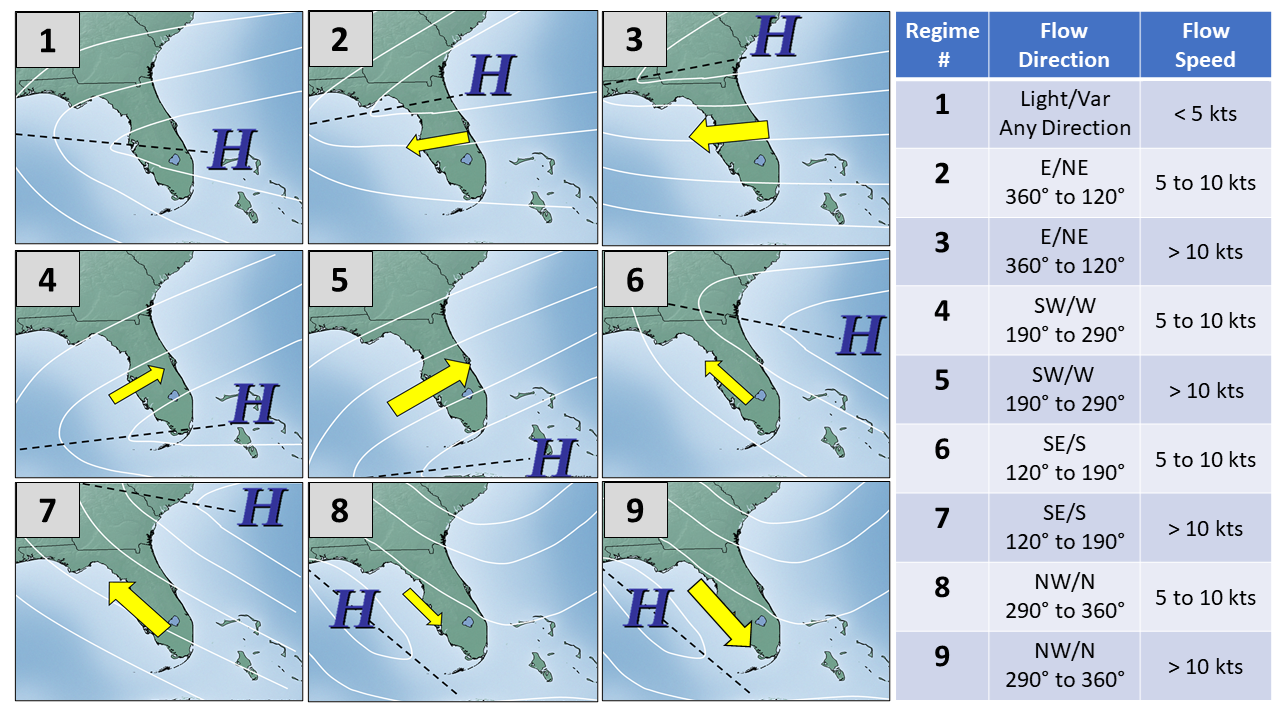
4) Based on this final mean vector wind, each day was categorized into one of eight flow regime patterns. The definitions for each flow regime, directional and speed ranges, are shown in figure 3. A 9th regime defined in figure 3 was not included in the final study due to lack of sample size. To see the number of days in this study fell into each flow regime, please see the individual flow regime tabs at the top of the page.
The day of, before and after the impacts from a tropical cyclone in the state of Florida were not included in this study.
Fig 3)
5) Next step was the download of hourly gridded Stage 4 QPE data for all days included in the study. The hourly data for each day defined to be in a particular flow regime were then grouped together.
6) Hourly grids written to a binary 1 or 0 grid based on whether each 2.5x2.5km grid recorded measurable precipitation during that hour. Measurable precipitation was defined as >= 0.02".
7) For each 2.5 x 2.5km grid box across the southeastern United States, the Probability of Precipitation (PoP), was calculated for each of the 24 hourly periods within a given day. For example, if regime #1 had 100 days in its sample set, and 40 of those days had measurable precipitation between 17UTC and 18UTC, then the PoP between 17UTC and 18UTC is 40%.
8) This same methodology was used to calculate the PoP for 3-hourly, 6-hourly, and 12-hourly time periods for each of the 8 regimes. All times are in UTC.
1-hourly: 06-07, 07-08, 08-09, 09-10, 10-11, 11-12, 12-13, 13-14, 14-15, 15-16, 16-17, 17-18, 18-19, 19-20, 20-21, 21-22, 22-23, 23-00, 00-01, 01-02, 02-03, 03-04, 05-06.
3-hourly: 06-09, 09-12, 12-15, 15-18, 18-21, 21-00, 00-03, 03-06.
6-hourly: 06-12, 12-18, 18-00, 00-06.
12-hourly: 12-00 and 00-12.
Graphics for these time-periods showing the probability of precipitation at each grid box across the state of Florida can be found by clicking the individual flow regime tabs at the top of the page.