|
|
|
|
|
| History (Back to Top) |
El Niño was originally recognized by fisherman off the coast of South America as the appearance of unusually warm water in the equatorial Pacific ocean, occurring near the beginning of the year. El Niño means The Little Boy or Christ child in Spanish. This name was used for the tendency of the phenomenon to arrive around Christmas. La Niña on the other hand means The Little Girl. La Niña is sometimes called El Viejo, anti-El Niño, or simply "a cold event" or "a cold episode". It is characterized by unusually cold ocean temperatures in the equatorial Pacific. |
| |
| El Niño happens when tropical Pacific Ocean trade winds die out and ocean temperatures become unusually warm. The flip side to El Niño called La Niña, occurs when the trade winds blow unusually hard and the sea temperature become colder than normal. El Niño and La Niña are the warm and cold phases of an oscillation we refer to as El Niño/Southern Oscillation, or ENSO, which has a period of roughly 3-7 years. Although ENSO originates in the tropical Pacific ocean-atmosphere system, it has effects on patterns of weather variability all over the world. It also affects Pacific marine ecosystems and commercially valuable fisheries such as tuna, sardines, salmon, and Peruvian anchovetta. |
| |
| El Niño/La Niña as a physical occurrence is a proven fact. The way it works is a theory (actually several different theories). It is as real as other weather phenomena: thunderstorms, for instance. We recognize its characteristics as similar to previous occurrences, and note that its life cycle is roughly the same each time. (Of course each one is different, as each thunderstorm is different, but the basic evolution is similar enough that we know an El Niño/La Niña when we see it). |
| |
| On the other hand, a difference from thunderstorms is that we have a very good idea what triggers thunderstorms, what conditions make it likely for them to occur, to the point where weather forecast models commonly pinpoint the locations and predicted severity of thunderstorms a day or so in advance. We do not have such knowledge for El Niño/La Niña. Once an El Niño/La Niña has started, we have reasonably good skill in predicting the subsequent evolution over the next 6-9 months, but before it has started we have very little skill in predicting the onset before the event has become obvious. There are a variety of theories for why they start, but none of them has given us real skill in making a forecast in advance, the way we can for thunderstorms. |
| |
| However, there is still plenty of social utility in predicting the evolution of an El Niño after it starts, since that gives 6 months or so warning before the effects come to the US. For instance, a weak to moderate El Niño started earlier this year, and that enables forecasters to predict that the coming winter is likely to be warmer than normal across the northern states, and wetter than normal along the Gulf Coast. |
| |
A much more detailed description of El Niño/Southern Oscillation (ENSO) can be found on the Climate Prediction Center ENSO Cycle page.
|
|
|
| Current Conditions (Back to Top) |
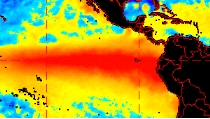
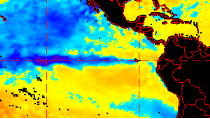
The latest assessment of sea surface temperatures in the tropical Pacific by the Climate Prediction Center indicates that La Niña conditions are occurring. As seen in the image below, the current anomalies do show indications of cooler than normal sea surface temperatures across the central Pacific Ocean. |

Link to Operational SST Anomaly Charts
|
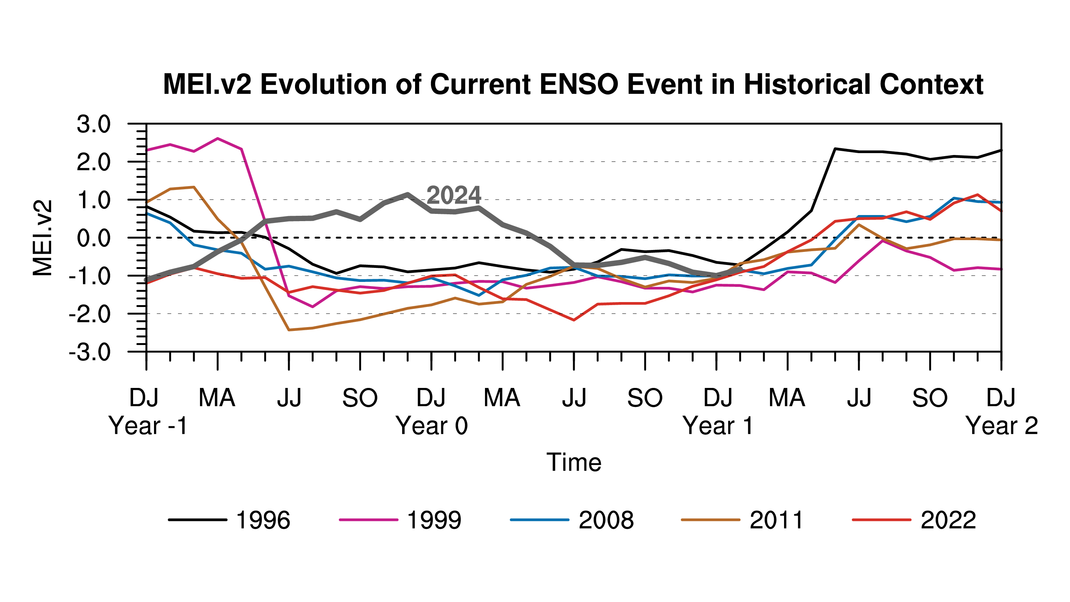
| A good way to monitor the El Niño/Southern Oscillation (ENSO) is through the use of the Multivariate ENSO Index (MEI). The new version of the MEI (MEI.v2) uses 5 variables (sea level pressure (SLP), sea surface temperature (SST), surface zonal winds (U), surface meridional winds (V), and Outgoing Longwave Radiation (OLR)) to produce a time series of ENSO conditions from 1979 to present. The MEI.v2 expands upon the original MEI developed by Wolter and Timlin (1993) which was calculated using 6 variables as proxies for ENSO relevant atmosphere and ocean conditions. Positive values of the MEI represent the warm ENSO phase (El Niño) while the negative MEI values represent the cold ENSO phase, (La Niña). As seen below the MEI is currently below -1 indicating La Niña conditions. |

Link to Multivariate ENSO Index
|
| A comparison of this year with similar ENSO events indicates that La Niña conditions will likely persist through this Winter into Spring 2021. |
|
|
| Forecast (Back to Top) |
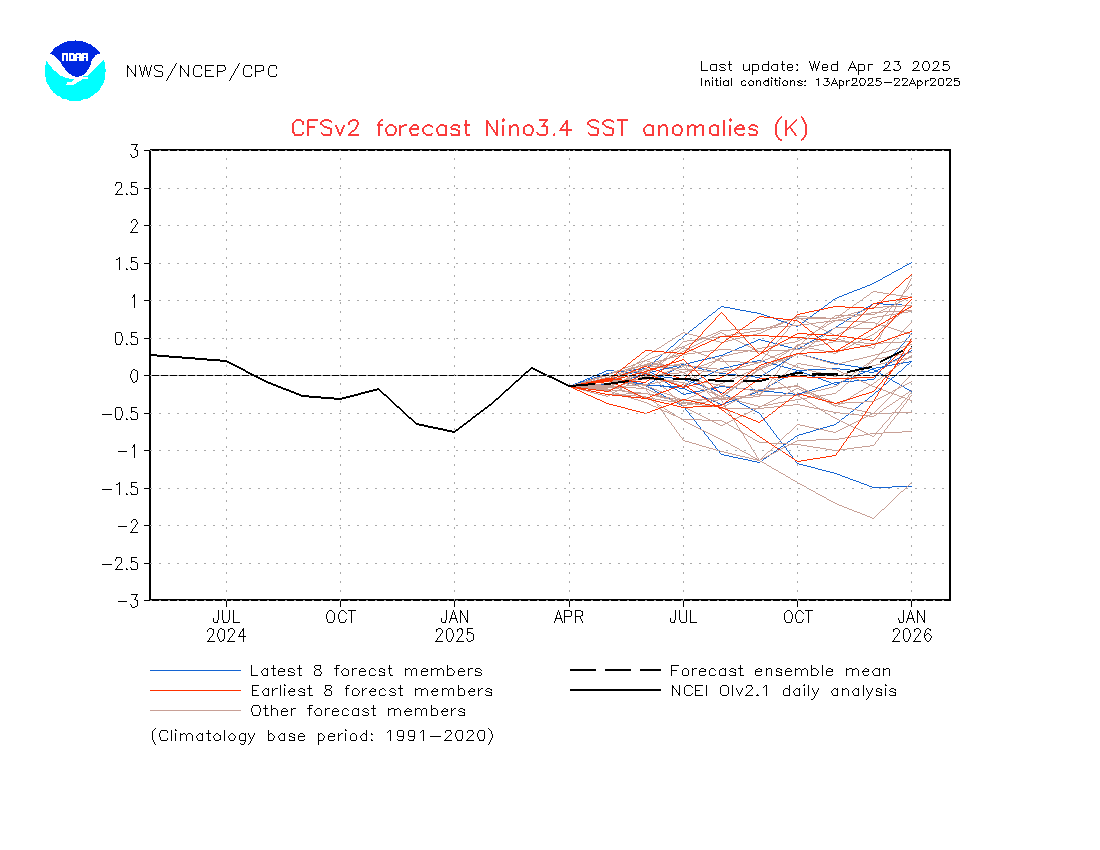
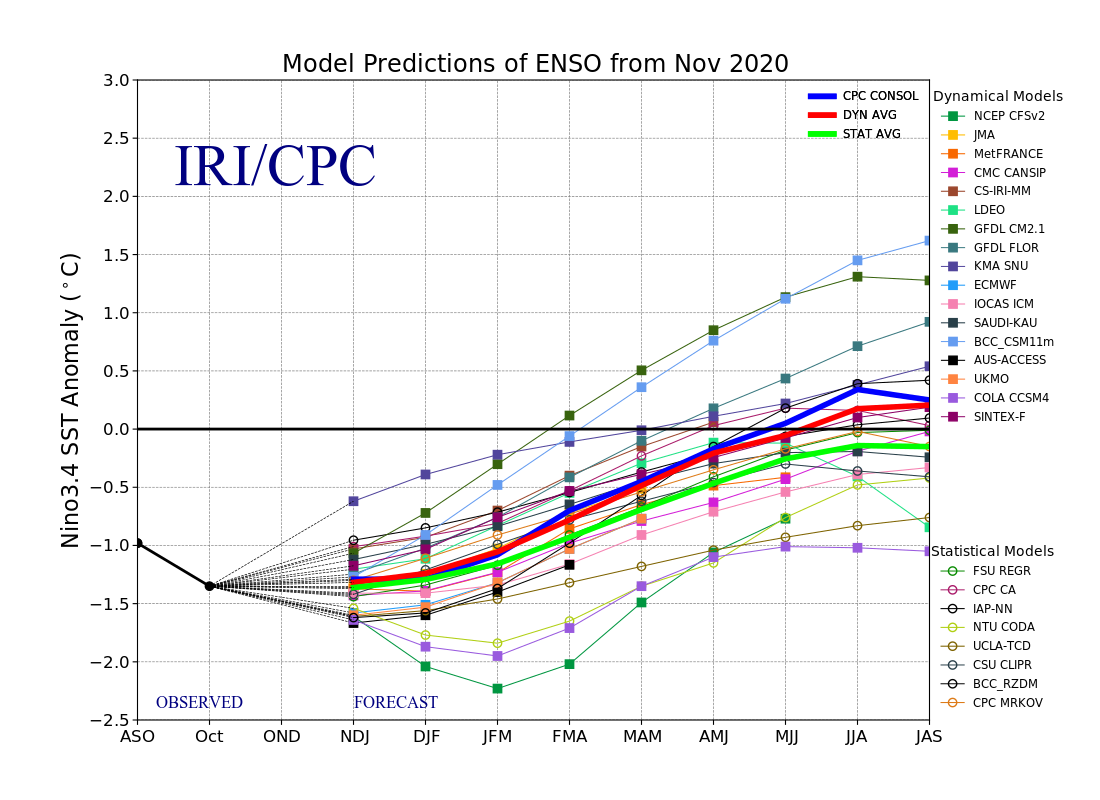
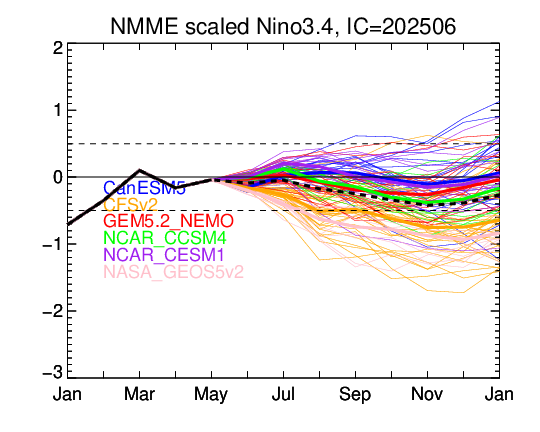
The latest assessment of sea surface temperatures in the tropical Pacific by the Climate Prediction Center indicates that there is a ~95% chance of La Niña conditions through the upcoming Winter and ~65% chance of it continuing into Spring 2021. This forecast is based on predictions from the latest NCEP Climate Forecast System (CFS), first image below, as well as in the dynamical model averages of the IRI/CPC plume, second image below, and the North American Multi-Model Ensemble (NMME), third image below.
In order to be considered an El Niño/La Niña episode the sea surface temperature anomalies in the Niño 3.4 region have to at least meet the criteria listed below, and then remain at or above/below these levels for at least five consecutive months to be considered an El Niño/La Niña event.
- El Niño = SST anomaly greater than or equal to +0.5 degrees C
- Neutral = SST anomaly between -0.5 and +0.5 degrees C
- La Niña = SST anomaly lesser than or equal to -0.5 degrees C
A more defined definition of El Niño/La Niña although not totally etched in stone is listed below.
- Strong El Niño = SST anomaly greater than or equal to +1.5 degrees C
- Moderate El Niño = SST anomaly between +1.0 and +1.4 degrees C
- Weak El Niño = SST anomaly between +0.5 and +0.9 degrees C
- Strong La Niña = SST anomaly less than or equal to -1.5 degrees C
- Moderate La Niña = SST anomaly between -1.0 and -1.4 degrees C
- Weak La Niña = SST anomaly between -0.5 and -0.9 degrees C
Therefore, using this criteria, it can be seen in the images below that La Niña conditions are expected through the Winter with the possibility of Strong La Niña conditions developing. |
 |
 |
|
|
| Effect on U.S. Weather (Back to Top) |
What Effect Does El Niño/La Niña Have On Our Weather? |
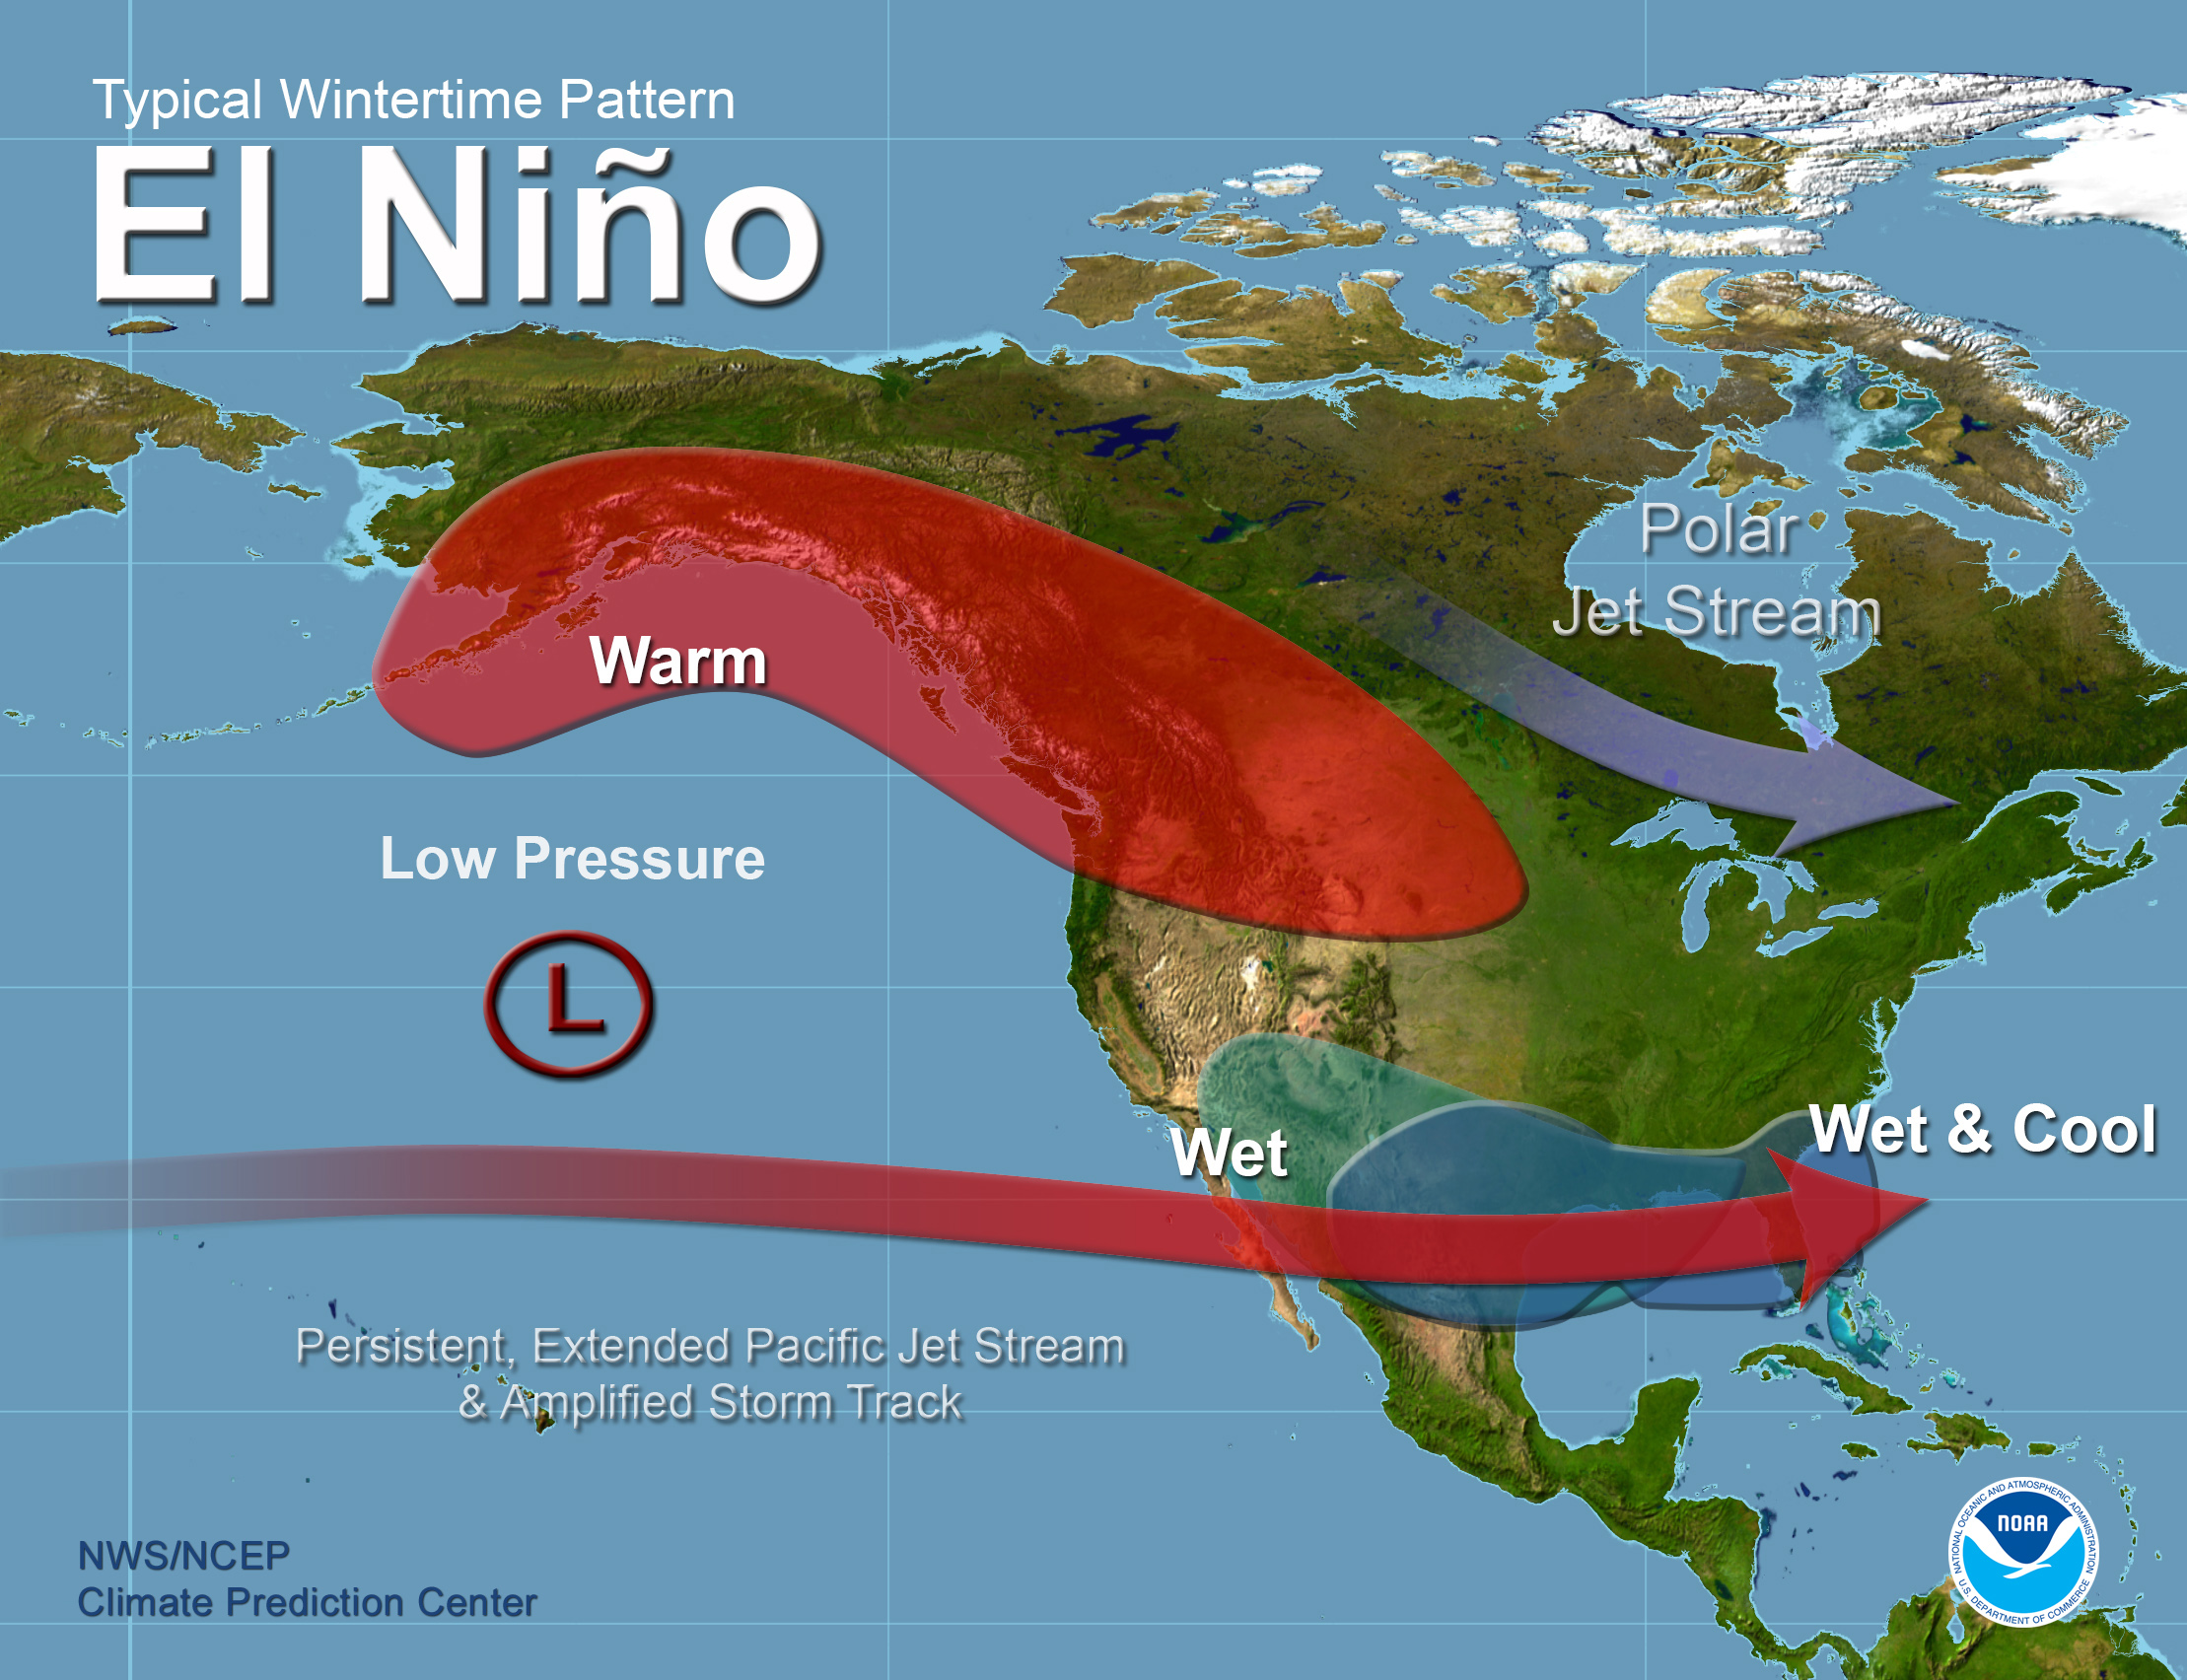
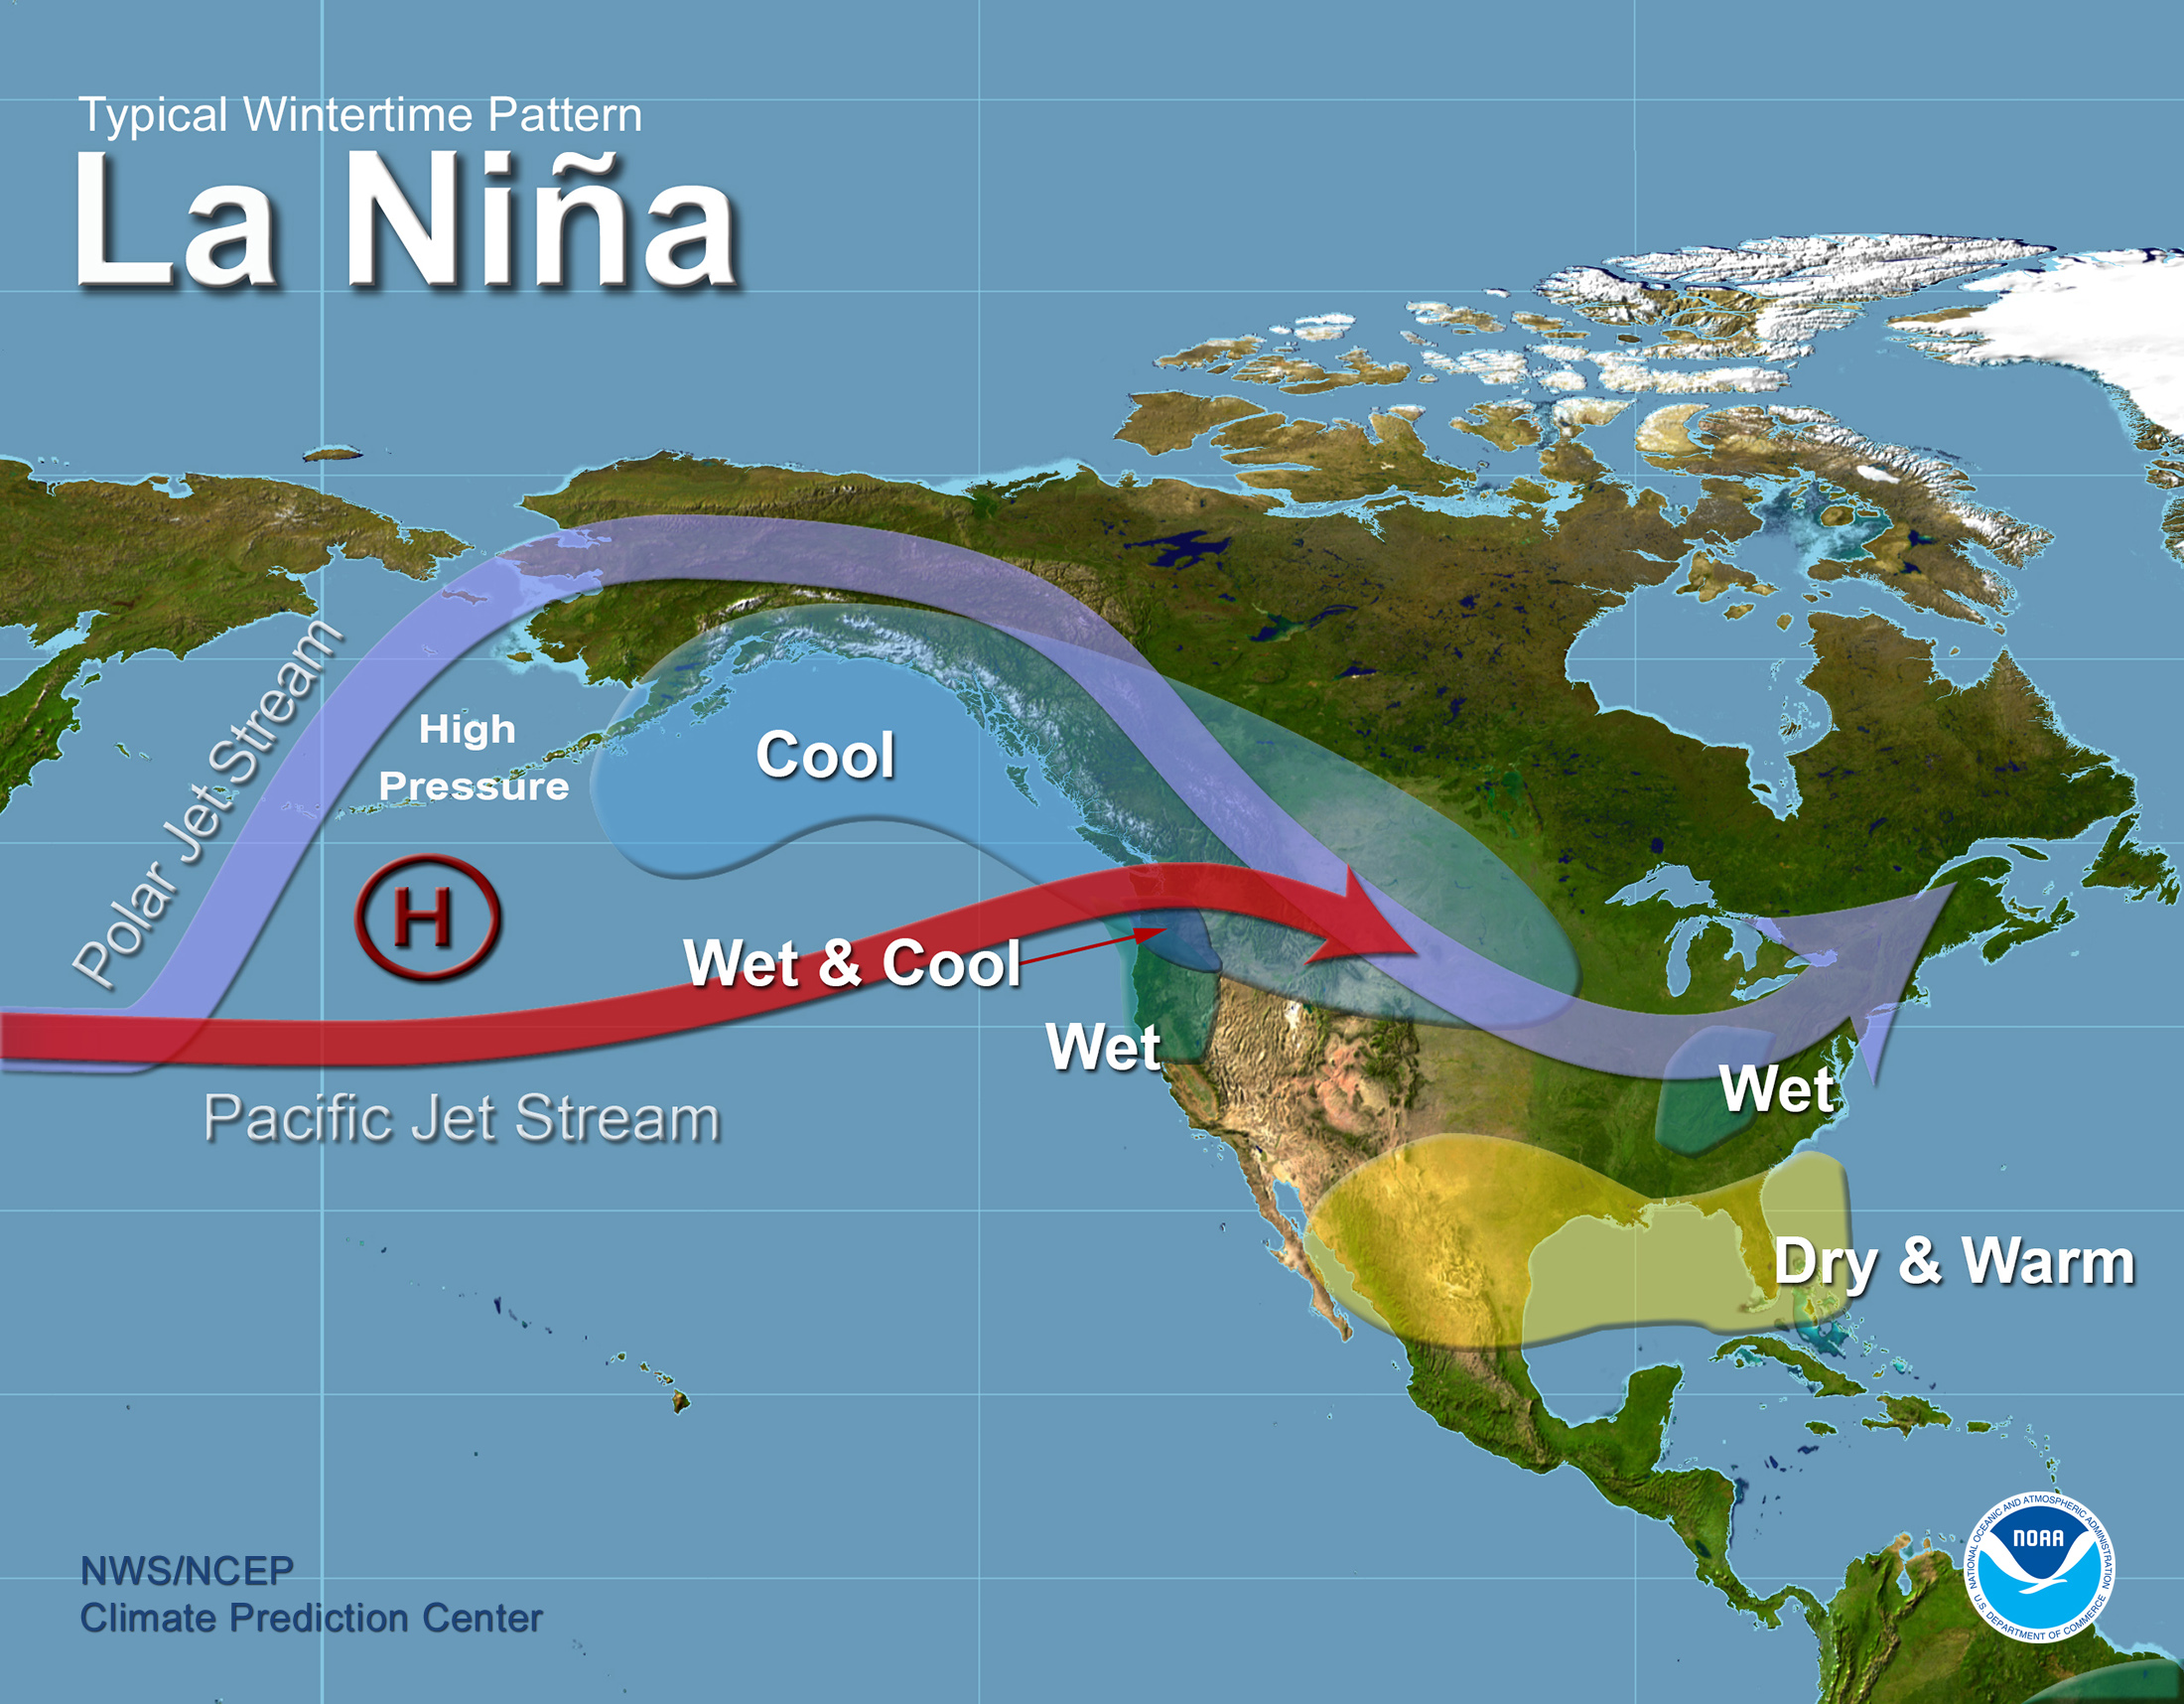
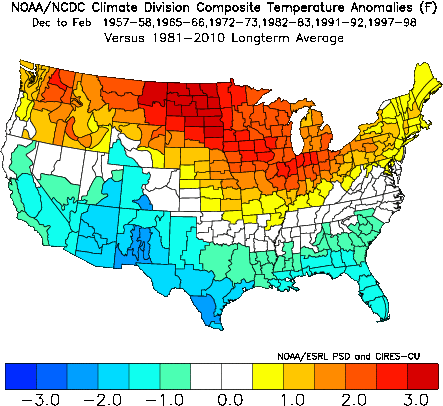
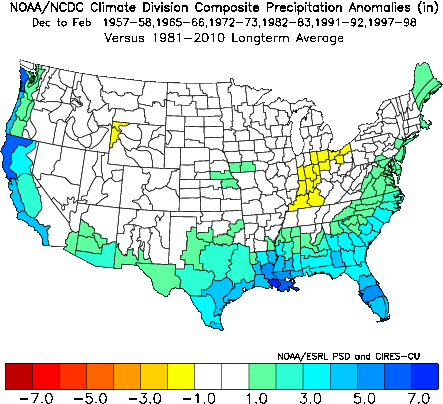
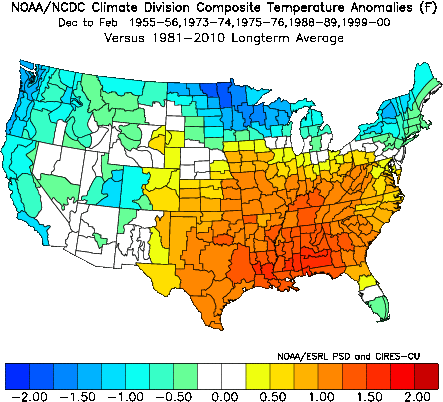
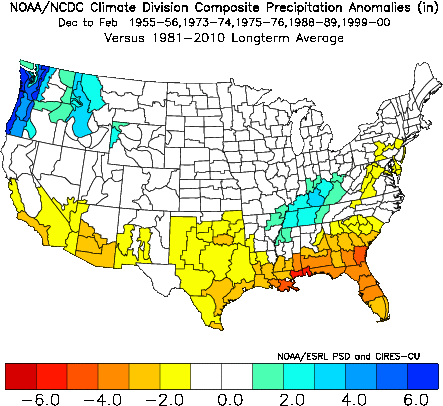
In general, winter El Niño episodes (top map) feature a strong jet stream and storm track across the southern part of the United States, and less storminess and milder-than-average conditions across the North. La Niña episodes (bottom map) feature a very wave-like jet stream flow over the United States and Canada, with colder and stormier than average conditions across the North, and warmer and less stormy conditions across the South.
|
 |
|
This information can be verified by looking at the Composite Temperature and Precipitation Anomaly maps for the strongest El Niño and La Niña events displayed below.
|
| El Niño Events |
|
|
| La Niña Events |
|
|
|
| Yearly Anomalies (Back to Top) |
Sea surface temperature anomalies in the Niño 3.4 region (5°N-5°S, 120°-170°W) of the eastern and central equatorial Pacific Ocean based on the 1981-2010 base period were obtained from the Climate Prediction Center back through 1950. They were then averaged over the five month period from October to February each year. Local analysis of the anomalies led to breaking the data into the seven ENSO groups listed below.
- Strong El Niño (Average anomaly greater than or equal to 1.5 degrees C)
- Moderate El Niño (Average anomaly between +1.0 and +1.4 degrees C)
- Weak El Niño (Average anomaly between +0.5 and +0.9 degrees C)
- Neutral (Average anomaly between -0.4 and +0.4 degrees C)
- Weak La Niña (Average anomaly between -0.5 and -0.9 degrees C)
- Moderate El Niña (Average anomaly between -1.0 and -1.4 degrees C)
- Strong La Niña (Average anomaly less than or equal to -1.5 degrees C)
Using these breakups for the October through February time period, the years since December 1950 that fall into each category are listed below (the average anomaly based on 1981-2010 normals is in parentheses):
|
| Strong El Niño |
| 2016 (+2.4) |
| 1998 (+2.3) |
| 1983 (+2.0) |
| 1973 (+1.9) |
| 1966 (+1.8) |
| 1958 (+1.5) |
| |
| |
| |
| |
| |
| |
| |
| |
| |
| |
| |
| |
| |
| |
|
| Moderate El Niño |
| 1988 (+1.3) |
| 1964 (+1.3) |
| 2010 (+1.2) |
| 1992 (+1.2) |
| 2003 (+1.1) |
| 1987 (+1.0) |
| |
| |
| |
| |
| |
| |
| |
| |
| |
| |
| |
| |
| |
| |
|
| Weak El Niño |
| 1995 (+0.9) |
| 1952 (+0.9) |
| 1977 (+0.8) |
| 1969 (+0.8) |
| 1954 (+0.8) |
| 2019 (+0.7) |
| 2007 (+0.7) |
| 2005 (+0.7) |
| 1978 (+0.7) |
| 1970 (+0.7) |
| 2015 (+0.5) |
| 1980 (+0.5) |
| 1959 (+0.5) |
| |
| |
| |
| |
| |
| |
| |
|
| Neutral |
| 2004 (+0.4) |
| 1991 (+0.4) |
| 1953 (+0.2) |
| 1994 (+0.1) |
| 1961 (+0.1) |
| 2013 (0.0) |
| 1960 (0.0) |
| 1993 (-0.1) |
| 1990 (-0.1) |
| 1982 (-0.1) |
| 1981 (-0.1) |
| 1979 (-0.2) |
| 1967 (-0.2) |
| 1962 (-0.2) |
| 2014 (-0.3) |
| 2002 (-0.3) |
| 1963 (-0.3) |
| 2020 (-0.4) |
| 1986 (-0.4) |
| 1968 (-0.4) |
|
| Weak La Niña |
| 1996 (-0.9) |
| 1972 (-0.9) |
| 1985 (-0.8) |
| 1984 (-0.8) |
| 1965 (-0.8) |
| 1955 (-0.8) |
| 2018 (-0.7) |
| 2017 (-0.6) |
| 2009 (-0.6) |
| 2001 (-0.6) |
| 1975 (-0.6) |
| 1951 (-0.6) |
| 2006 (-0.5) |
| 1997 (-0.5) |
| |
| |
| |
| |
| |
| |
|
| Moderate La Niña |
| 2008 (-1.4) |
| 1956 (-1.4) |
| 2012 (-1.0) |
| 1971 (-1.0) |
| |
| |
| |
| |
| |
| |
| |
| |
| |
| |
| |
| |
| |
| |
| |
| |
|
| Strong La Niña |
| 1974 (-1.8) |
| 2011 (-1.6) |
| 1989 (-1.6) |
| 2000 (-1.5) |
| 1999 (-1.5) |
| 1976 (-1.5) |
| |
| |
| |
| |
| |
| |
| |
| |
| |
| |
| |
| |
| |
| |
|
|
| Note: 1951 represents December 1950 through April 1951, etc. |
|
The data shows that since 1950 the winter/early spring with the strongest El Niño was 2016, while the strongest La Niña was 1974.
|
|
| Local Effect on Temperature (Back to Top) |
Temperature data was broken up by month and by event, based on the locally derived El Niño/La Niña yearly anomalies above, for six stations in west central and southwest Florida: Inverness, Tampa, Lakeland, Sarasota-Bradenton, Arcadia, and Fort Myers. The monthly average temperature graphs for these sites are linked below: |
|
|
The results show that:
- Strong El Niño events, temperatures were above average in December then near to below average for January through March.
- Weak to Moderate El Niño events, temperatures were generally near to slightly below average December through March.
- Strong La Niña events, temperatures were below average in December then generally near to slightly above average for January through March.
- Weak to Moderate La Niña events, temperatures generally slightly above average December through March.
|
To get a better picture, the anomalies were separated into high temperature anomalies and low temperature anomalies. These graphs are linked below. |
|
|
| These charts show that the effects of El Niño on temperatures really sets in during January and February when the temperatures generally average below normal. The high temperatures are much farther below normal than the low temperatures during moderate to strong El Niño years. This result indicates significant cloudiness is present, keeping daytime temperatures low while preventing overnight temperatures from becoming too cold. In fact, Tampa has on average 34 percent more cloud cover during strong El Niño events than during strong La Niña events. The additional cloudiness is likely due to a combination of more storms affecting the area as well as a stronger jet stream carrying high clouds across the area from the Pacific Ocean. |
Temperature anomalies during moderate to strong La Niña years are linked below: |
|
|
These graphs show the opposite tendencies of moderate to strong El Niño years: i.e. high temperatures are more above normal than low temperatures. This indicates much less cloudiness during moderate to strong La Niña years, allowing for significant solar warming during the day and radiational cooling at night.
|
|
| Local Effect on Freezes (Back to Top) |
Freeze data was broken up by cool season (October through the following April), based on the locally derived El Niño/La Niña yearly anomalies listed above, for six stations in west central and southwest Florida: Inverness, Tampa, Lakeland, Sarasota-Bradenton, Arcadia, and Fort Myers. Freezes per Cool Season by ENSO Category for these stations are linked below. |
|
|
| As the results show, freezes occur more often than normal in February during strong El Niño years. Interestingly enough there are also above normal freezes in February during strong La Niña events in the central part of the state. |
| |
| For the strong El Niño events, the likely cause for the greater than normal amount of freezes in February is the abnormally strong storms that pass through and to the north of Florida. This causes cold air to be dragged southward behind the storms into the state (advective freezes). |
| |
For the strong La Niña events, the likely cause is radiational cooling under clear skies with calm wind conditions (radiational freezes).
|
|
| Local Effect on Rainfall (Back to Top) |
Rainfall data was broken up by month and by event, based on the locally derived El Niño/La Niña yearly anomalies above, for six stations in west central and southwest Florida: Inverness, Tampa, Lakeland, Sarasota-Bradenton, Arcadia, and Fort Myers. The monthly average rainfall graphs for these sites are linked below: |
|
|
| What stands out most clearly is that the rainfall is well above normal in December through March during moderate to strong El Niño years, and well below normal during the same months in moderate to strong La Niña years. |
|
|
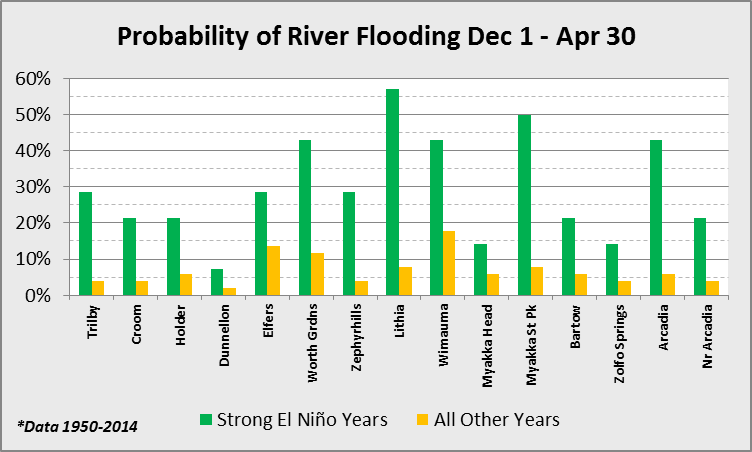
| Local Effect on River Flooding (Back to Top) |
Obviously, if there is more rain during El Niño years, there is also likely to be more flooding on area rivers. The December through April river flooding graph below does indicate that during strong El Niño years vs. all other years (since December 1950) that most locations do flood more, some up to twice as often, in the winter and spring of strong El Niño years than all other conditions combined.
|
|
|
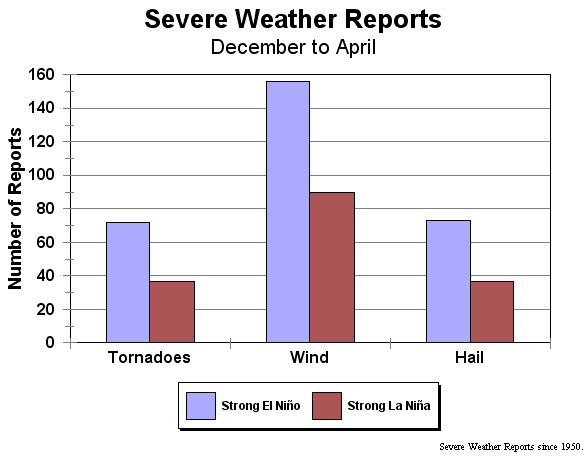
| Local Effect on Severe Weather (Back to Top) |
Across Florida El Niño causes increased storminess which can also mean an increase in the amount of severe weather thanks to the frequent cold fronts moving across the state along with the stronger upper level jet stream. |
| |
Based on the locally derived El Niño/La Niña yearly anomalies, the graph below of December through April Severe Weather during strong El Niño years vs. strong La Niña years (since December 1950) shows that west central and southwest Florida does experience severe weather (i.e. tornadoes, strong damaging winds, and hail) up to twice as often in the winter and spring during strong El Niño conditions than during strong La Niña conditions.
|
|
|
| Local Effect on Tropical Systems (Back to Top) |
To examine the correlation between El Niño/La Niña events and tropical systems that affect west central and southwest Florida, we need to calculate the anomalies for the Atlantic hurricane season averaged over the five month period from May to November each year. Using the same El Niño/La Niña category break down as listed on theYearly Anomalies section above, the results were as follows:
|
| Strong El Niño |
| 2015 (+2.0) |
| 1997 (+2.0) |
| 1987 (+1.6) |
| 1965 (+1.6) |
| 1972 (+1.5) |
| |
| |
| |
| |
| |
| |
| |
| |
| |
| |
| |
| |
| |
| |
| |
| |
| |
| |
| |
| |
| |
| |
| |
| |
|
| Moderate El Niño |
| 1982 (+1.4) |
| 1957 (+1.3) |
| 1963 (+1.1) |
| 2002 (+1.0) |
| |
| |
| |
| |
| |
| |
| |
| |
| |
| |
| |
| |
| |
| |
| |
| |
| |
| |
| |
| |
| |
| |
| |
| |
| |
|
| Weak El Niño |
| 1951 (+0.9) |
| 1953 (+0.8) |
| 2009 (+0.7) |
| 1991 (+0.7) |
| 2004 (+0.6) |
| 1986 (+0.6) |
| 1969 (+0.6) |
| 1994 (+0.5) |
| 1977 (+0.5) |
| 1976 (+0.5) |
| 1968 (+0.5) |
| 1958 (+0.5) |
| |
| |
| |
| |
| |
| |
| |
| |
| |
| |
| |
| |
| |
| |
| |
| |
| |
|
| Neutral |
| 2006 (+0.4) |
| 1990 (+0.4) |
| 2012 (+0.3) |
| 2014 (+0.2) |
| 2003 (+0.2) |
| 1993 (+0.2) |
| 1979 (+0.2) |
| 1960 (+0.2) |
| 1980 (+0.1) |
| 1966 (+0.1) |
| 1992 (0.0) |
| 1952 (0.0) |
| 2005 (-0.1) |
| 1962 (-0.1) |
| 1961 (-0.1) |
| 1959 (-0.1) |
| 2001 (-0.2) |
| 1981 (-0.2) |
| 1967 (-0.2) |
| 2017 (-0.3) |
| 2013 (-0.3) |
| 2008 (-0.3) |
| 1996 (-0.3) |
| 1989 (-0.3) |
| 1984 (-0.3) |
| 1983 (-0.3) |
| 1985 (-0.4) |
| 1978 (-0.4) |
| 1950 (-0.4) |
|
| Weak La Niña |
| 2011 (-0.8) |
| 1971 (-0.8) |
| 1954 (-0.8) |
| 1970 (-0.7) |
| 1964 (-0.7) |
| 2016 (-0.6) |
| 2000 (-0.6) |
| 1995 (-0.6) |
| 1974 (-0.5) |
| 1956 (-0.5) |
| |
| |
| |
| |
| |
| |
| |
| |
| |
| |
| |
| |
| |
| |
| |
| |
| |
| |
| |
|
| Moderate La Niña |
| 2010 (-1.4) |
| 1973 (-1.4) |
| 1988 (-1.3) |
| 1975 (-1.3) |
| 1999 (-1.2) |
| 1998 (-1.1) |
| 2007 (-1.0) |
| 1955 (-1.0) |
| |
| |
| |
| |
| |
| |
| |
| |
| |
| |
| |
| |
| |
| |
| |
| |
| |
| |
| |
| |
| |
|
|
|
| Note: 1950 represents May 1950 through November 1950, etc. |
|
Notice that the 2015 and 1997 hurricane seasons saw the strongest El Niño during this study while 2010 and 1973 saw the strongest La Niña. Based on these categories, a graph of the tropical systems that affect west central and southwest Florida per year for each category is linked below.
There is clearly less activity during strong El Niño years than other years in this study. However, the overall relationship between El Niño/La Niña events and the tropical activity over west central and southwest Florida is not as clear cut. Even though from 1951 to 2005 a total of 16 hurricanes, 20 tropical storms, and 10 tropical depressions crossed over or near part of the area, the 55 year period of record is relatively short. While there is certainly a trend evident in the data, it would need to be done over a longer time period to be more statistically significant. Tropical landfalls were also compared to the event of the previous winter/spring (i.e. comparing the category of El Niño/La Niña in December to April to the following hurricane season). The results are shown in the graph below.
Interestingly enough, there is little overall difference on whether the previous winter was a strong/weak El Niño to weak La Niña, but there is a lower occurrence following a strong La Niña. Note: All tropical systems whose center made landfall and/or crossed our area were included in this study, along with those that had some effect on any part of west central and southwest Florida. For example, although Hurricane Wilma in October of 2005 made landfall south of our area, it was included in the study because it had some effects within our area of interest.
|
|
Climate Prediction Center
|
| NOAA
|
| ESRL (Earth System Research Laboratory) formerly Climate Diagnostics Center
|
| Others
|
|
|
|