| Autumn Began September 22nd, So When Does It Usually Cool Off across West Central and Southwest Florida? |
||
| Updated September 16, 2025 | ||
Astronomically speaking, autumn began at 2:19 PM EDT on Monday September 22nd. Across West Central and Southwest Florida, however, the temperatures are anything but fall-like. Usually high humidity with dew points in the middle 60s to middle 70s, along with high temperatures in the mid 80s to lower 90s persist well into October. The first shot of cooler drier air is usually rather short lived - lasting only a day or two. The real cool down doesn't usually occur until November. A good way to examine the timing of the first cool down is by looking at overnight low temperatures which are highly dependent on a few factors, not the least being the amount of moisture in the air near the ground, along with the amount of cloud cover and winds. The amount of moisture is determined by looking at the dew point. In general, overnight low temperatures cannot fall below the dew point. Therefore, if the dew points are still in the middle 60s to middle 70s, then the overnight low temperatures are also likely to be in the mid 60s to mid 70s unless a cool front moves through during the night. To see when the first cool front typically moves across the region, the long-term mean dates of specific low temperature thresholds since consistent records began are listed below. Examining the tables and maps below, the long-term mean date of the first shot of cooler drier air appears to be during mid-October. This is when temperatures generally fall into the mid 50s across inland portions of the Nature Coast and below 60 degrees elsewhere across West Central and Southwest Florida. The only exception is near the coast, where the water keeps temperatures higher and these areas take longer to fall below 60 degrees. |
| Click on a "Site" name below for a detailed graph at each location. |
Left click an image to magnify, click a second time to return to original size. |
|
|
|||||||||||||||||||||||||||||||||||||||||||||||||||||||||||||||||||||||||||||||||||||||||||||||||||||||||||||||||||||||||||||||||||||||||||||||||||||||||||||||||||||||||||||||||||||||||||||||||||||||||||||||||||||||||||||||||||||||||||||||||||||||||||||||||||||||||||||||||||||||||||||||||||||||||||||||||||||||||||||||||||||||||||||||||||||||||||||||||||||||||||||||||||||||||||||||||||||||||||||||||||||||||||||||||||||||||||||||||||||||||||||||||||||||||||||||||||||||||||||||||||||||||||||||||||||||||||||||||||||||||||||||||||||||||||||||||||||||||||||||||||||||||||||||||||||||||||||||||||||||||||||||||||||||||||||||||||||||||||||||||||||
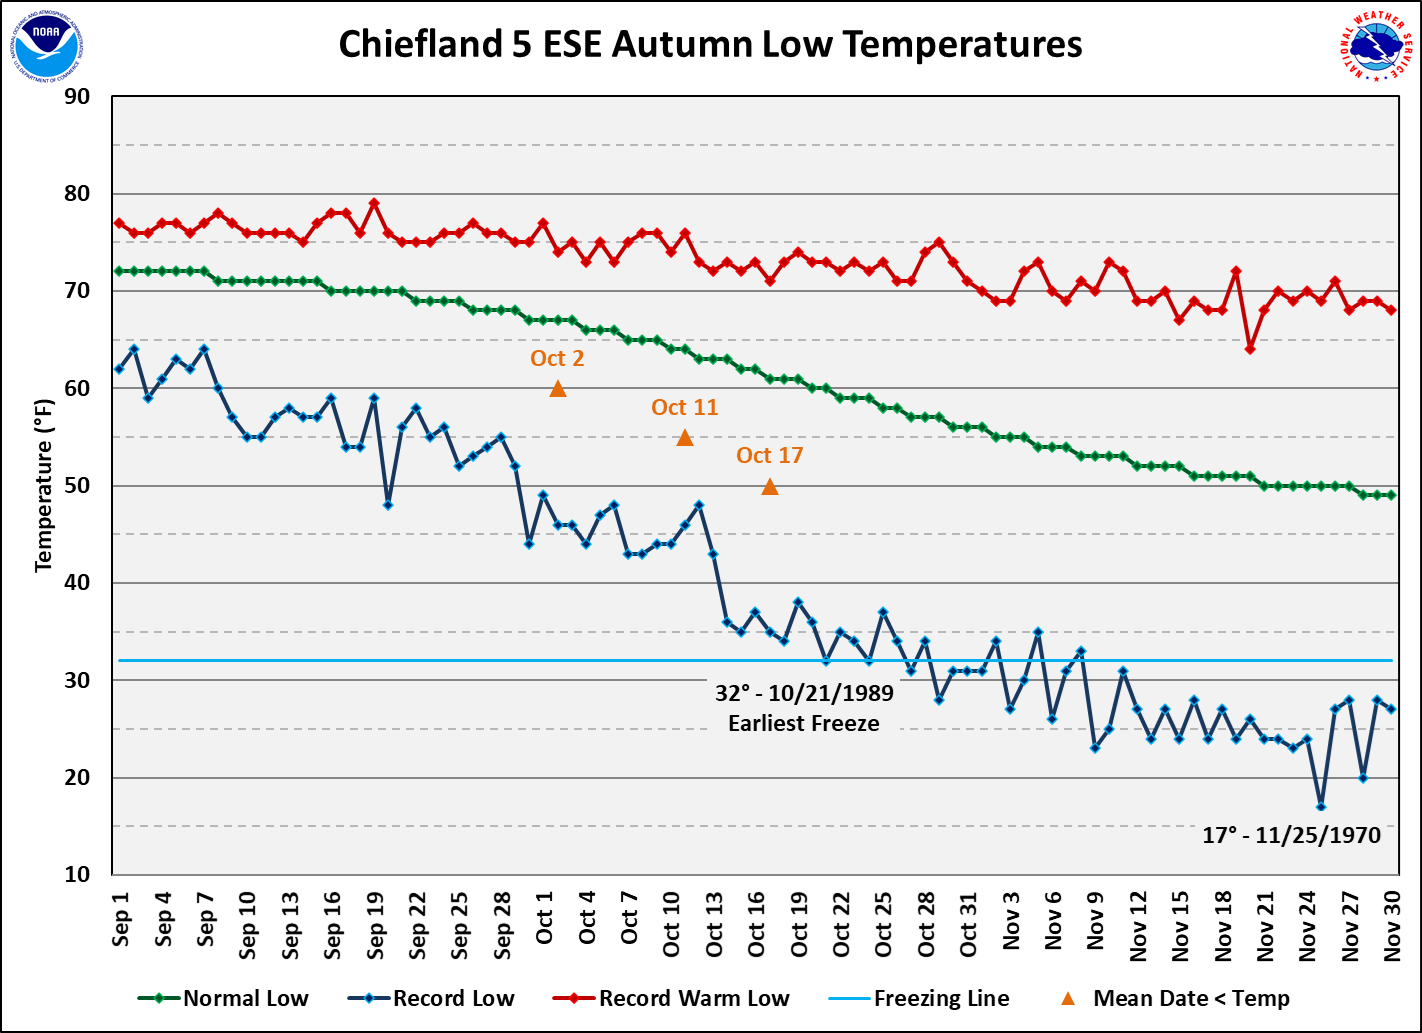
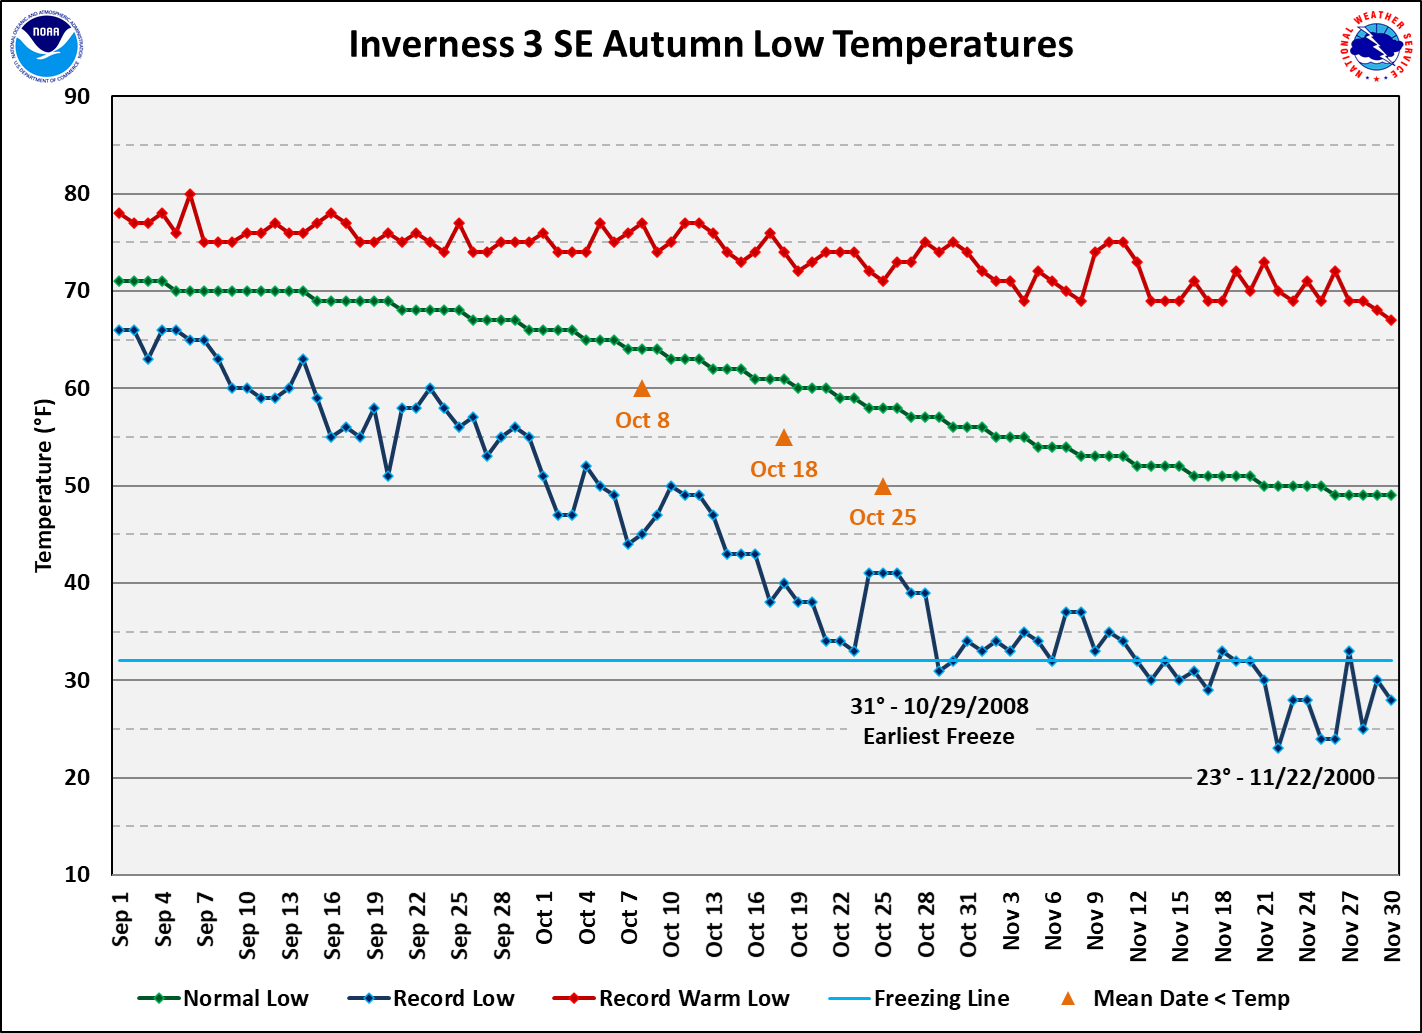
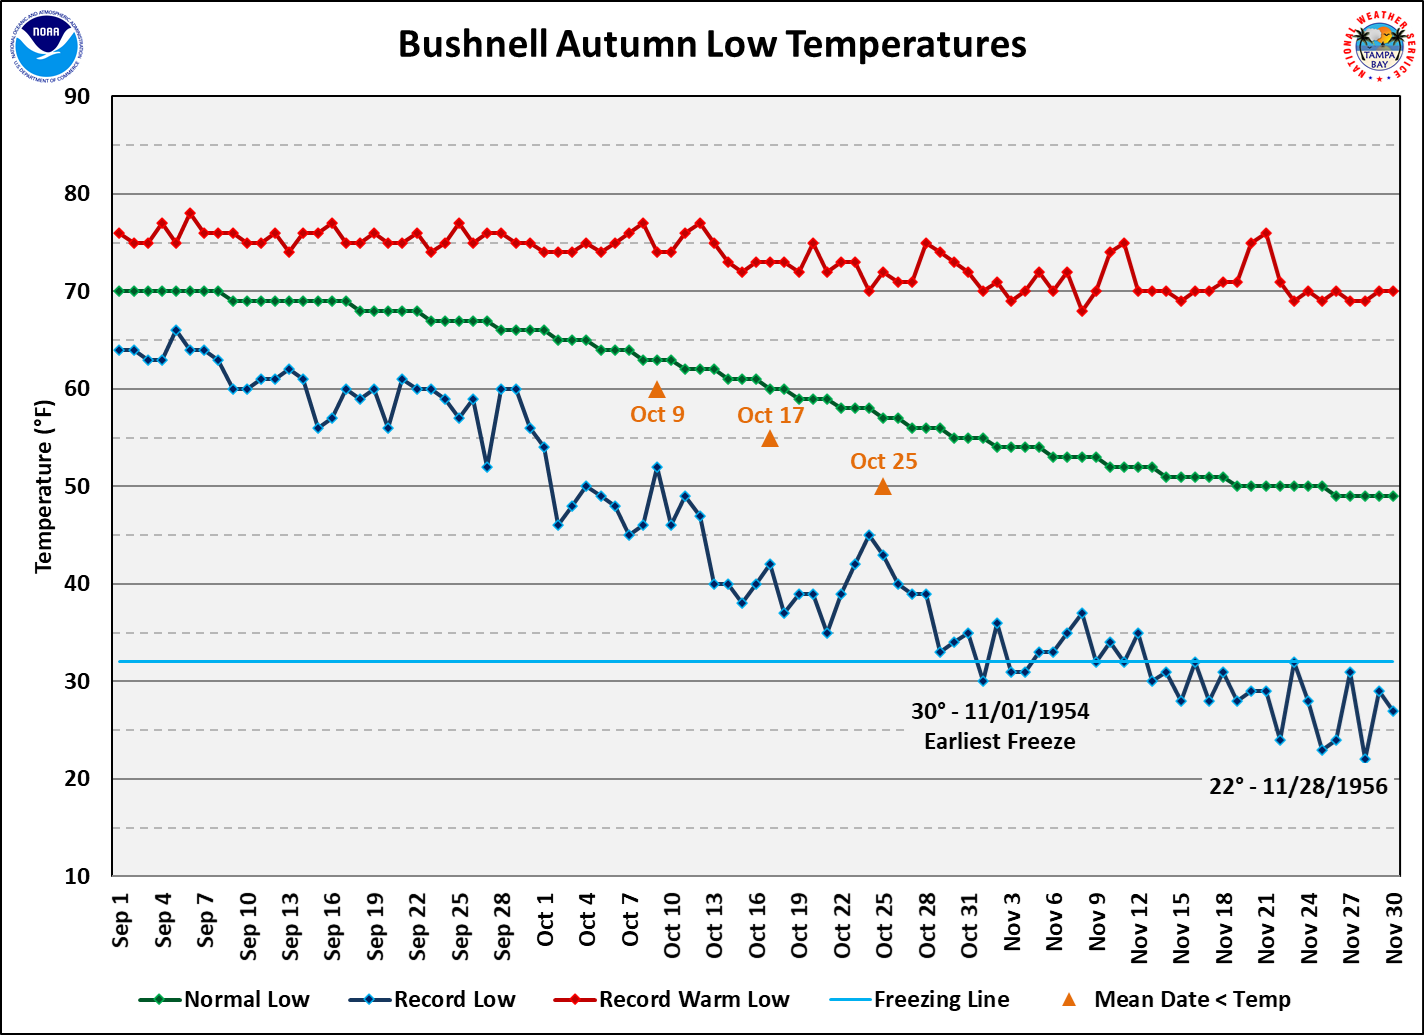
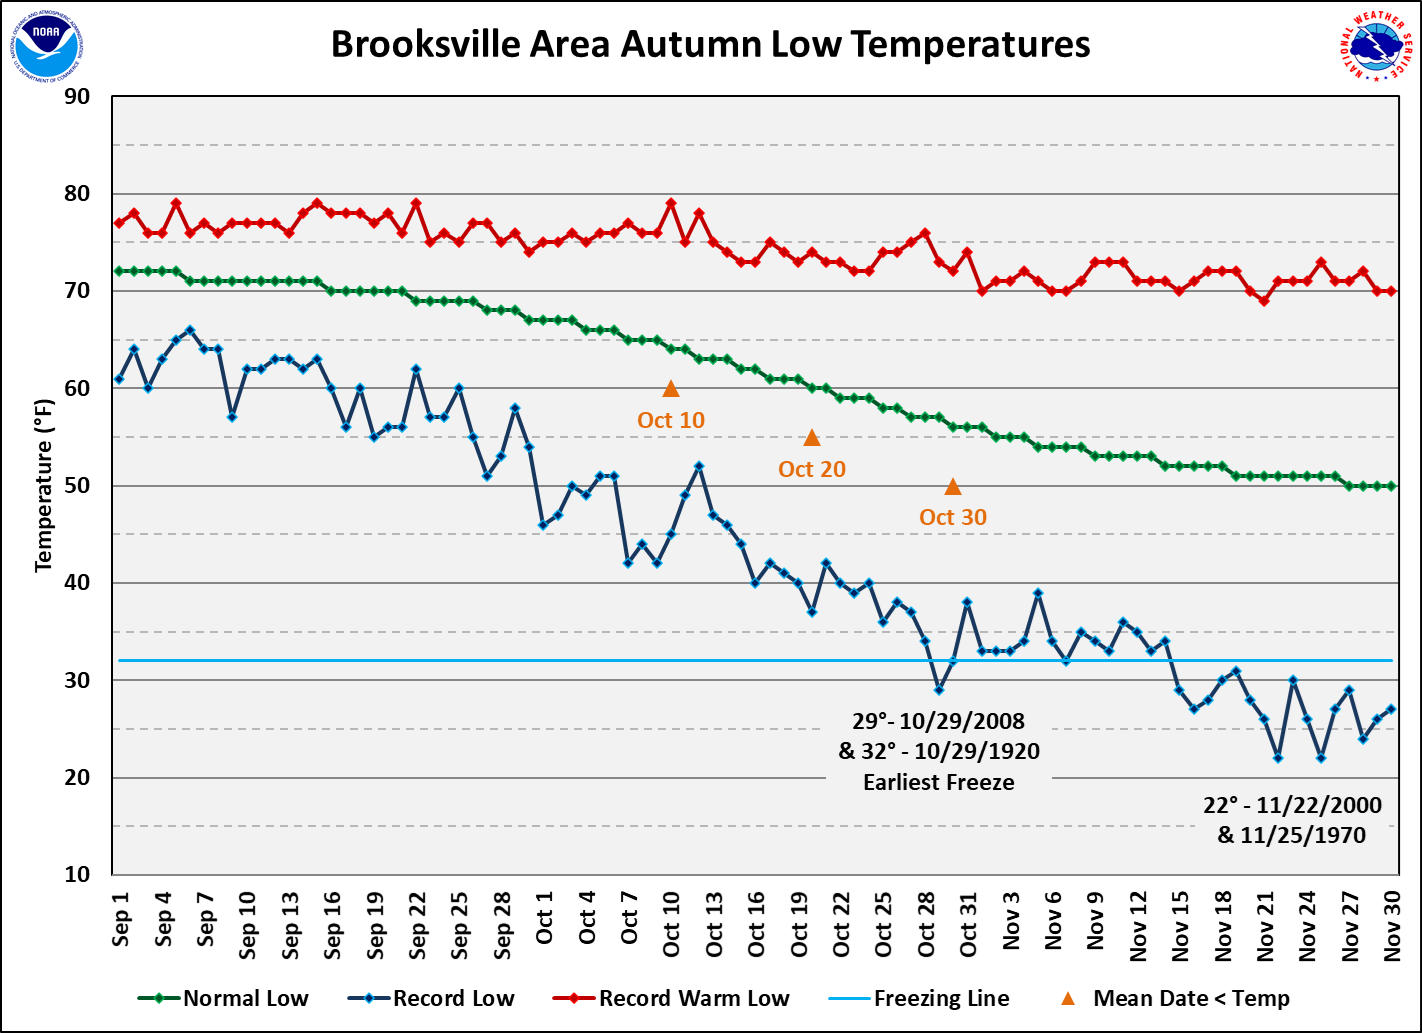
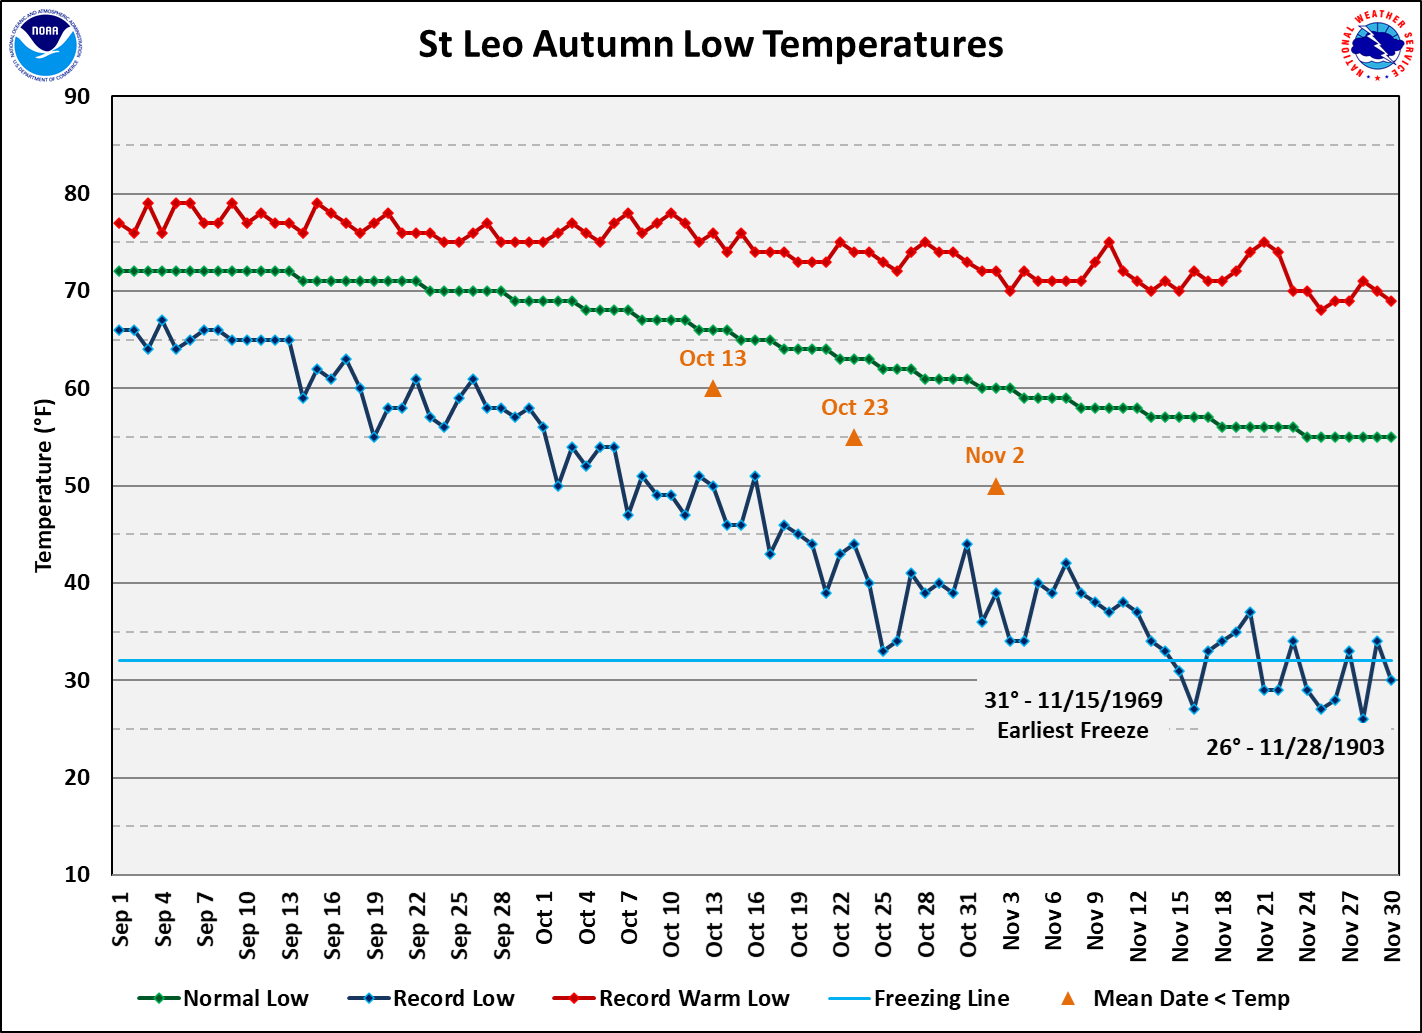
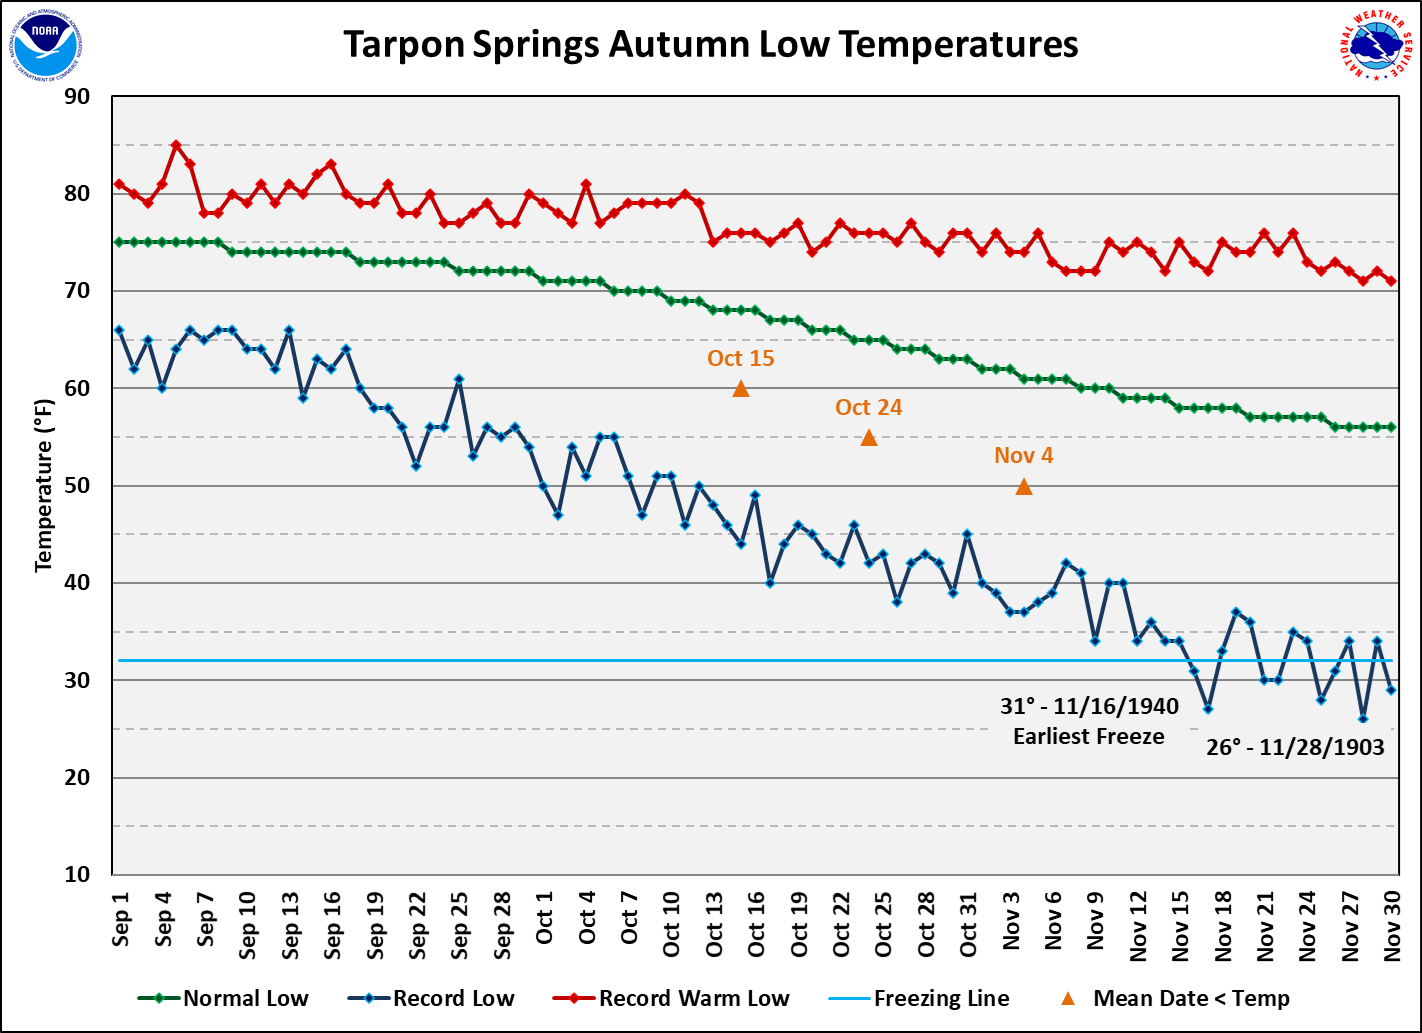
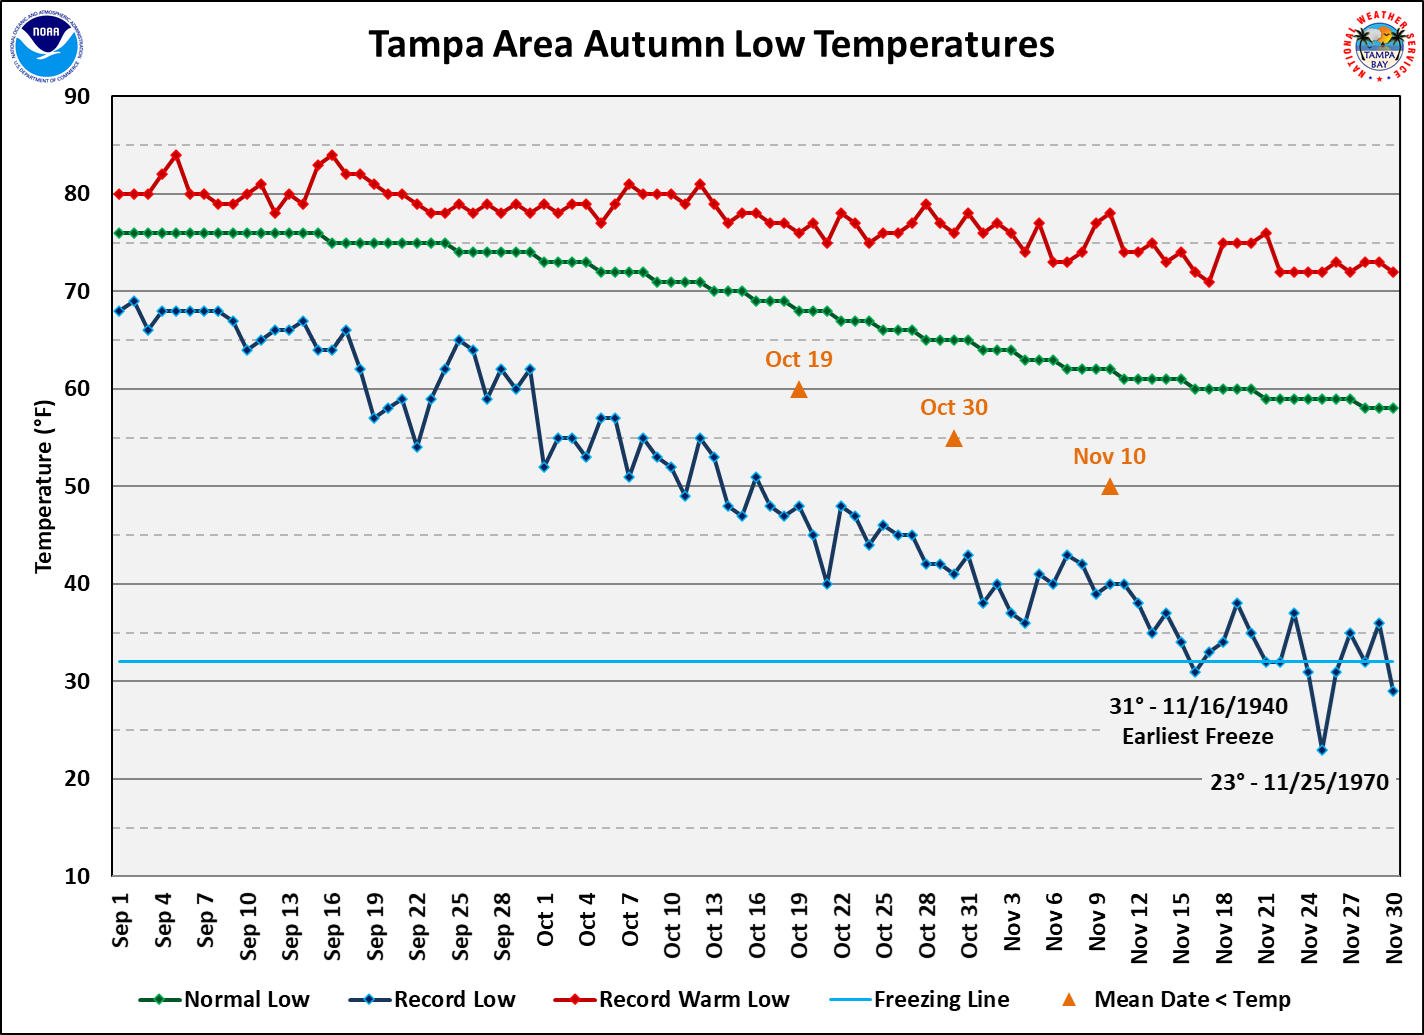
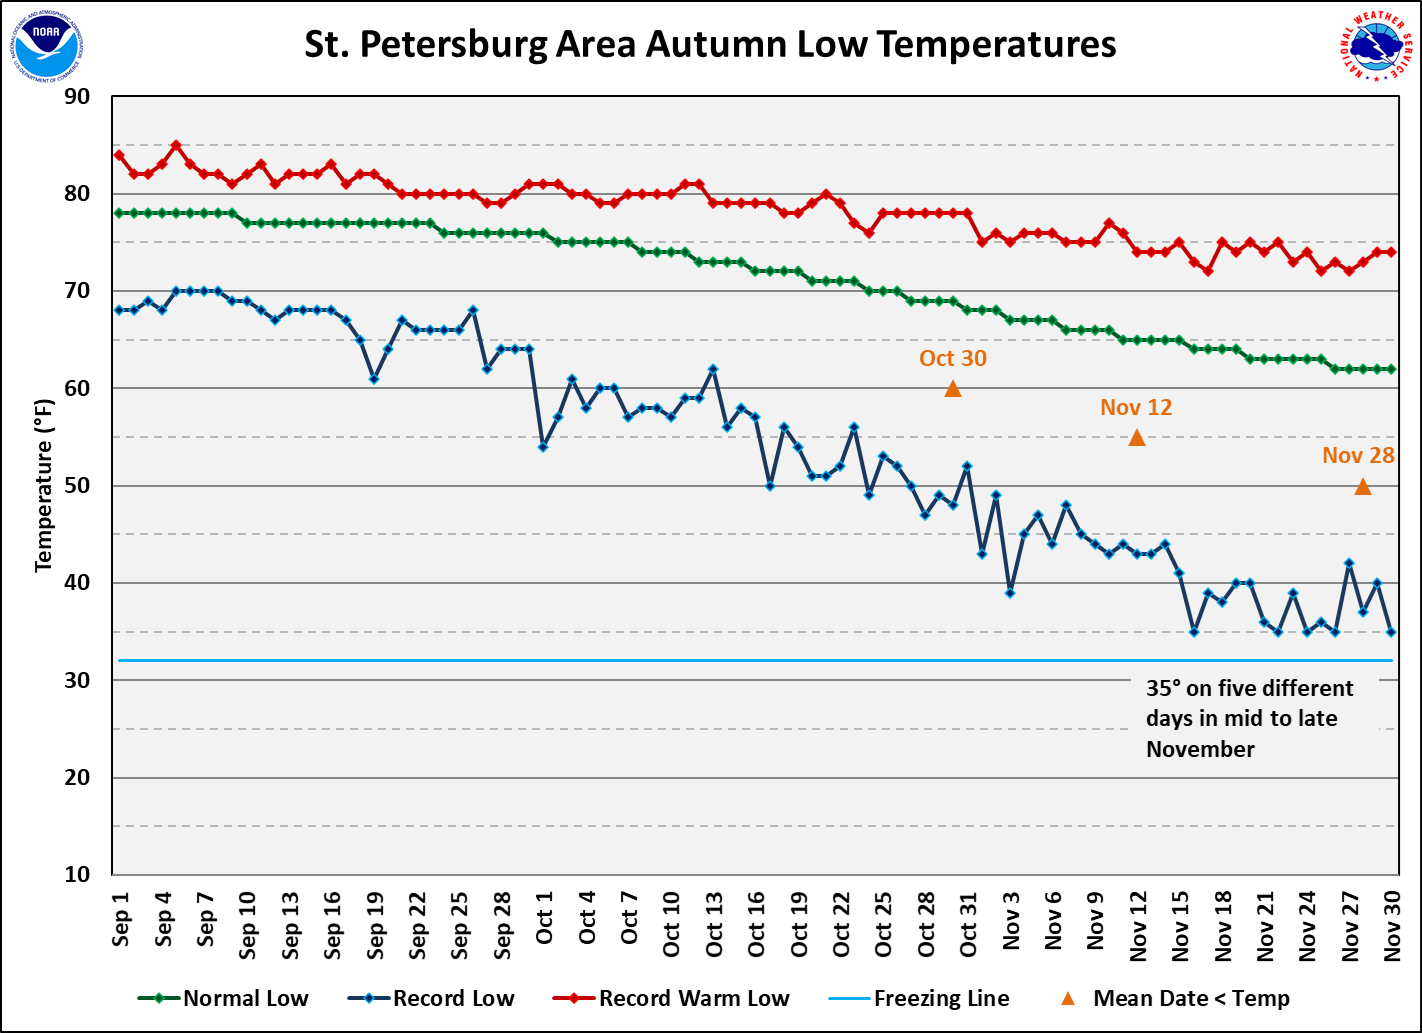
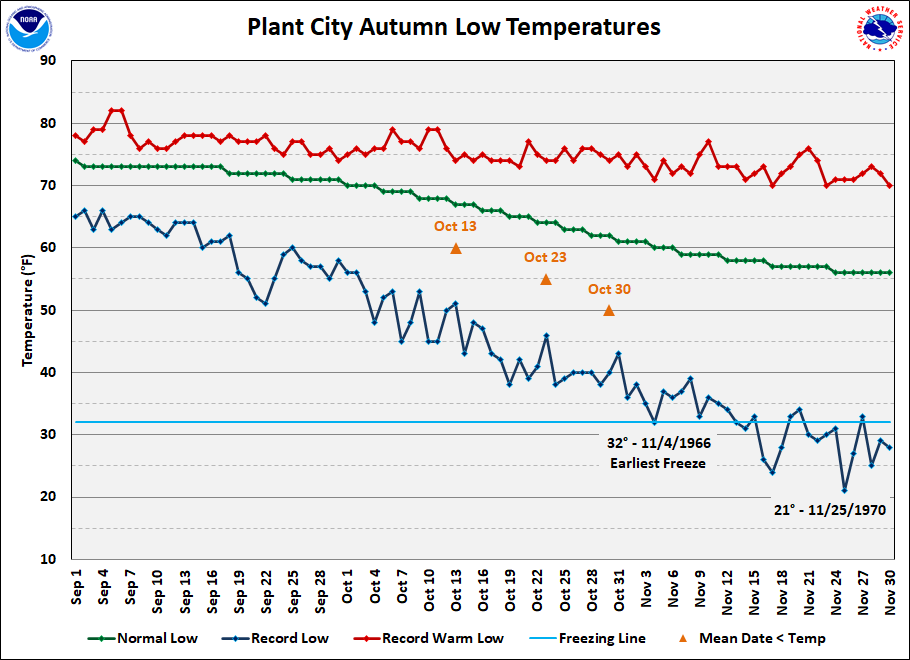
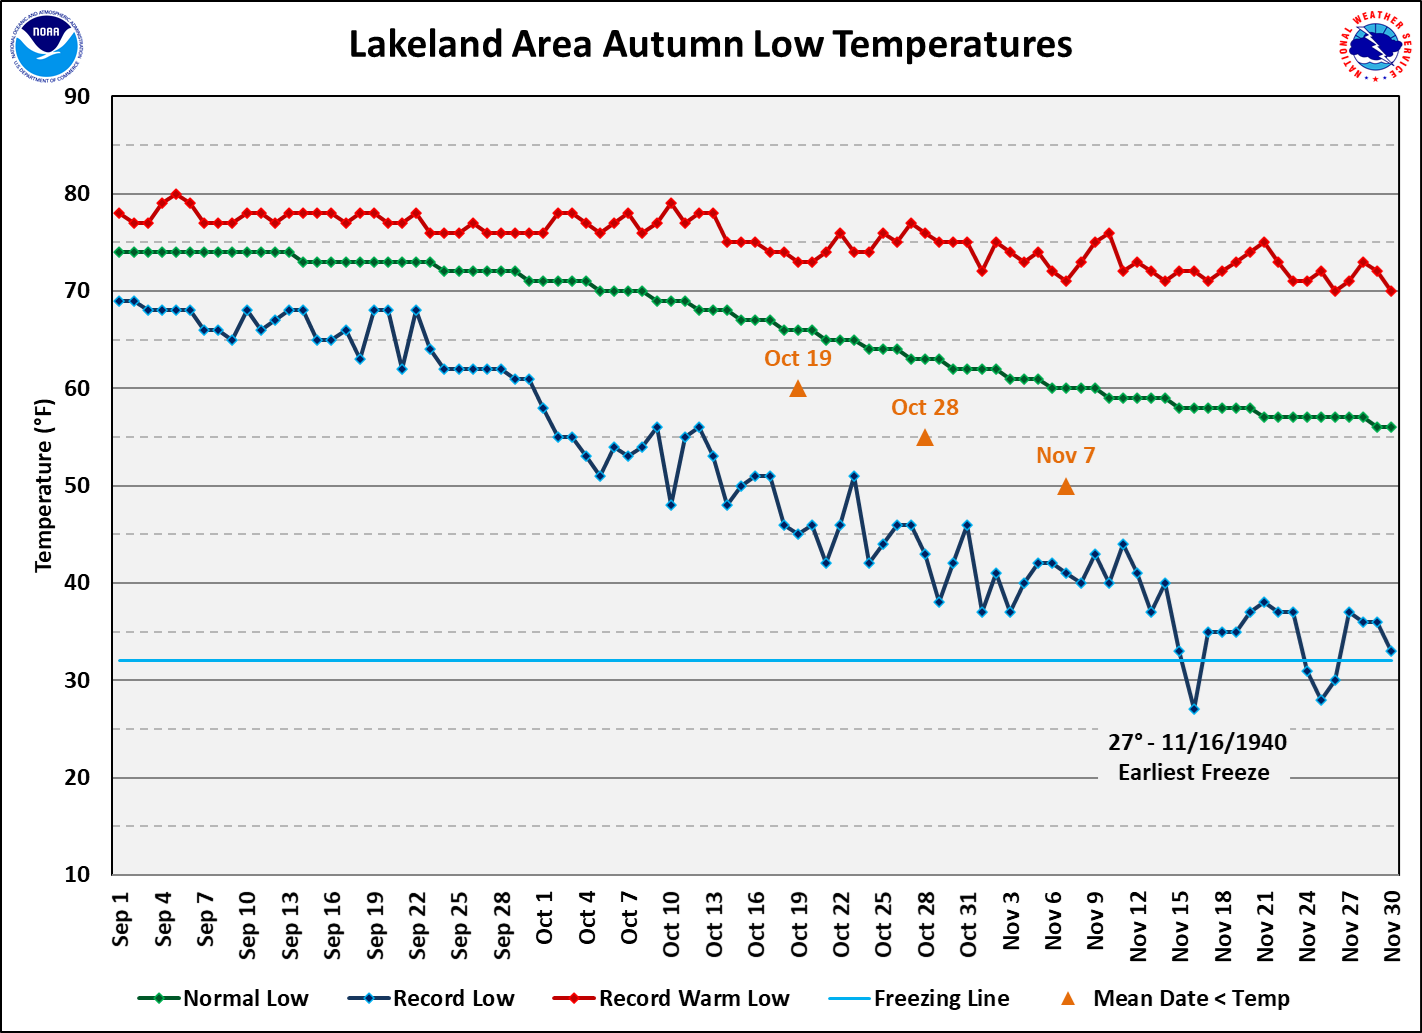
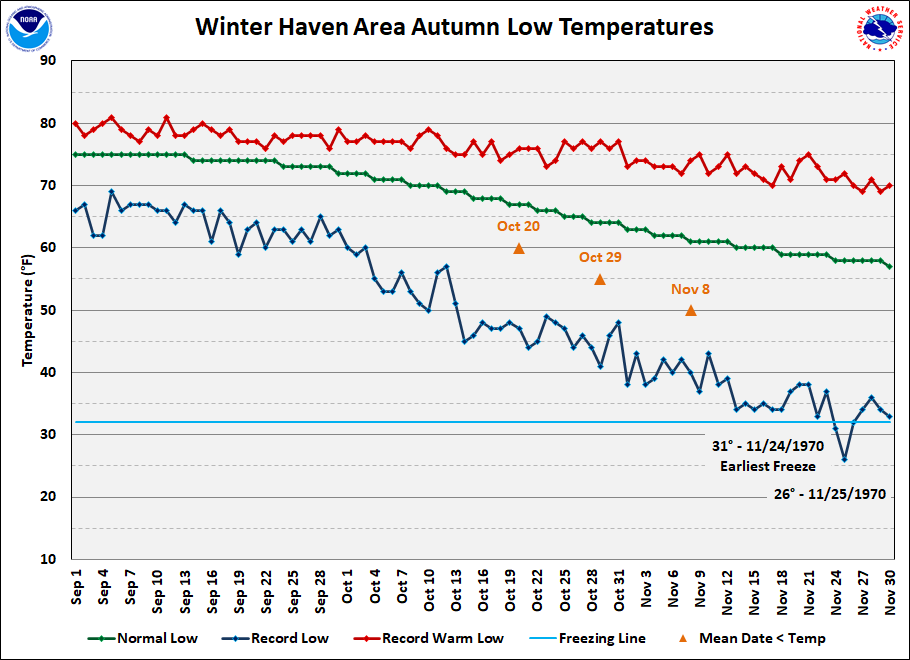
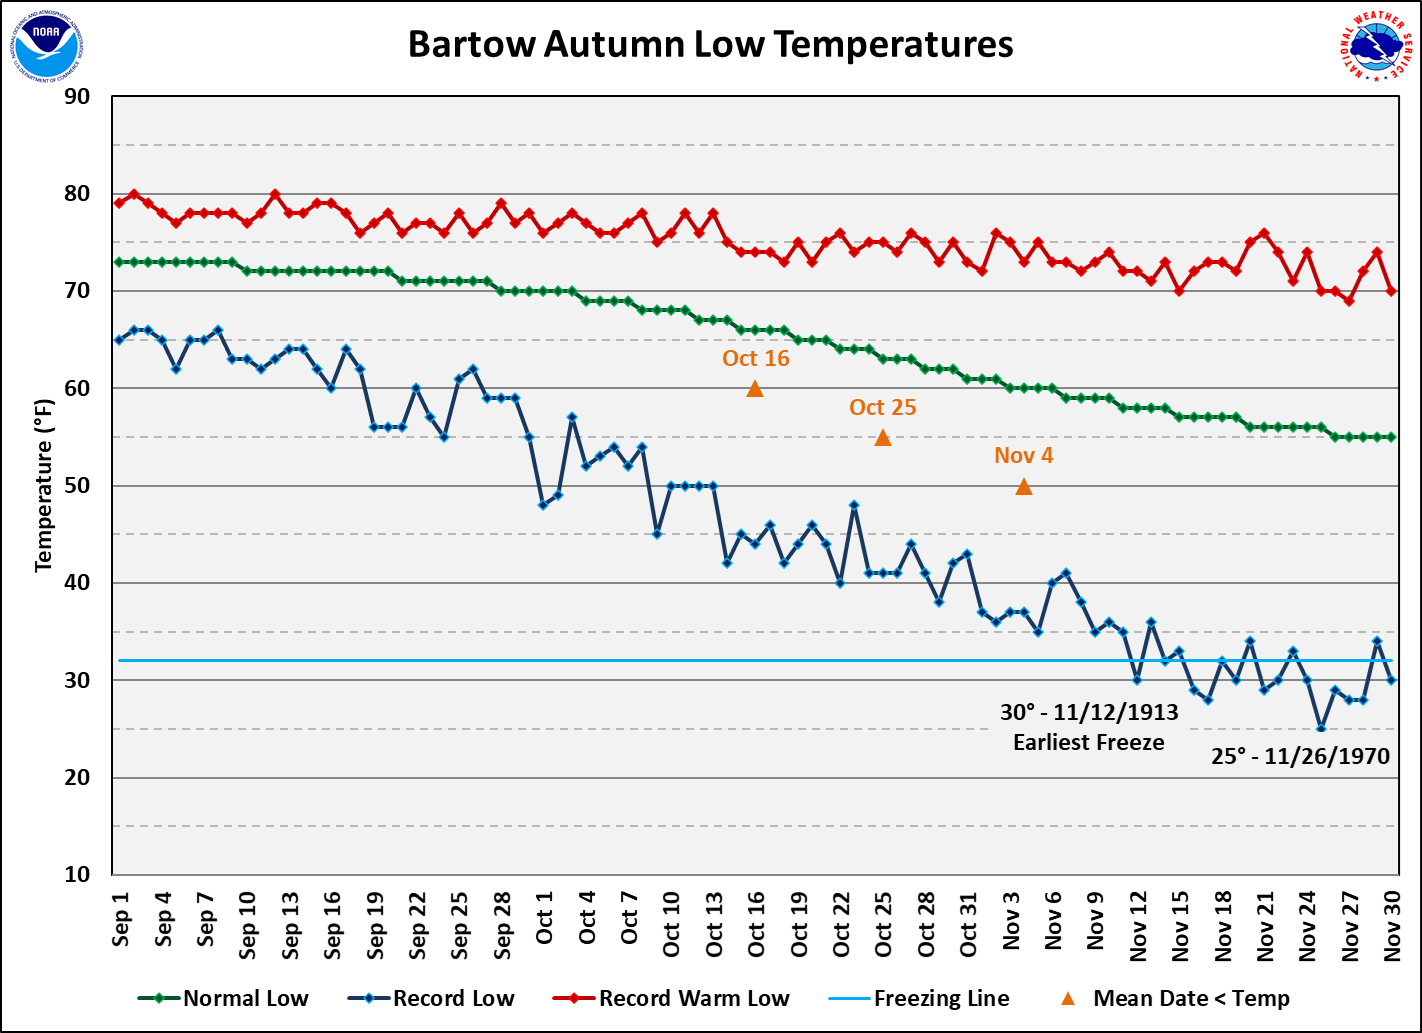
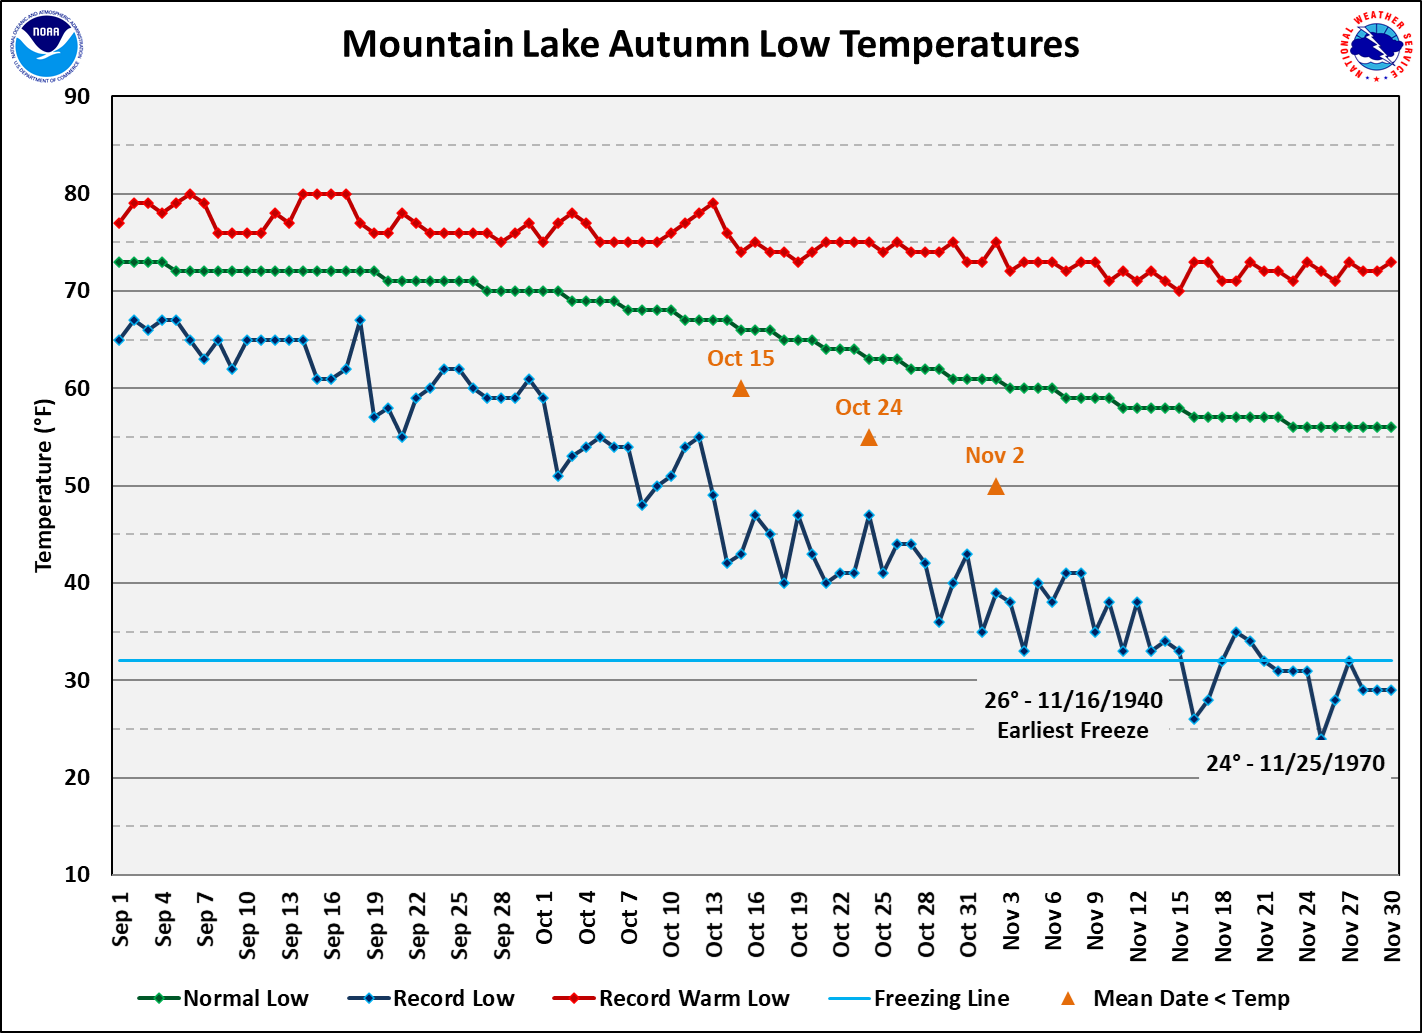
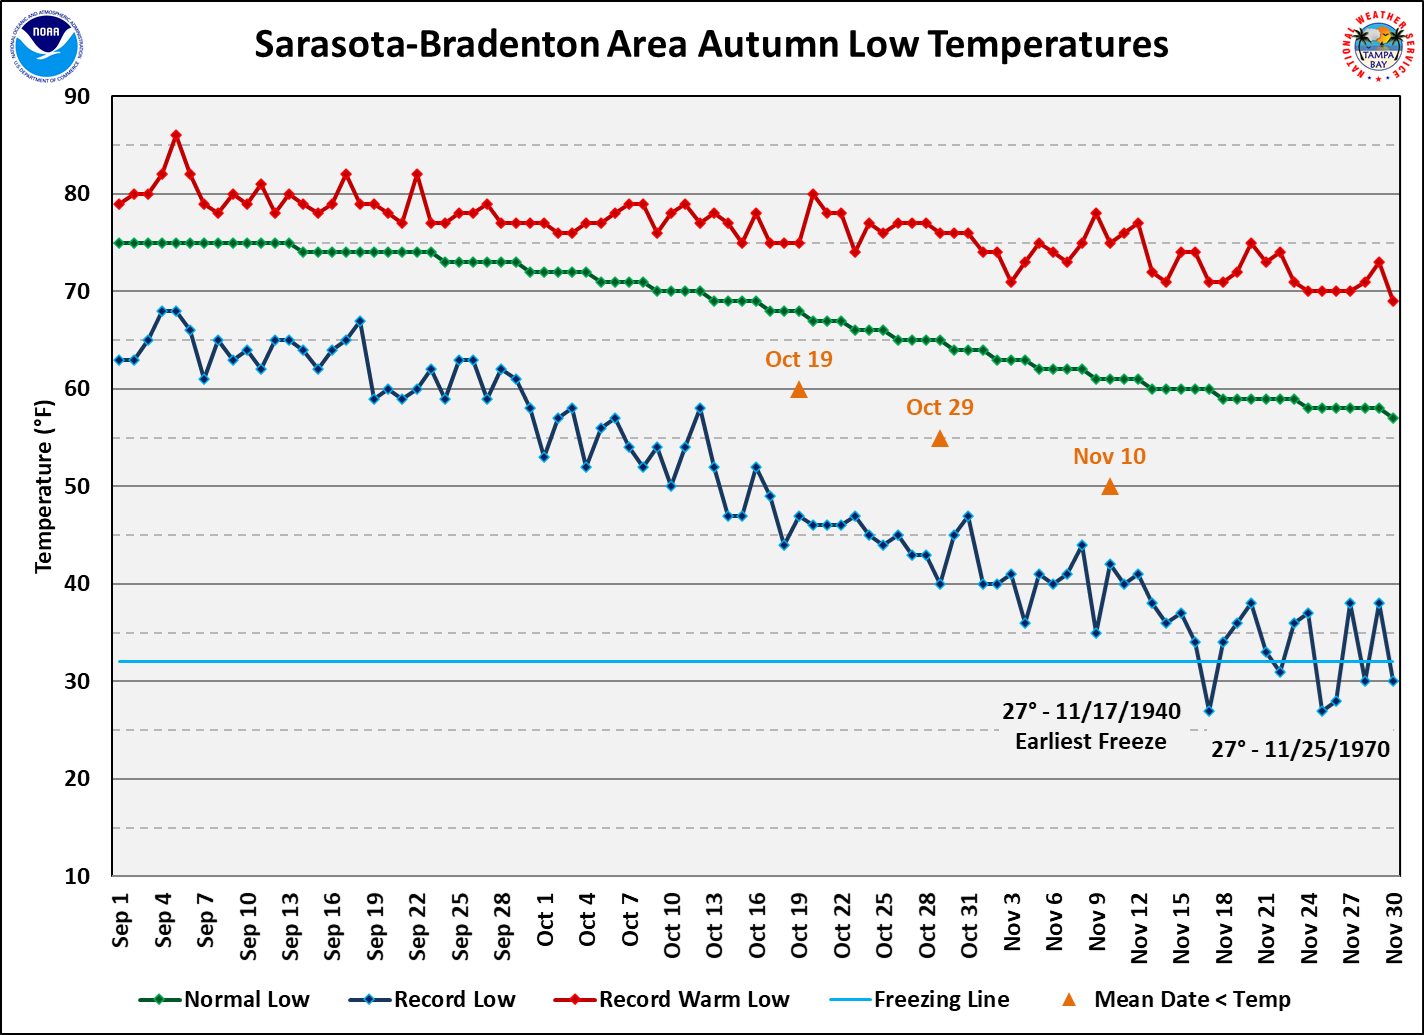
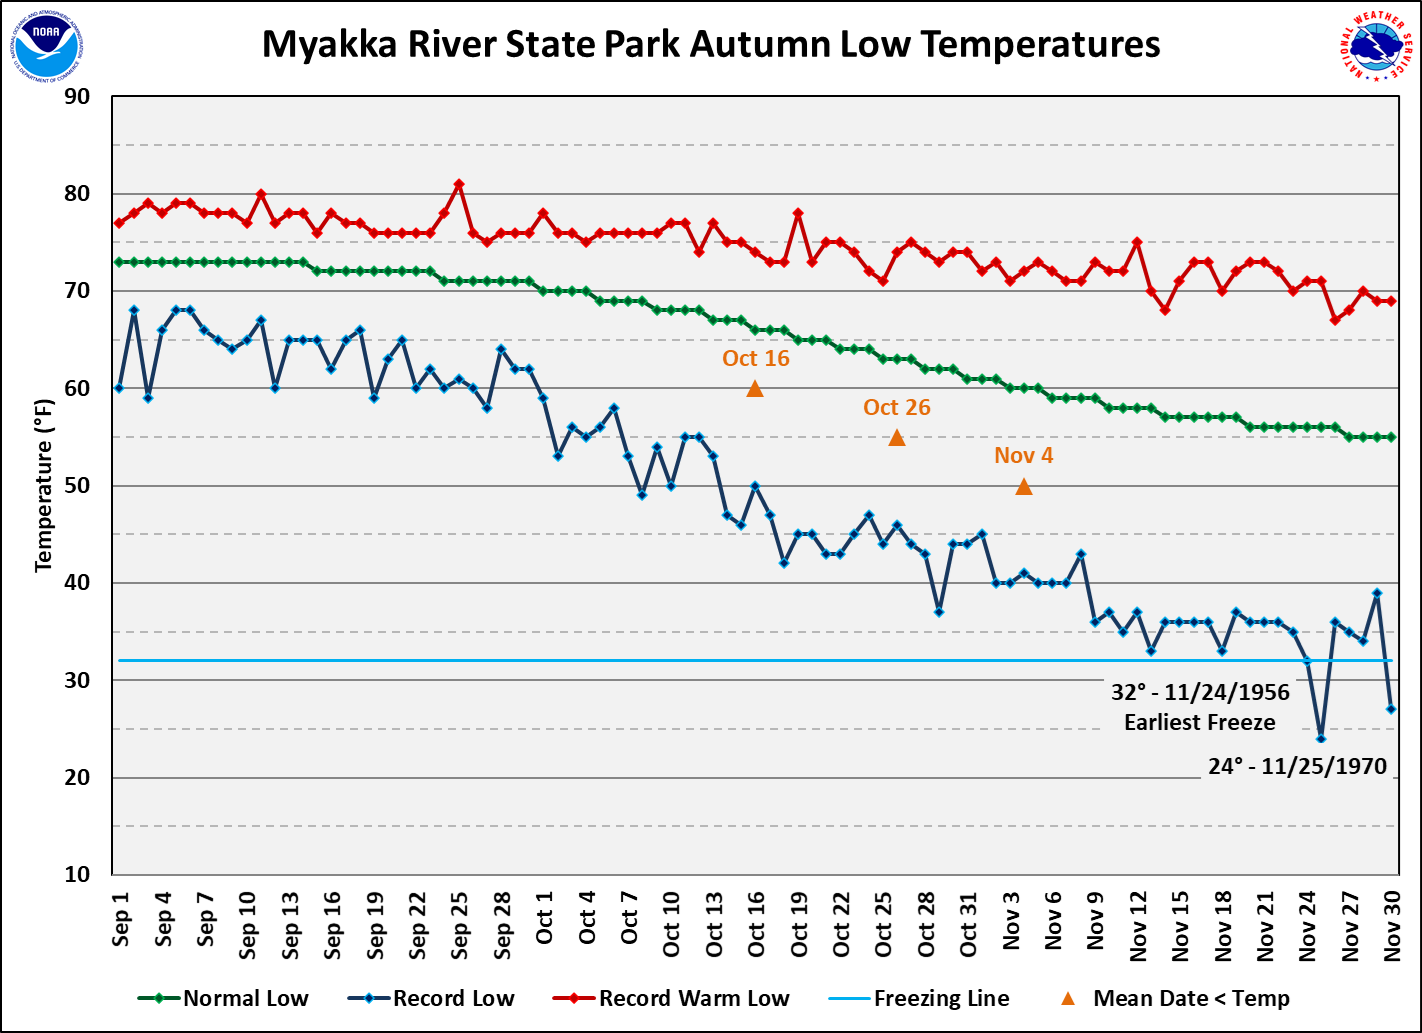
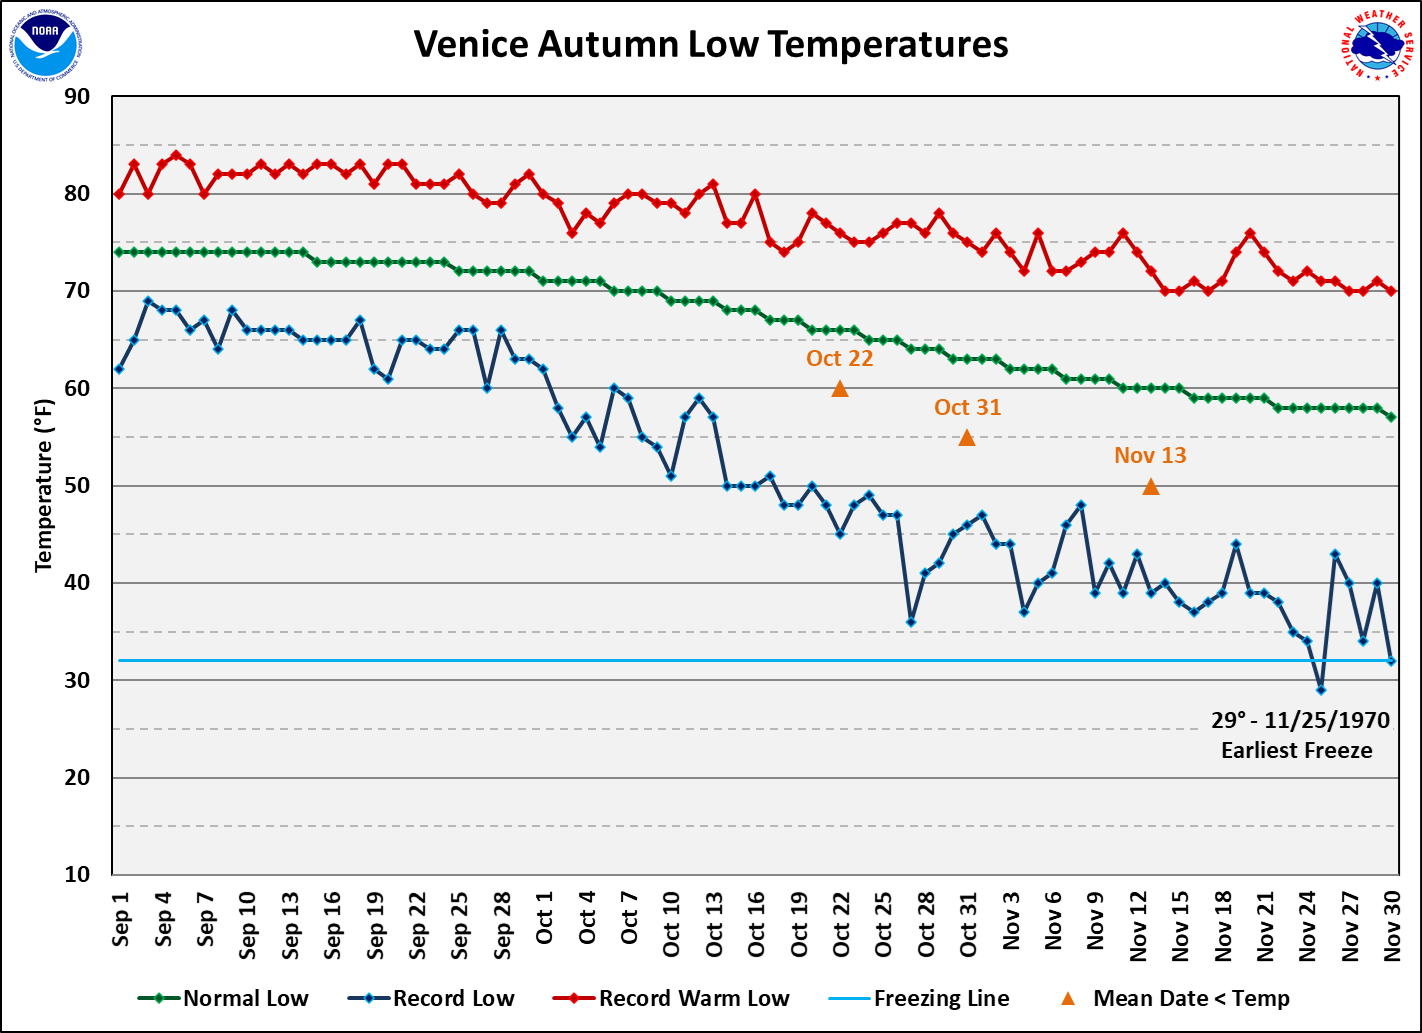
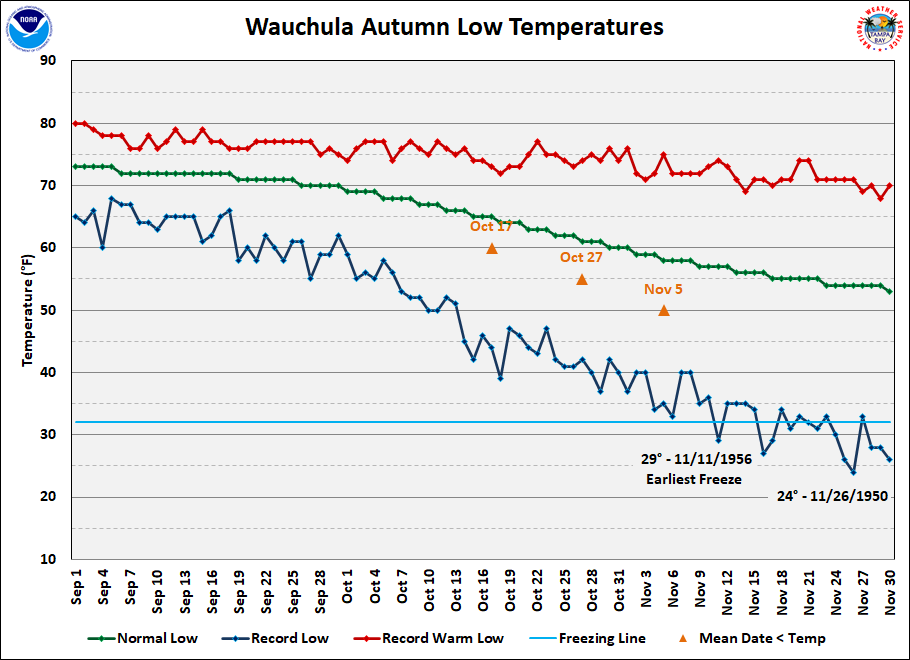
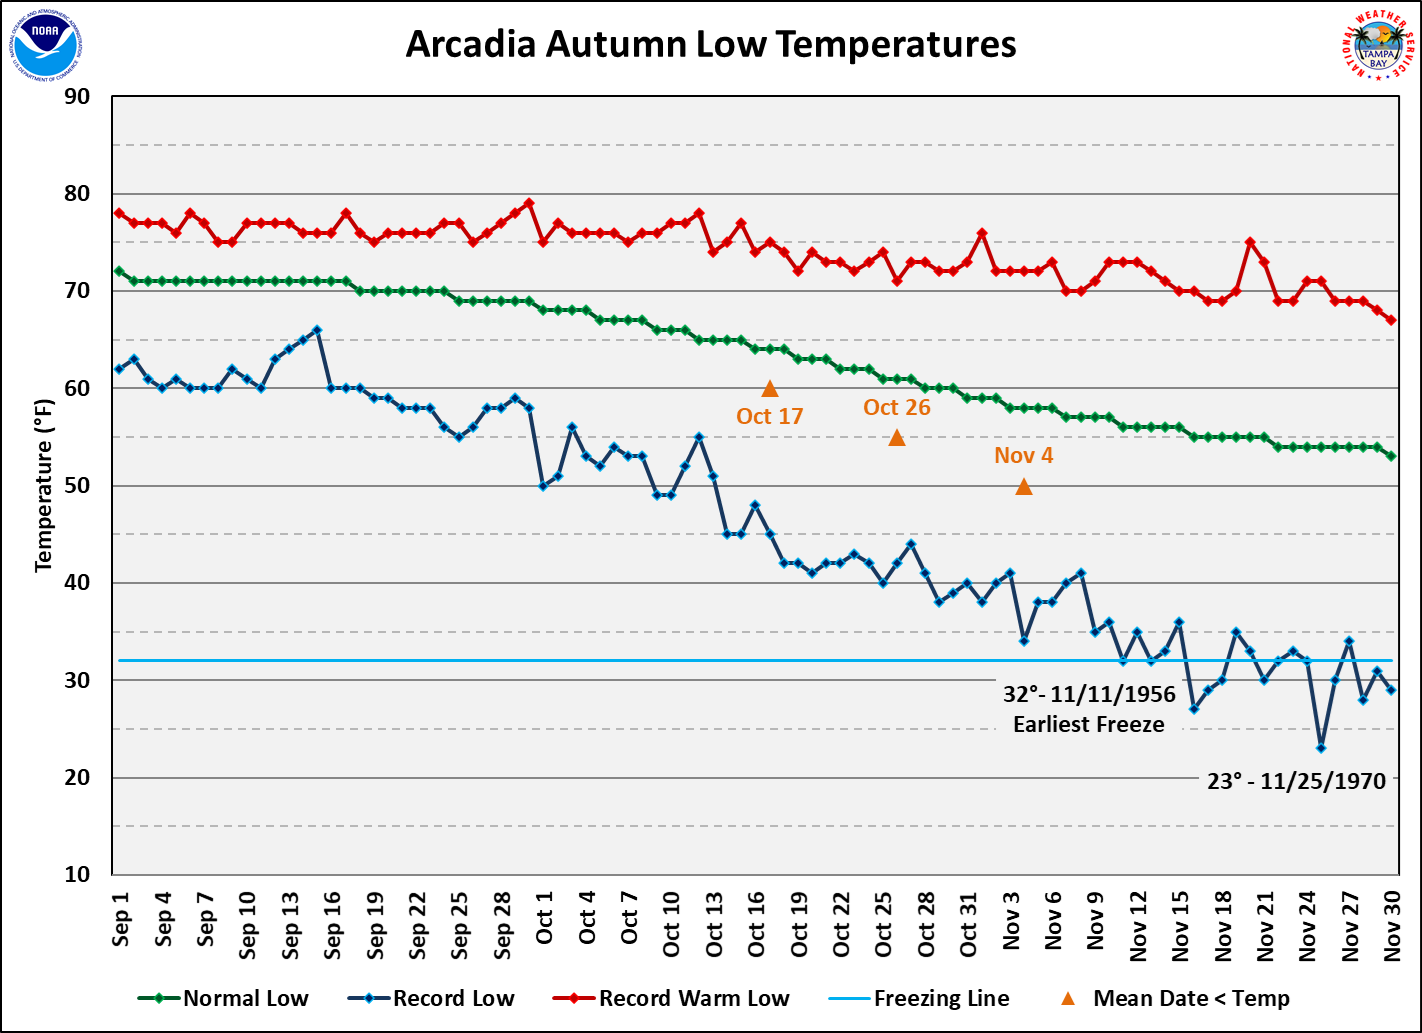
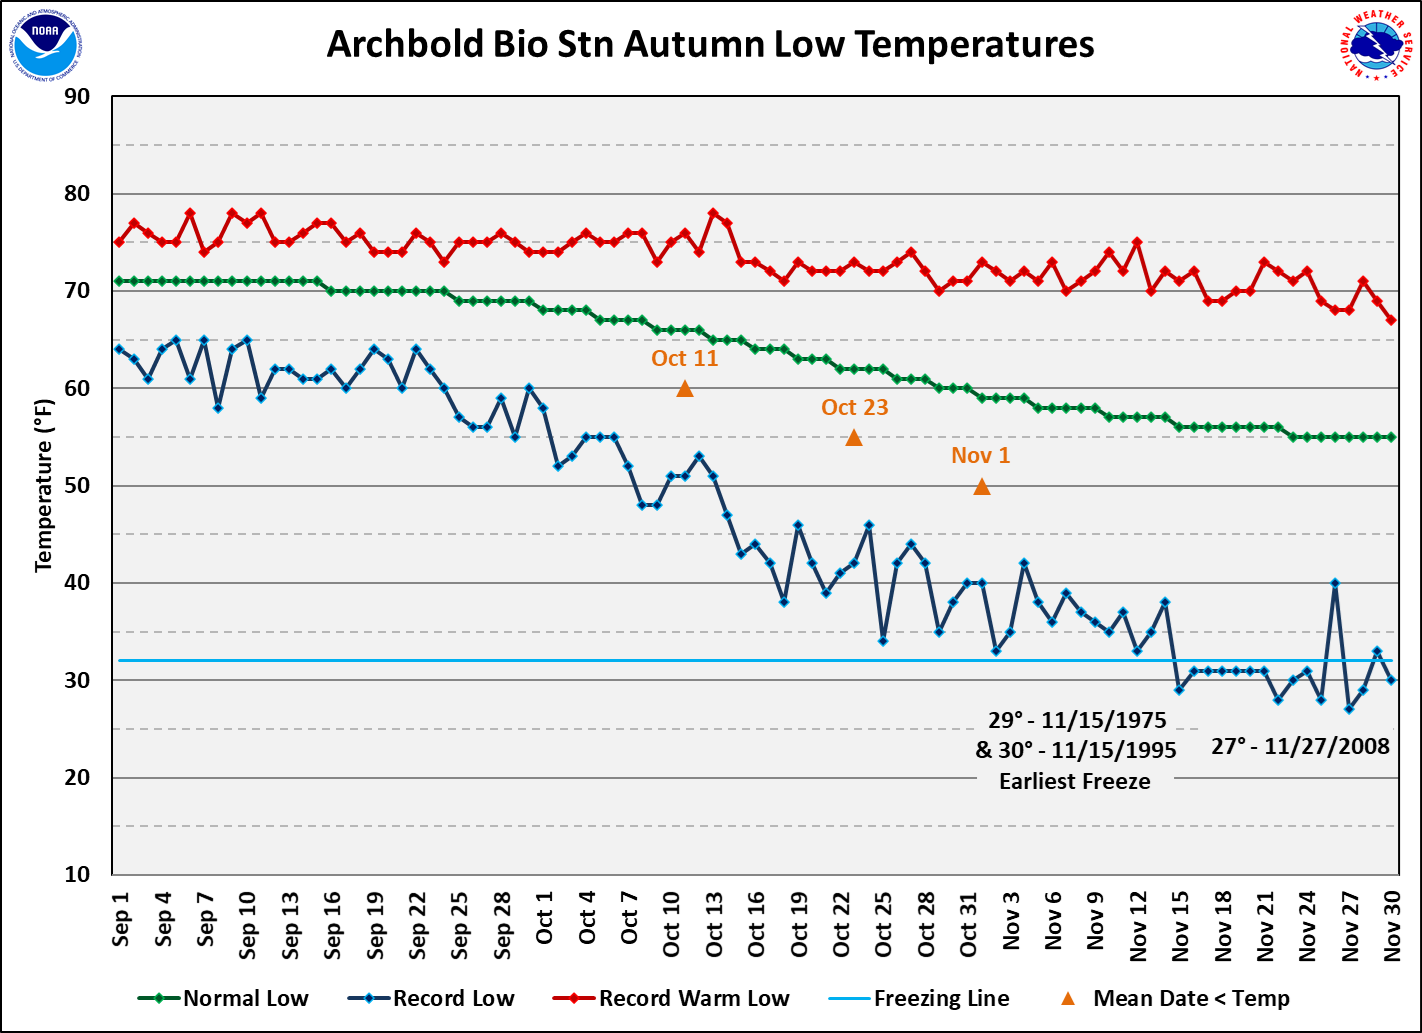
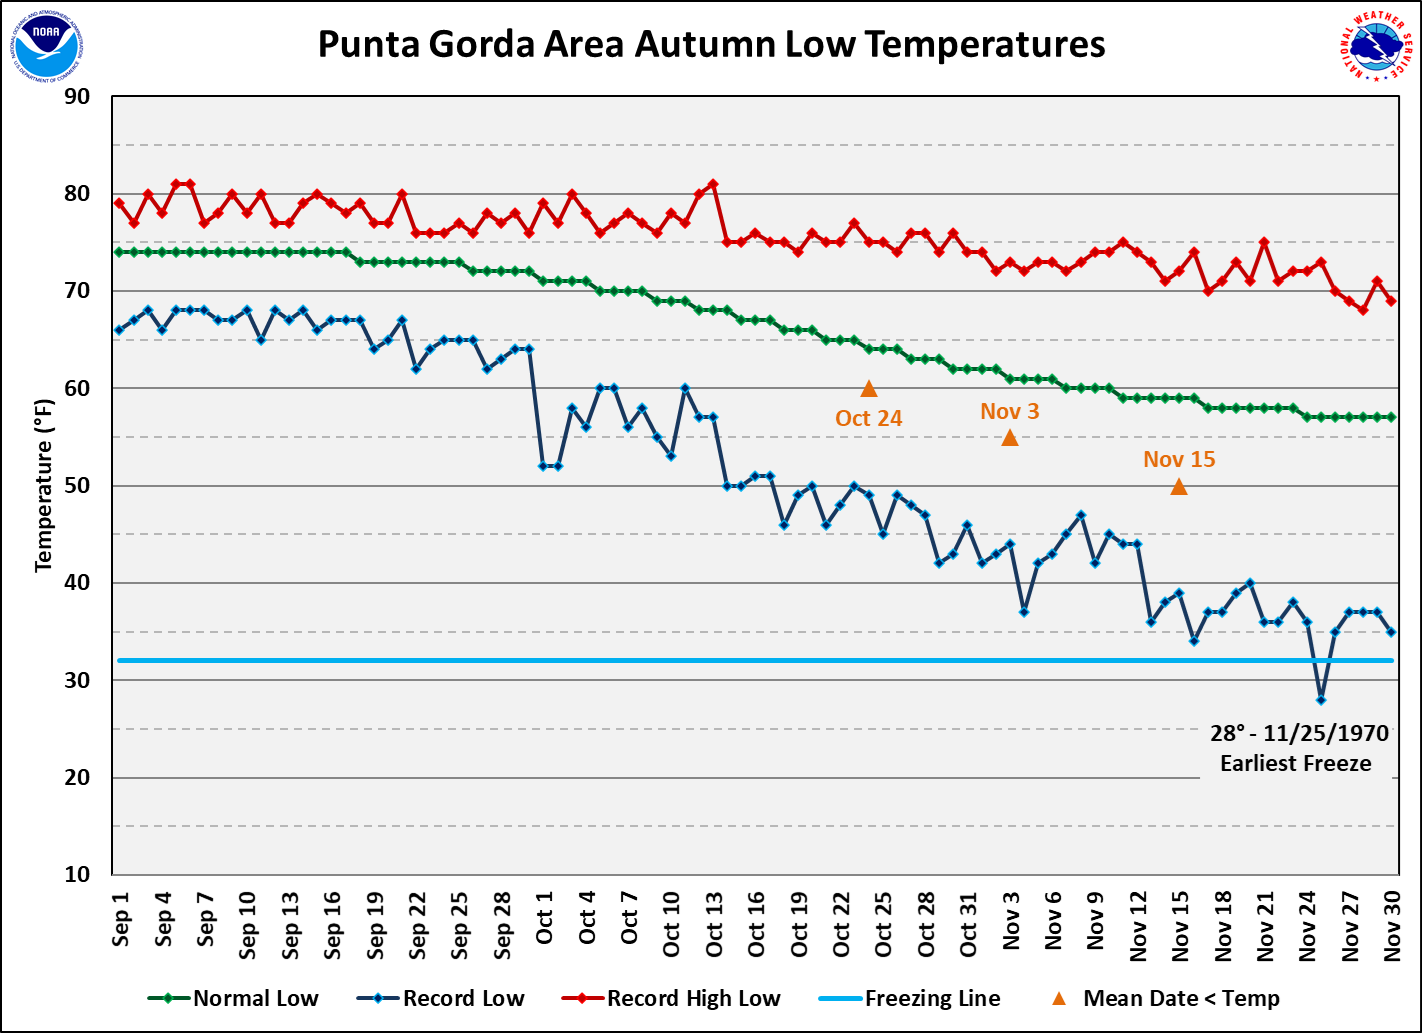
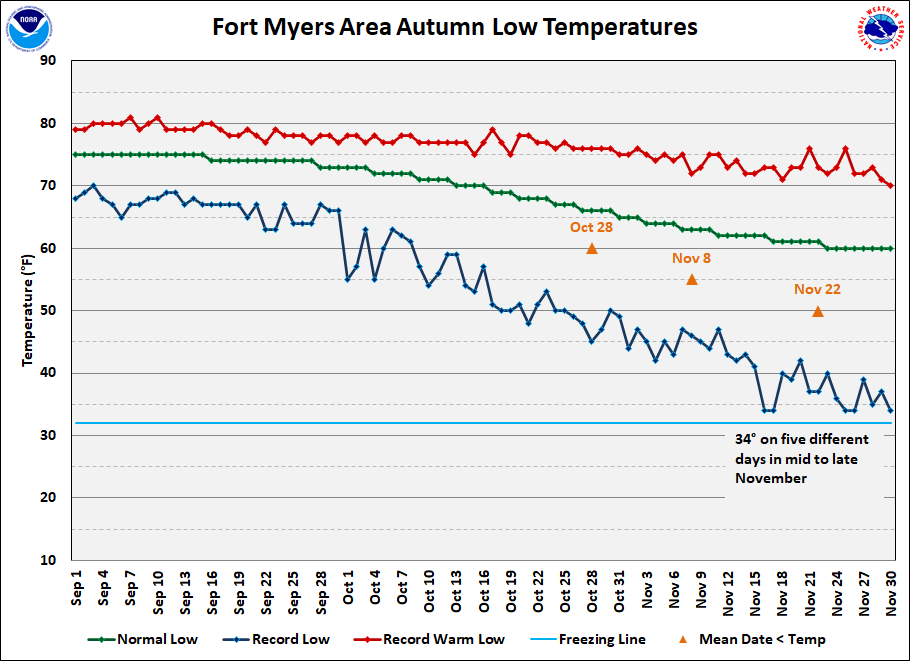
Another way to look at when it may cool down is to take a look at the graphs of the average (based on 1991-2020 Normals) and record low temperatures during autumn at sites across the region. We can see from the graphs below that during some years the first cool down has occurred as early as mid-September when temperatures have fallen into the upper 40s across northern portions of the Nature Coast to the lower 60s south. However, looking at the average lows we see that for the most part it takes until November before low temperatures fall into the mid 50s north to lower 60s south on a consistent basis. Also, on these graphs we can see that on a few rare occasions there has been a freeze across portions of the Nature Coast during the second half of October, with areas further south during November. For an interpretation of the graphs click the smaller graph to the right. |
Interpretation of Graphs 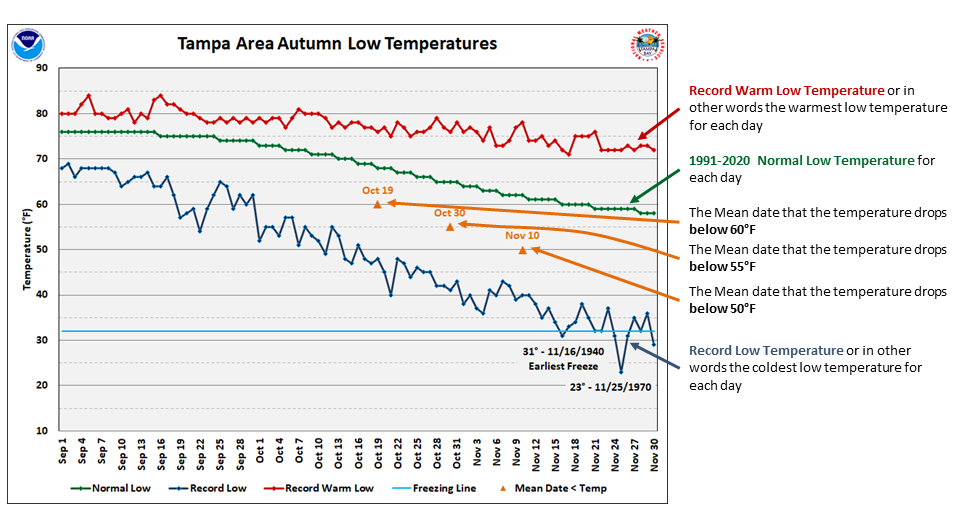 |
All images on this page can be magnified by left clicking on them, and resized back to original size with a second left click. |
|
 |
|
| (Back up to Tables and Maps) |
|
 |
|
| (Back up to Tables and Maps) |
|
 |
|
| (Back up to Tables and Maps) |
|
 |
|
| (Back up to Tables and Maps) |
|
 |
|
| (Back up to Tables and Maps) |
|
 |
|
| (Back up to Tables and Maps) |
|
 |
|
| (Back up to Tables and Maps) |
|
 |
|
| (Back up to Tables and Maps) |
|
 |
|
| (Back up to Tables and Maps) |
|
 |
|
| (Back up to Tables and Maps) |
|
 |
|
| (Back up to Tables and Maps) |
|
 |
|
| (Back up to Tables and Maps) |
|
 |
|
| (Back up to Tables and Maps) |
|
 |
|
| (Back up to Tables and Maps) |
|
 |
|
| (Back up to Tables and Maps) |
|
 |
|
| (Back up to Tables and Maps) |
|
 |
|
| (Back up to Tables and Maps) |
|
 |
|
| (Back up to Tables and Maps) |
|
 |
|
| (Back up to Tables and Maps) |
|
 |
|
| (Back up to Tables and Maps) |
|
 |
|
| (Back up to Tables and Maps) |
|
As a side note, for those who miss or would like to see where the foliage has begun to change color across the United States, visit the USDA Forest Service web site listed below. https://www.fs.usda.gov/visit/fall-colors And for an idea of the approximate time of peak fall foliage see the image below: 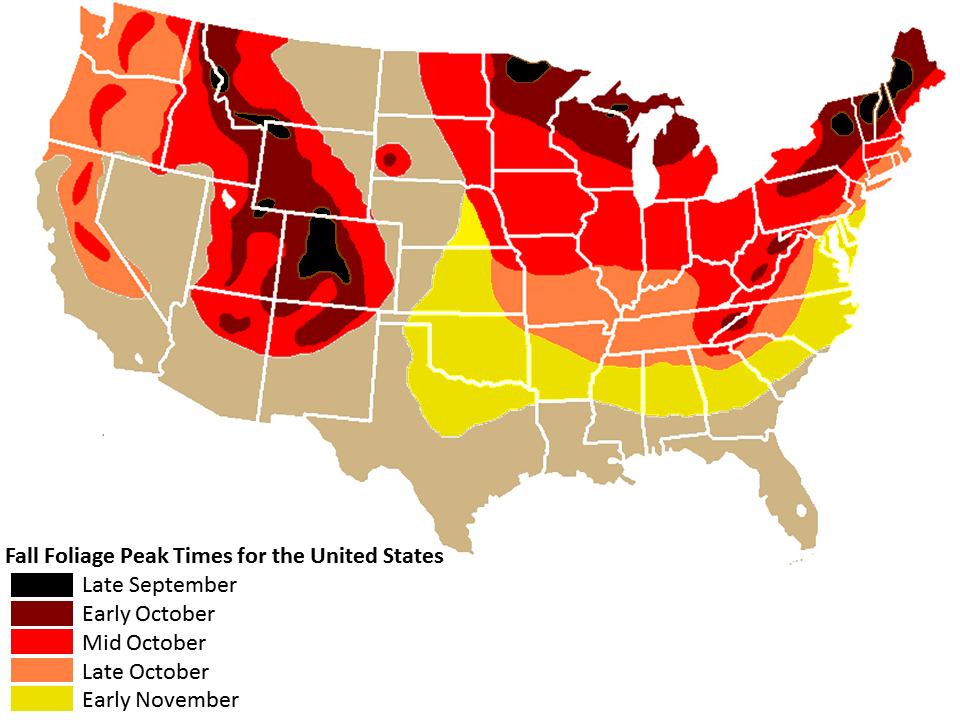 For more local climate information, visit our web site at https://www.weather.gov/tampabay and go to the Climate and Past Weather drop down menu above the weather forecast graphics. |