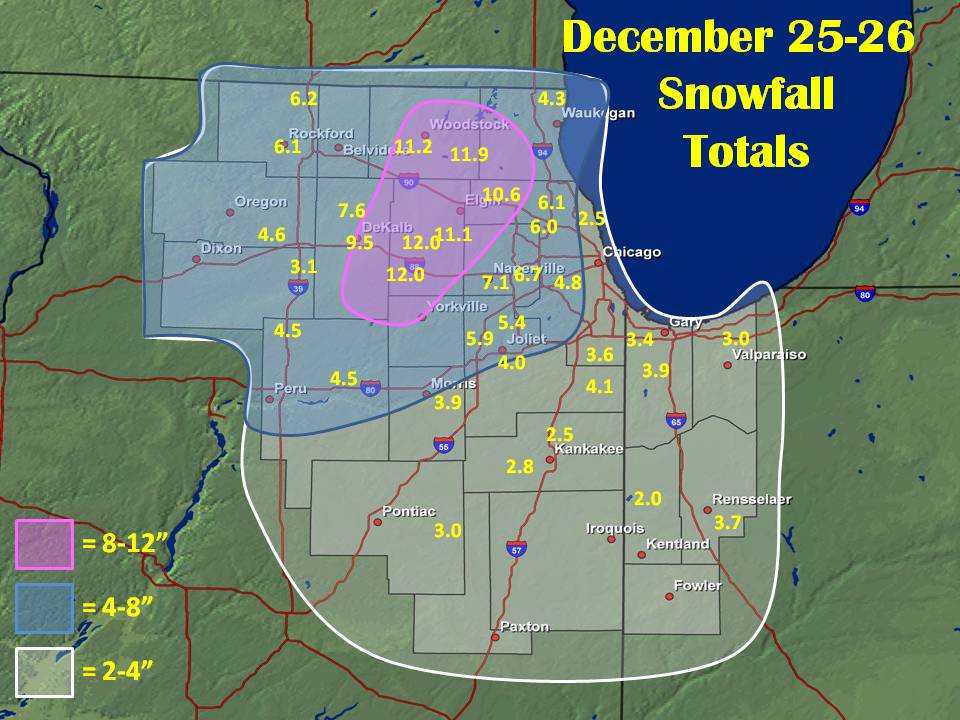
What many would describe as a freak snowstorm struck much of northern Illinois and northwest Indiana Christmas night and continued into Saturday. Much of northern Illinois north of I-80 saw snowfall totals of 4-8 inches, with portions of the western and northern Chicago suburbs picking up around a foot of snow!
Click on the image to get a listing of the snowfall amounts from across Northern Illinois and Northwest Indiana for this event! The list will appear in a new window.
The radar loop below shows how the snowfall evolved during the day Saturday. The dark blues and purple colors are where moderate to heavy snow was falling, with the purple returns being areas where snowfall rates of 1-2” per hour were being reported.
Among the things that made the snowstorm so unusual was just how dry and fluffy the snow was. A old rule of thumb is that for every 10” of snow that is melted down there will be about 1” of liquid, which is a 10 to 1 ratio. The snow that fell with the December 25-26th storm system had snow to liquid ratios between 30 and 50 to 1, which is abnormal, particularly with temperatures in the 20’s as they were for much of the snowfall.
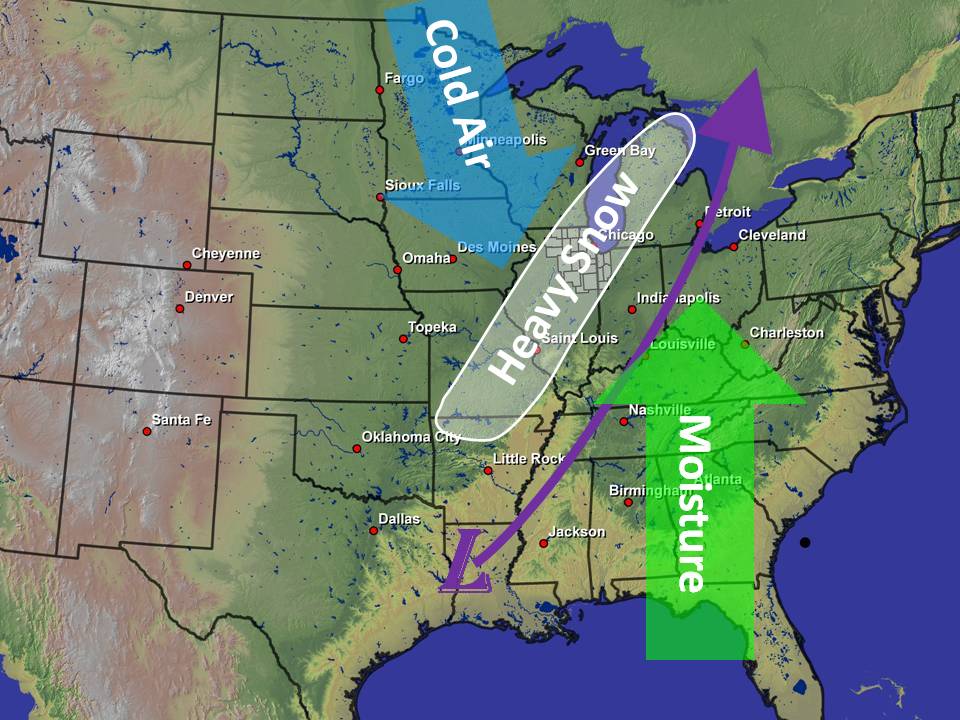
Another aspect of this storm that was unusual is that it was caused largely by an upper level disturbance and not really the direct result of a surface low. Most major snowstorms that affect the Chicago area are associated with strong surface lows that track south or southeast of the area. The most common major snowstorm tracks for our region include A) lows tracking east from the central high plains across the Ohio Valley, B) panhandle storms that develop in the Oklahoma or Texas panhandle and track northeast into across the Ohio Valley, or C) gulf coast storms that develop over the western gulf coast states and track north toward Detroit.
A)
B)
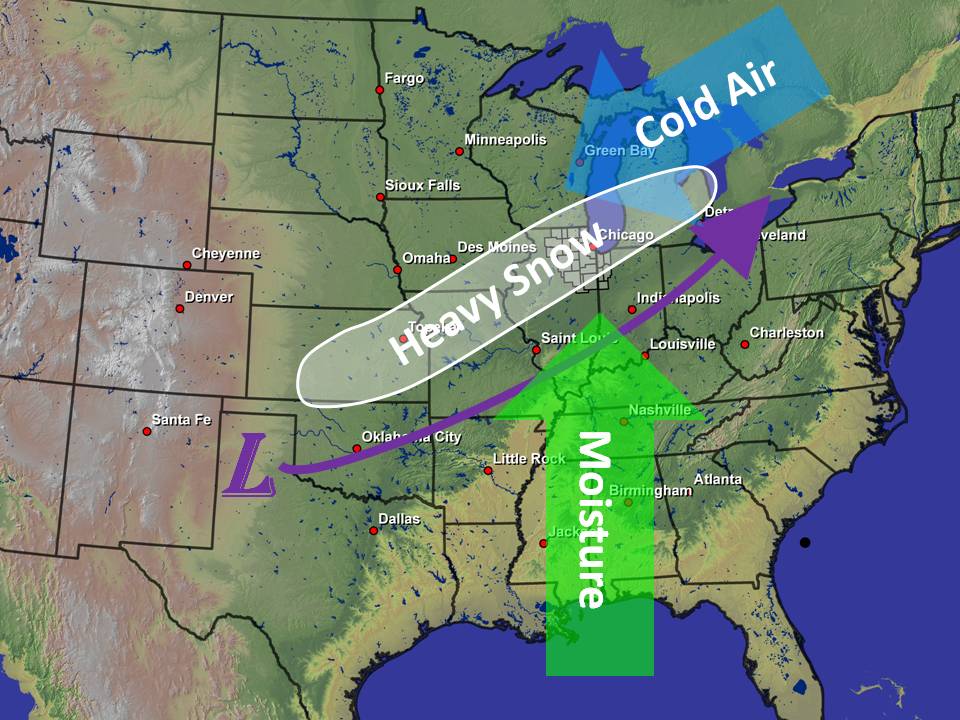
C)
To see snow as a result of an upper level disturbance isn’t overly rare, however to see such heavy snowfall totals not associated with a surface low tracking south or southeast of the area is very unusual. The duration of the accumulating snowfall was over 24 hours in many locations, which is also much longer than many snowstorms in this region. The long duration was a result of the somewhat stagnant pattern over the region with a stationary upper low over the western Great Lakes. The water vapor imagery (a type of satellite that measures the moisture in the atmosphere and depicts atmospheric motion quite well) below shows the large upper low as well as the upper level disturbances rotating around the low (marked with X’s).
How did the upper level disturbance produce all that snow?
.jpg)
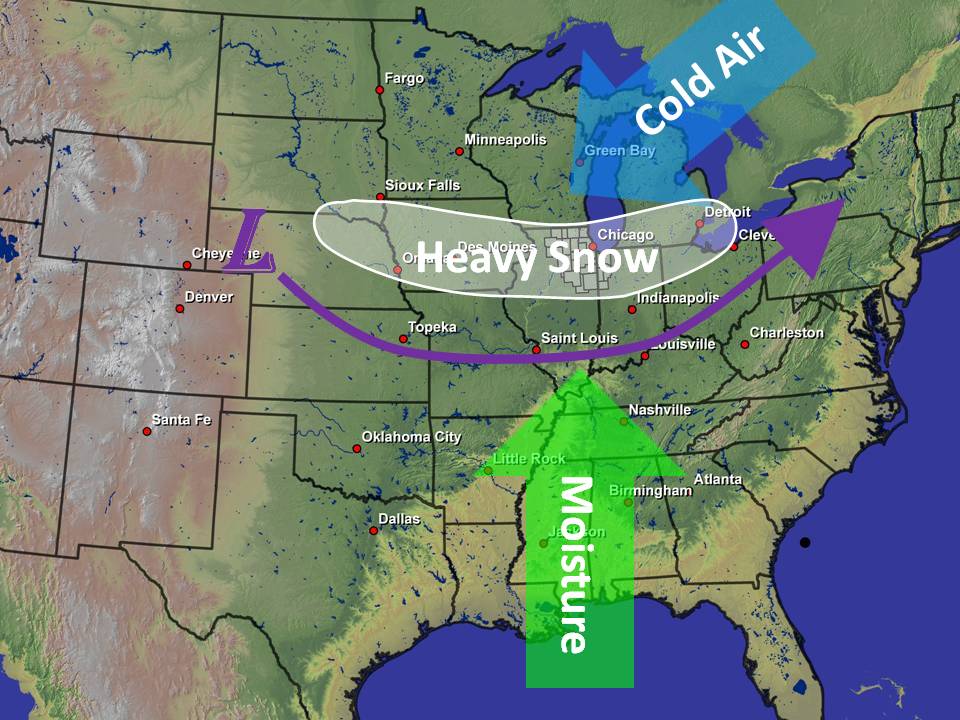
The image above shows a large dome of cold air over the western Great Lakes associated with a huge upper low that moved across the area Wednesday and Christmas Eve responsible for the freezing rain then locally heavy rain across the area. That upper low and its associated dome of cold air became nearly stationary as an upper level disturbance over the northern plains rotated slowly around the southwest periphery of the large upper low.
As this upper level disturbance rotated closer to the area Friday night into Saturday winds in the lower and middle levels of the atmosphere became stronger and a bit more southerly. The cold air associated with the upper low was heavy, dense, and not apt to move, so as the southerly winds blew into this cold dome and forced the air to rise causing snow to develop.
Why were the snow-to-liquid ratios so high with this storm?
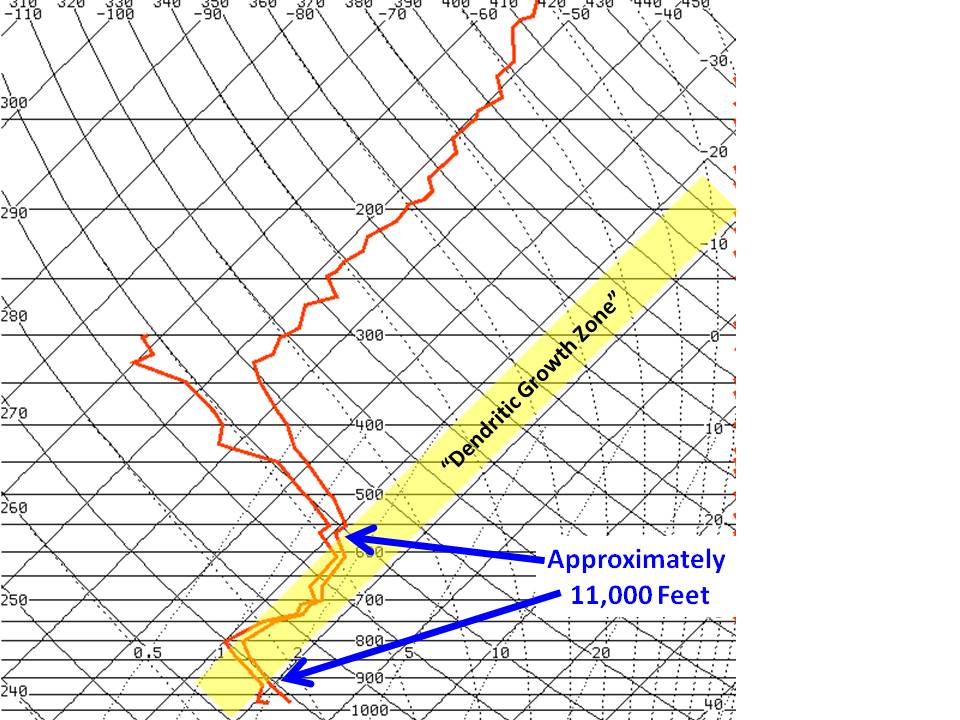
The temperature range within the cloud that makes dendrite flakes most likely to form is between -12C and -18C and this is the factor that is most able to be forecast. The deeper the layer of the atmosphere with temperatures between that range, the greater the opportunity there is for dendrites and the better the chances for very fluffy snow to occur. Below is a Skew-T chart of the observed temperatures and moisture from Davenport, IA from Saturday morning. The red lines on the chart are the temperature and dewpoint plots, while the solid black lines sloping from the bottom left to upper right is the temperature scale. In the Skew-T diagram below from Saturday the -12C to -18C temperature range is highlighted in yellow. This range of temperatures is often referred to as the “Dendritic Growth Zone” since it is where dendrite growth is favored. Notice that the depth of the “Dendritic Growth Zone” was nearly 11,000 ft, which is abnormally deep and quite favorable for the fluffy dendritic snow.