Coastal Storm Brought Heavy Rain, Coastal Flooding Oct 1-5, 2015


| Introduction:
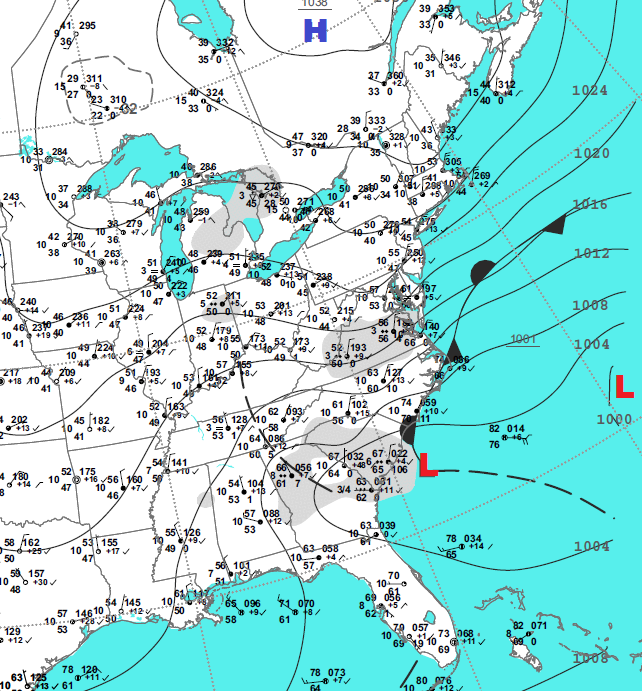
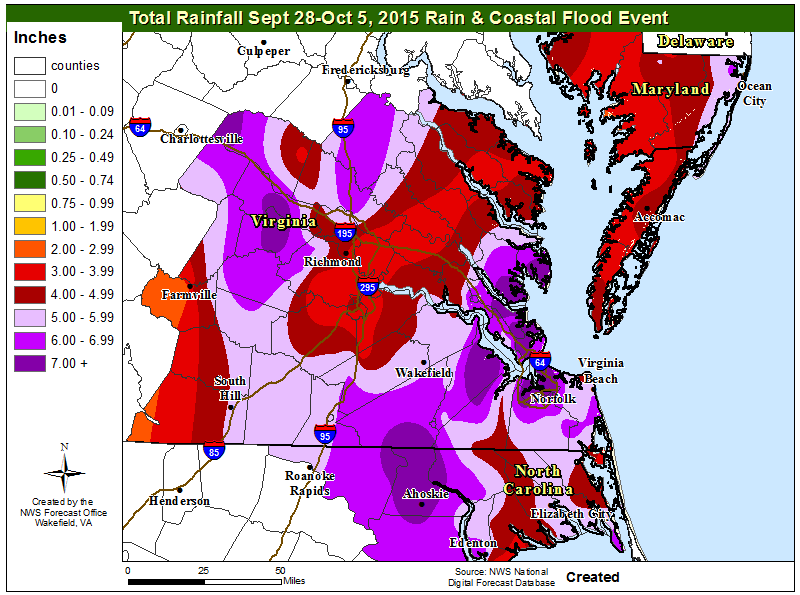
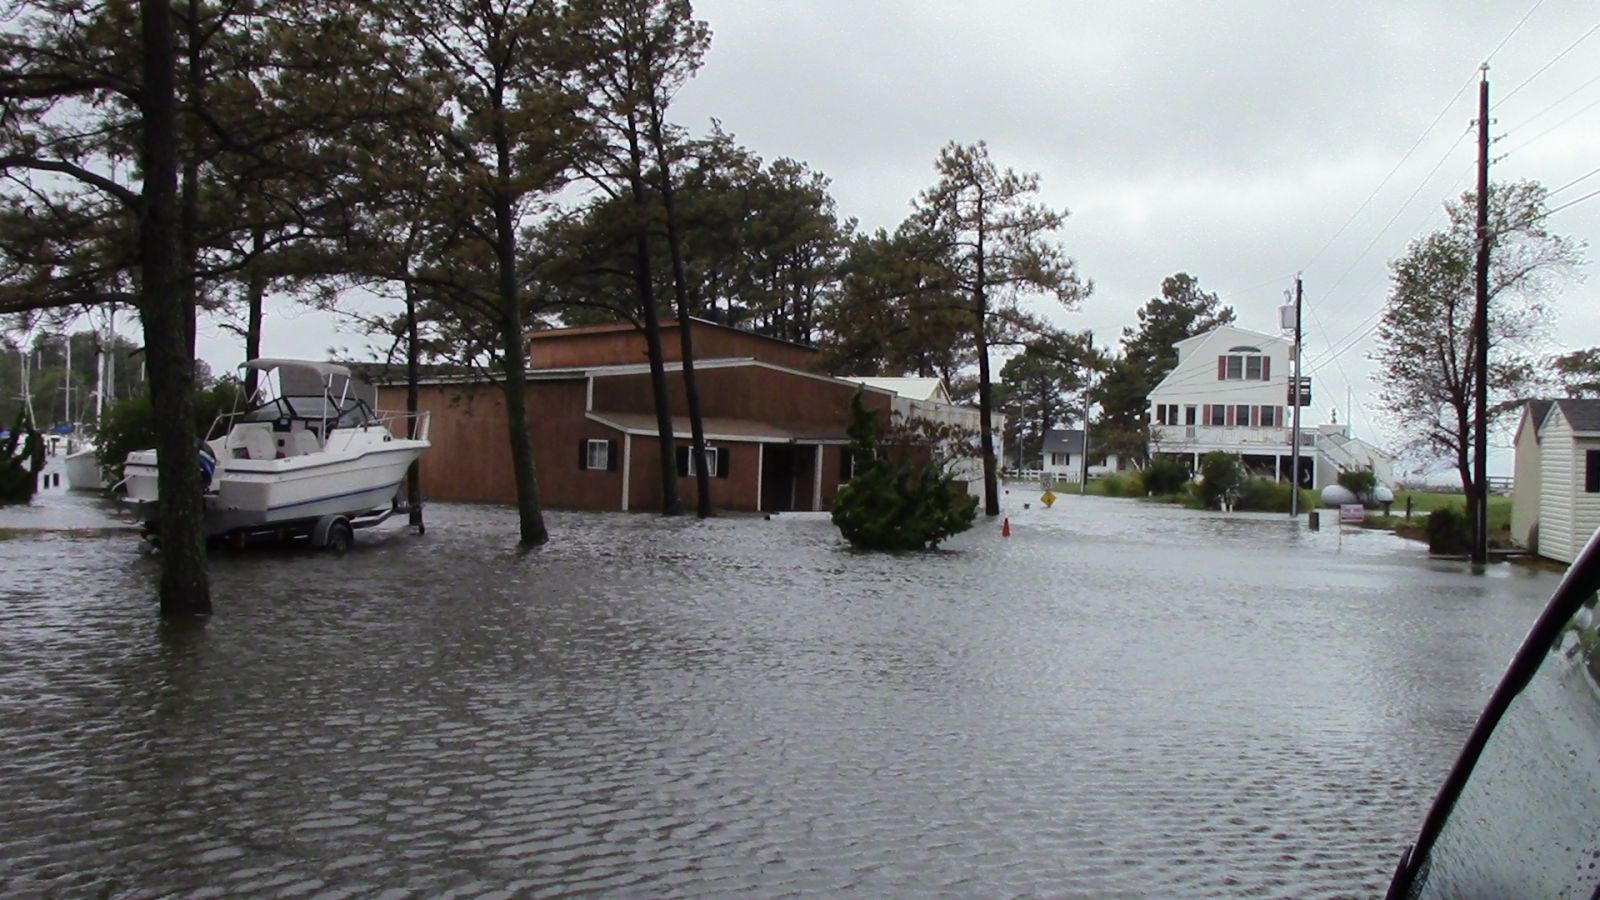
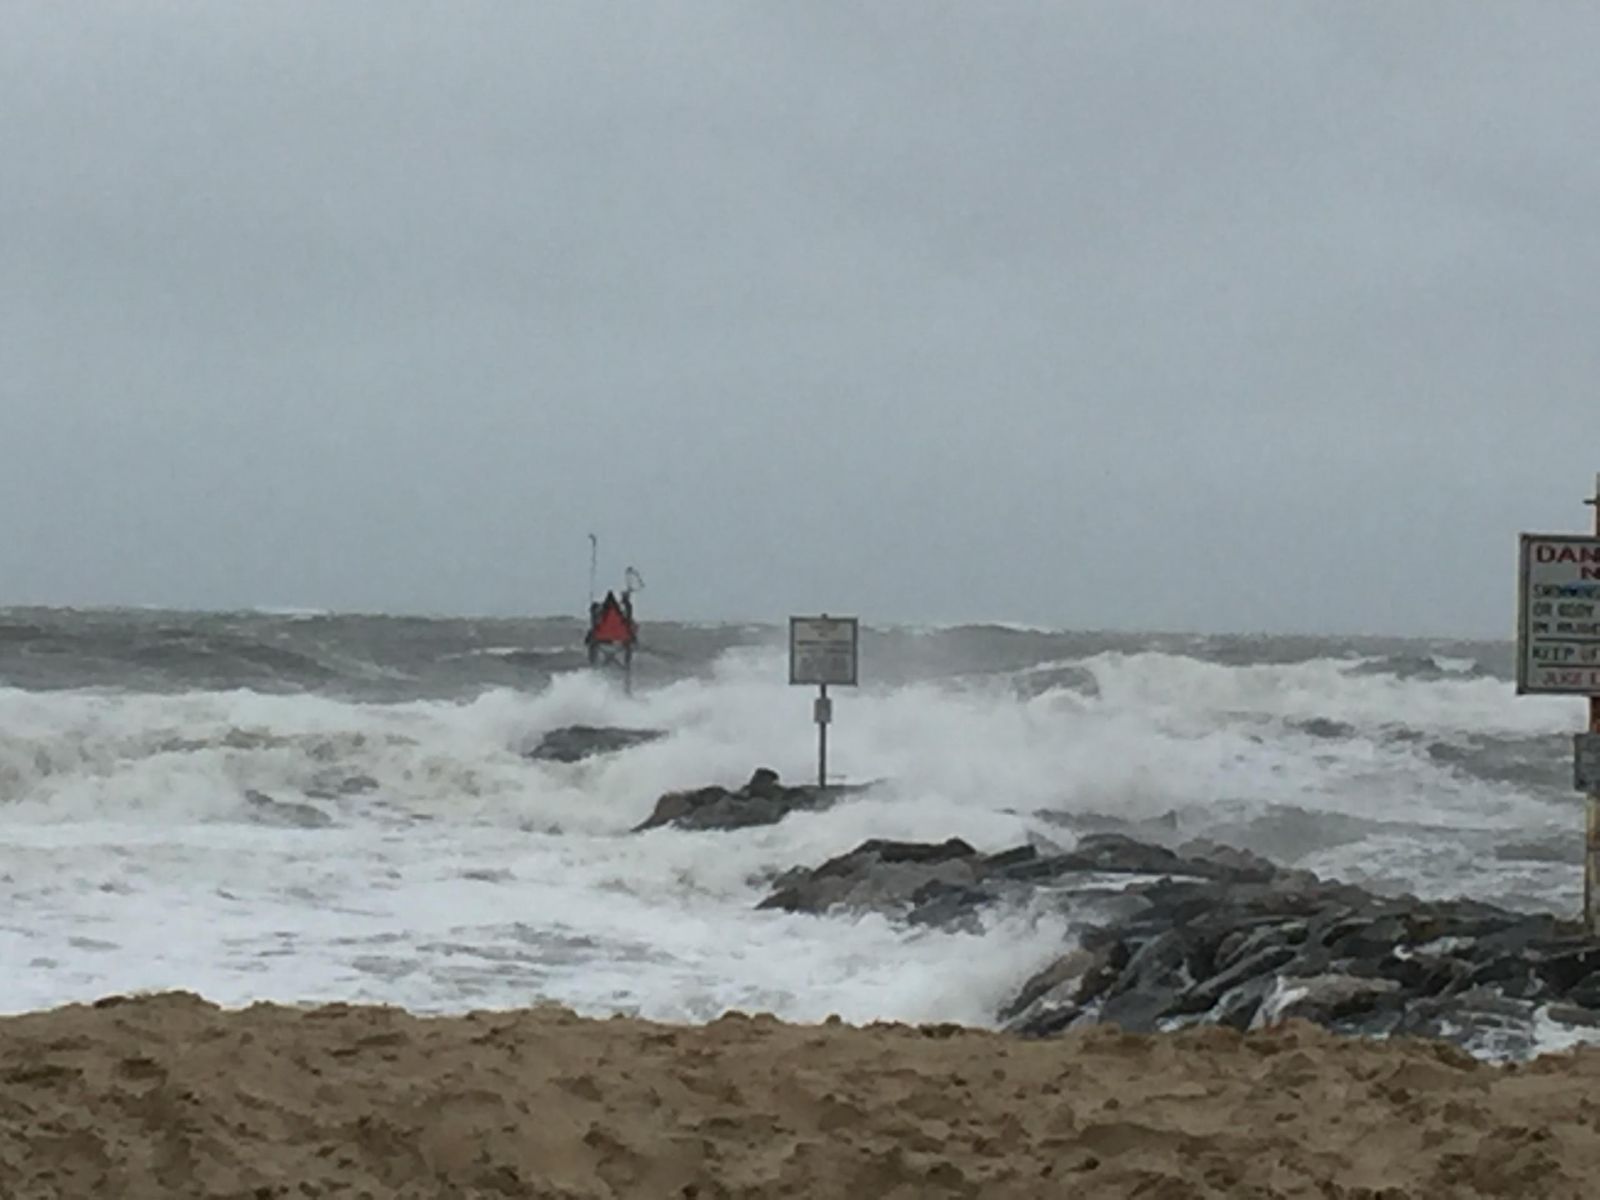
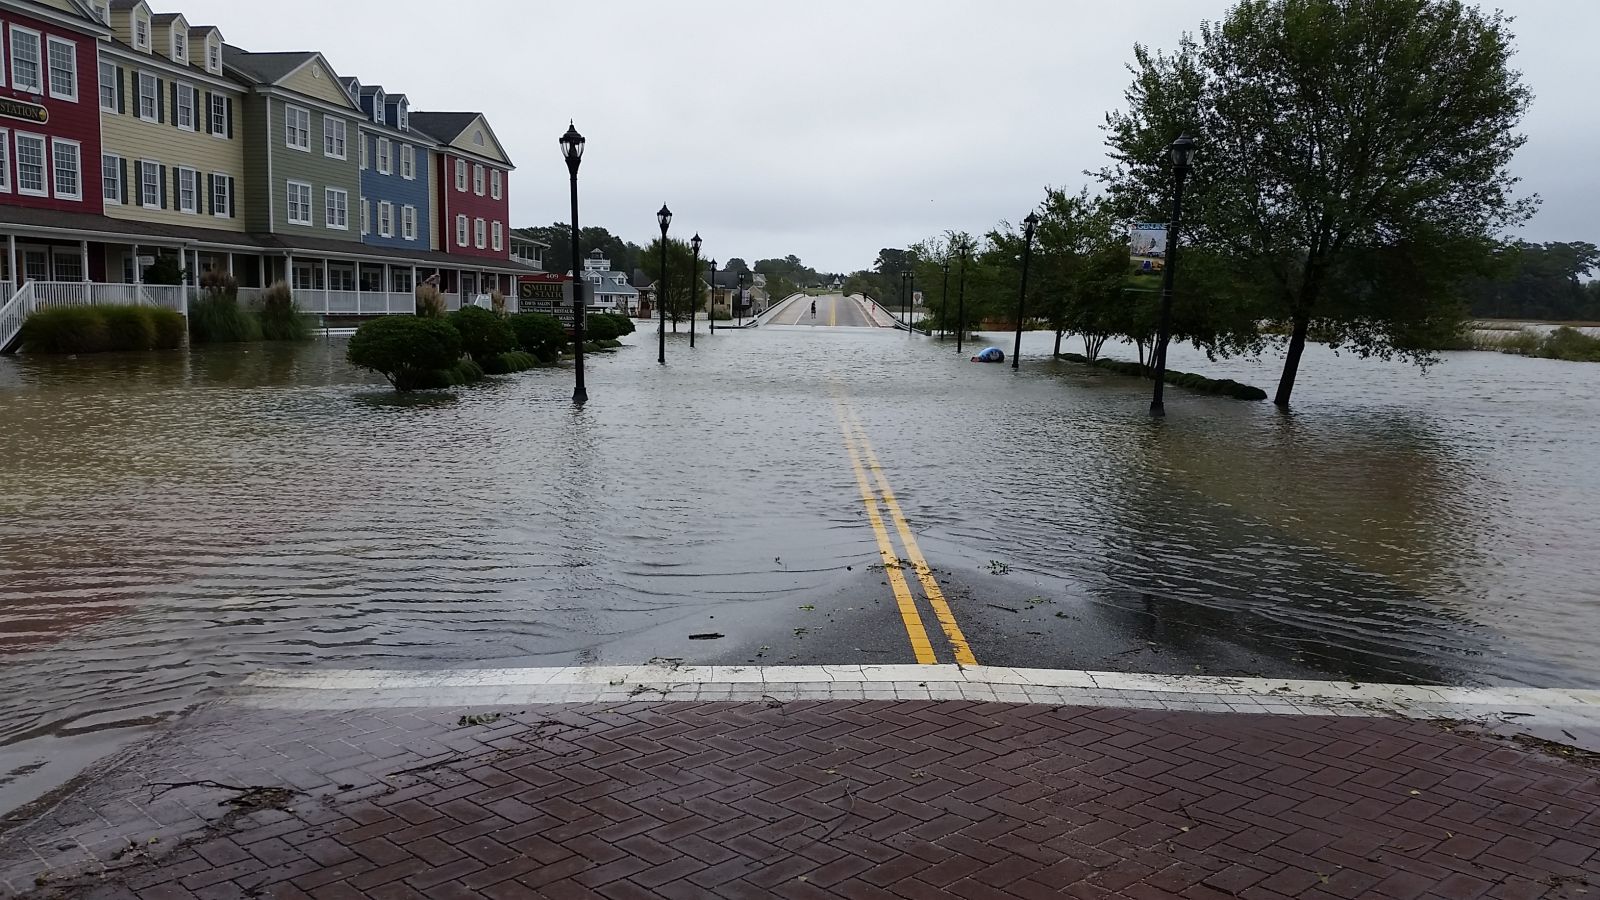
This brief overview will focus on the moderate to major coastal flooding that impacted tidal areas along the Chesapeake Bay and Atlantic Ocean during early October. Event Overview: Three weather features helped set the stage for some of the worst coastal flooding the region has seen since Hurricane Sandy in 2012. The first feature was Hurricane Joaquin. Joaquin evolved from a non-tropical low into a tropical depression on September 28, southwest of Bermuda. Joaquin then became a tropical storm on September 29, drifting slowly southwestward toward the Bahamas. Joaquin then underwent rapid intensification, reaching hurricane strength on September 30 and major hurricane (Cat 3) status on October 1. Against numerical guidance solutions, Joaquin continued to drift slowly to the southwest, before finally beginning to curve back to the north on October 2. On October 3, Joaquin began to increase forward speed, intensifying to Category 5 strength, acquiring sustained winds of 155 mph. This made Joaquin the strongest Atlantic hurricane since Hurricane Igor in 2010. The storms central pressure bottomed out at 931mb around 00z on October 2. Joaquin weakened, but remained a hurricane on October 4, passing well off the Mid-Atlantic Coast through October 6. While numerical and statistical guidance performed poorly with the track of Joaquin, this review will focus more on the impact of coastal flooding and not on Joaquin's track. The second feature was a cold front that swept across the Mid-Atlantic region the evening of September 30. The front then stalled just off the Mid-Atlantic coast on October 1, and remained along to just offshore through October 6. Height falls from a deepening eastern CONUS trough produced an area of low pressure off the SC coast, which provided the focus for an extreme rainfall event across the Carolinas. It wasn't until Hurricane Joaquin lifted well offshore that the front finally began to push well offshore. The front provided a focus, when coupled with prolonged onshore flow, for a prolonged period of cloudy and wet weather. Norfolk and Elizabeth City recorded 6 and 7 days of rainfall, respectively. Numerical and statistical guidance also struggled with rainfall amounts across the region, with as much as 7 to 10 inches forecast early in the event. Precipitation totals ended up in the 1 to 3 inch range inland and 3 to 6 inches in southeast Virginia. The highest amounts were recorded in Isle of Wight County and the Peninsula, where amounts up to 10 inches were reported. Heavy rainfall exacerbated the coastal flooding during periods of high tide. Numerous days of cloudy and wet weather also resulted in significant crop damage. The third, and perhaps most significant feature, was anomalous surface high pressure building across eastern Canada into New England. The surface high strengthened to 1046mb over Quebec on the morning of October 3 (Saturday morning). This represented a composite anomaly of 30+ mb for October 3. Then Cat 5 Hurricane Joaquin represented a composite anomaly of less than -25mb in the Atlantic. The large difference in pressure produced a very strong pressure gradient over the Mid-Atlantic Region. 850mb zonal wind (u-component) composite anomalies reached lower than -20 m/s over the local area as a result of the gradient between the high and Hurricane Joaquin on October 4. Surface wind anomalies were historic for early October. Surface zonal winds (u-component) were -23 kt 12Z October 4. Based on SPC sounding climatology at Wallops Island, the moving minimum for 04/12Z was -15.78 kt. The minimum was -9.19 kt. The surface meridional winds (v-component) were -17.5 kt 12Z October 4. The moving minimum was -15.74 knots and minimum was -14.01 kt. In addition to the strong onshore flow, the duration also proved a big factor in the coastal flooding. Winds at buoy 44009 had been onshore (varying from NE to SE) since September 20. Seas had been above 1.5 meters (5 ft) since September 21. Water was trapped in the bay as a result for several days before Hurricane Joaquin even formed. All the while, water levels were approaching a period of high astronomical tides. The new moon didn't occur until October 11, but astro tides were already approaching highest astronomical tide (HAT). In summary, the combination of Major Hurricane Joaquin and strong surface high pressure over eastern Canada and New England produced an extended period of strong onshore flow. Water levels were already elevated due to persistent onshore flow and high seas in combination with high astronomical tides. The result was a significant, multi-day coastal flood event. |


 Coastal Flood
 Heat
Heat