
Swells and high surf from both Imelda and Humberto are expected to bring dangerous marine conditions and rip currents to much of the East Coast over the next several days. A series of Pacific frontal systems will bring waves of showers and thunderstorms to portions of northern California and the Pacific Northwest through midweek. Read More >
November Climate Summaries
and December Outlook

For the full details check out: Click here For a larger view of the Duluth, Minnesota temperature graph provided by the Midwestern Regional Climate Center: Click here |

For the full details check out: Click here For a larger view of the International Falls, Minnesota temperature graph provided by the Midwestern Regional Climate Center: Click here |

For the full details check out: Click here For a larger view of the Brainerd, Minnesota temperature graph provided by the Midwestern Regional Climate Center: Click here |

For the full details check out: Click here For a larger view of the Hibbing, Minnesota temperature graph provided by the Midwestern Regional Climate Center: Click here |

For the full details check out: Click here For a larger view of the Ashland, Wisconsin temperature graph provided by the Midwestern Regional Climate Center: Click here |
December Climate Outlook
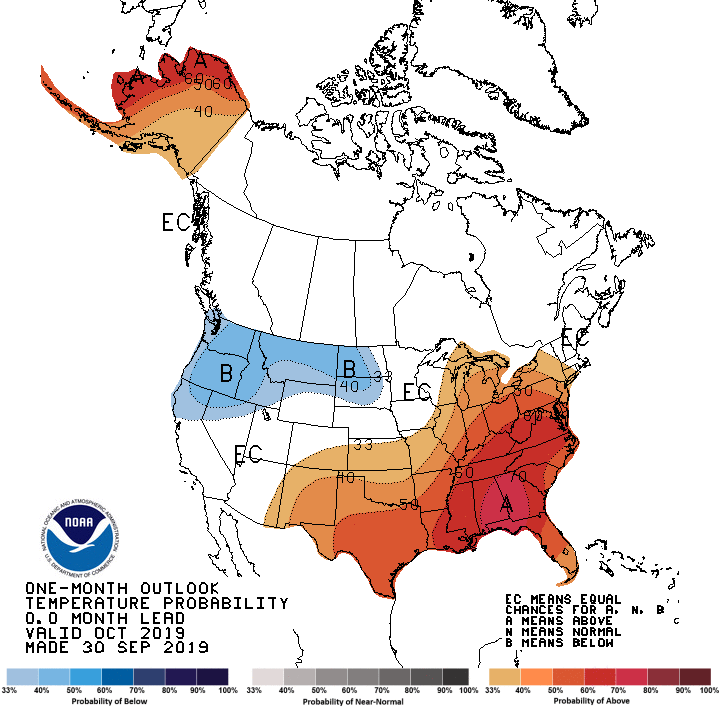
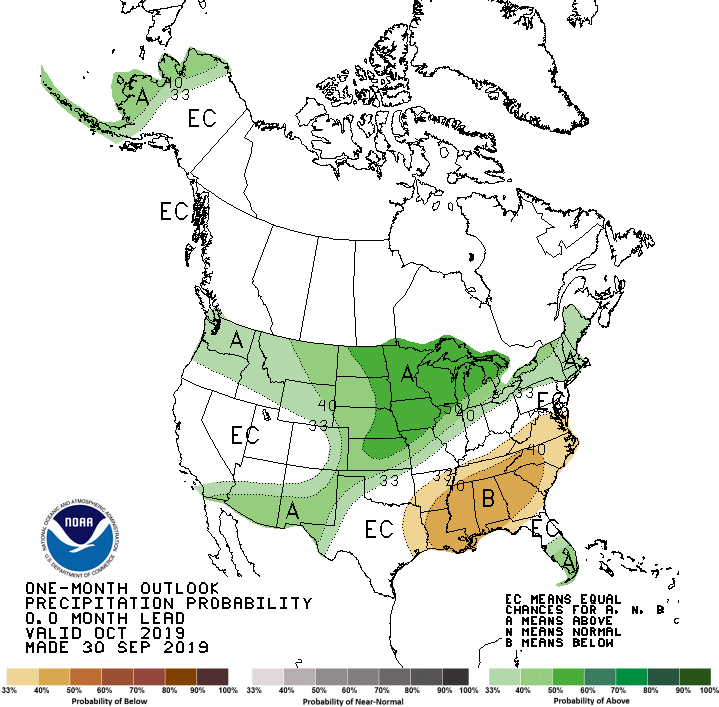
| Temperature Outlook | Precipitation Outlook |
 |
 |
|
Normal highs for Duluth, MN begin in the upper 20s at the beginning of the month and cool to the upper teens by the end of December. Normal lows for the month begin in the mid teens and cool to the single digits above zero by the end of the month. Normal precipitation for December is 1.21 inches. Normal snowfall for December is 17.7 inches. Normal highs for International Falls, MN begin the month in the mid 20s and cool to the mid teens by the end of December. Normal lows begin the month in the single digits above zero and cool to the single digits below zero by the end of the month. Normal precipitation for December is 0.81 inches. Normal snowfall for December is 31.0 inches. Normal highs for Brainerd, MN begin the month in the upper 20s and cool to the low 20s by the end of December. Normal lows begin in the mid teens and cool to the single digits above zero by the end of the month. Normal precipitation for December is 0.81 inches. Normal snowfall for December is 9.7 inches. Normal highs for Hibbing, MN begin the month in the mid 20s and cool to the upper teens by the end of December. Normal lows begin in the single digits above zero and cool to the single digits below zero by the end of the month. Normal highs for Ashland, WI begin the month in the low 30s and cool to the mid 20s by the end of December. Normal lows begin in the mid teens and cool to the single digits above zero by the end of the month. The latest Climate Prediction Center (CPC) outlook indicates that odds are tilted toward below normal temperatures across northeast Minnesota, and northwest Wisconsin for December. There is no strong signal toward above or below normal precipitation across all locations in the Northland. |
|
Duluth, MN
|
Normals for the Month of December |
||
|
The Normal, Monthly Average Temperature (degrees F) |
14.8 |
|
|
The Normal, Monthly High Temperature (degrees F) |
22.3 |
|
|
The Normal, Monthly Low Temperature (degrees F) |
7.3 |
|
|
|
|
|
|
Normal Monthly Precipitation (inches) |
1.21 |
|
|
Normal Monthly Snowfall (inches) |
17.7 |
|
|
|
|
|
|
Normal number of days with Measurable Precipitation |
10.5 |
|
|
Normal number of days with snow depth of 1 inch or greater |
5.0 |
|
|
|
|
|
|
Normal Heating Degree Days |
1556 |
|
|
Normal Cooling Degree Days |
0 |
|
|
|
||
|
Records for the Month of December |
||
|
Warmest Month (Monthly Average Temperature) |
32.7 in 1877 |
|
|
Coldest Month (Monthly Average Temperature) |
1.8 in 1983 |
|
|
Highest Observed Temperature (degrees F) |
56 on the 6th in 1939 |
|
|
Lowest Observed High Temperature (degrees F) |
-18 on the 23rd in 1983 |
|
|
Lowest Observed Temperature (degrees F) |
-35 on the 28th in 1917 |
|
|
Highest Observed Low Temperature (degrees F) |
42 on the 23rd in 1877 & on the 4th in 1941 |
|
|
|
|
|
|
Greatest Monthly Precipitation (inches) |
3.89 in 1879 |
|
|
Least Monthly Precipitation (inches) |
0.07 in 1905 |
|
|
Greatest Daily Precipitation (inches) |
1.91 on the 6th in 1950 |
|
|
|
|
|
|
Greatest Monthly Snowfall (inches) |
44.3 in 1950 |
|
|
Least Monthly Snowfall (inches) |
0.9 in 1905 |
|
|
Greatest Daily Snowfall (inches) |
23.2 on the 6th in 1950 |
|
|
Greatest Measured Snow Depth (inches) |
34 on the 31st in 1996 |
|
International Falls, MN
|
Normals for the Month of December |
||
|
The Normal, Monthly Average Temperature (degrees F) |
9.7 |
|
|
The Normal, Monthly High Temperature (degrees F) |
19.0 |
|
|
The Normal, Monthly Low Temperature (degrees F) |
0.4 |
|
|
|
|
|
|
Normal Monthly Precipitation (inches) |
0.81 |
|
|
Normal Monthly Snowfall (inches) |
15.0 |
|
|
|
|
|
|
Normal number of days with Measurable Precipitation |
10.7 |
|
|
Normal number of days with snow depth of 1 inch or greater |
4.8 |
|
|
|
|
|
|
Normal Heating Degree Days |
1714 |
|
|
Normal Cooling Degree Days |
0 |
|
|
|
||
|
Records for the Month of December |
||
|
Warmest Month (Monthly Average Temperature) |
22.8 in 1913 |
|
|
Coldest Month (Monthly Average Temperature) |
-4.3 in 1983 |
|
|
Highest Observed Temperature (degrees F) |
56 on the 1st & 3rd in 1962 |
|
|
Lowest Observed High Temperature (degrees F) |
-22 on the 31st in 1967 |
|
|
Lowest Observed Temperature (degrees F) |
-41 on the 19th in 1955 |
|
|
Highest Observed Low Temperature (degrees F) |
36 on the 2nd in 1982 & on the 5th in 2015 |
|
|
|
|
|
|
Greatest Monthly Precipitation (inches) |
2.00 in 2004 |
|
|
Least Monthly Precipitation (inches) |
0.07 in 1913 |
|
|
Greatest Daily Precipitation (inches) |
1.21 on the 5th in 1960 |
|
|
|
|
|
|
Greatest Monthly Snowfall (inches) |
43.9 in 1992 |
|
|
Least Monthly Snowfall (inches) |
2.5 in 1913 |
|
|
Greatest Daily Snowfall (inches) |
13.7 on the 14th in 2008 |
|
|
Greatest Measured Snow Depth (inches) |
25 on the 1st-6th in 1965 & on the 26th-27th & 31st in 1985 |
|
Brainerd, MN
|
Normals for the Month of December |
|
|
The Normal, Monthly Average Temperature (degrees F) |
15.3 |
|
The Normal, Monthly High Temperature (degrees F) |
24.0 |
|
The Normal, Monthly Low Temperature (degrees F) |
6.6 |
|
|
|
|
Normal Monthly Precipitation (inches) |
0.81 |
|
|
|
|
Normal Heating Degree Days |
1540 |
|
Normal Cooling Degree Days |
0 |
|
|
|
|
Records for the Month of December |
|
|
Warmest Month (Monthly Average Temperature) |
25.9 in 1931, and 1939 |
|
Coldest Month (Monthly Average Temperature) |
1.9 in 1985 |
|
Highest Observed Temperature (degrees F) |
61 on the 6th in 1939 |
|
Lowest Observed High Temperature (degrees F) |
-19 on the 24th in 1983 |
|
Lowest Observed Temperature (degrees F) |
-43 on the 19th in 1983 |
|
Highest Observed Low Temperature (degrees F) |
44 on the 1st in 1962 |
|
|
|
|
Greatest Monthly Precipitation (inches) |
2.34 in 1968 |
|
Least Monthly Precipitation (inches) |
0.06 in 1958 |
|
Greatest Daily Precipitation (inches) |
0.88 on the 4th in 1970 |
|
|
|
Hibbing, MN
|
Normals for the Month of December |
|
|
The Normal, Monthly Average Temperature (degrees F) |
11.3 |
|
The Normal, Monthly High Temperature (degrees F) |
21.3 |
|
The Normal, Monthly Low Temperature (degrees F) |
1.4 |
|
|
|
|
Normal Heating Degree Days |
1663 |
|
Normal Cooling Degree Days |
0 |
|
|
|
|
Records for the Month of December |
|
|
Warmest Month (Monthly Average Temperature) |
24.7 in 1939 |
|
Coldest Month (Monthly Average Temperature) |
-2.5 in 1983 |
|
Highest Observed Temperature (degrees F) |
60 on the 1st in 1962 |
|
Lowest Observed High Temperature (degrees F) |
-17 on the 23rd in 1983, and on the 20th in 1989 |
|
Lowest Observed Temperature (degrees F) |
-38 on the 19th in 1983 |
|
Highest Observed Low Temperature (degrees F) |
44 on the 3rd in 1951 |
|
|
|
Ashland , WI
|
Normals for the Month of December |
|
|
The Normal, Monthly Average Temperature (degrees F) |
18.4 |
|
The Normal, Monthly High Temperature (degrees F) |
26.0 |
|
The Normal, Monthly Low Temperature (degrees F) |
10.8 |
|
|
|
|
Normal Heating Degree Days |
1444 |
|
Normal Cooling Degree Days |
0 |
|
|
|
|
Records for the Month of December |
|
|
Warmest Month (Monthly Average Temperature) |
30.0 in 2015 |
|
Coldest Month (Monthly Average Temperature) |
5.5 in 1983 |
|
Highest Observed Temperature (degrees F) |
60 on the 19th in 1923, and on the 2nd and 3rd in 1982 |
|
Lowest Observed High Temperature (degrees F) |
-11 on the 19th in 1983 |
|
Lowest Observed Temperature (degrees F) |
-32 on the 25th in 1933 |
|
Highest Observed Low Temperature (degrees F) |
43 on the 7th in 1894 |
|
|
|

