
A cold front will work across the Eastern U.S. through Monday with scattered rain showers and thunderstorms before broad high pressure brings quiet weather by Tuesday. Across the Western U.S., a cold front will shift across the region through Tuesday. An Atmospheric River following the front will bring heavy coastal rain and high elevation snowfall to portions of the Northwest. Read More >
Basic Monsoon Information
Let's start off with some general information about monsoon season in northern Arizona:
What Exactly Is The Monsoon?
The term "monsoon" describes large-scale wind shifts that transport moist tropical air to dry desert locations, such as the southwestern United States. A monsoon pattern also affects several other locations around the world including Southeast Asia, Australia, Africa, and South America. The Indian Monsoon is the strongest in the world due to the height of the Tibetan Plateau.
So why do these wind shifts occur? Intense heating of the land over Mexico and the southwestern United States in the early summer months creates the wind shifts in the low levels. Moisture begins to be carried off of the Gulf of California and eastern Pacific Ocean (the two main sources for monsoonal moisture in northern Arizona). These winds transport moisture northward into Mexico and the American Southwest. Additionally, another key component of the monsoon development is in the upper levels of the atmosphere. A strong subtropical ridge of high pressure is located over Mexico during June which acts to block moisture flow toward the north. This is why northern Arizona normally sees some of the hottest and driest weather of the year during June. However, as we head into late June and early July the ridge of high pressure shifts northward into the Southern Plains or Southern Rockies. The shifting ridge axis allows low and mid level moisture to move northward. The combination of the low, mid, and upper level moisture surge to the north culminates in the real beginning of annual monsoon season. The combination of these atmospheric events are signs that forecasters watch for closely on long range model guidance leading up to the monsoon season.
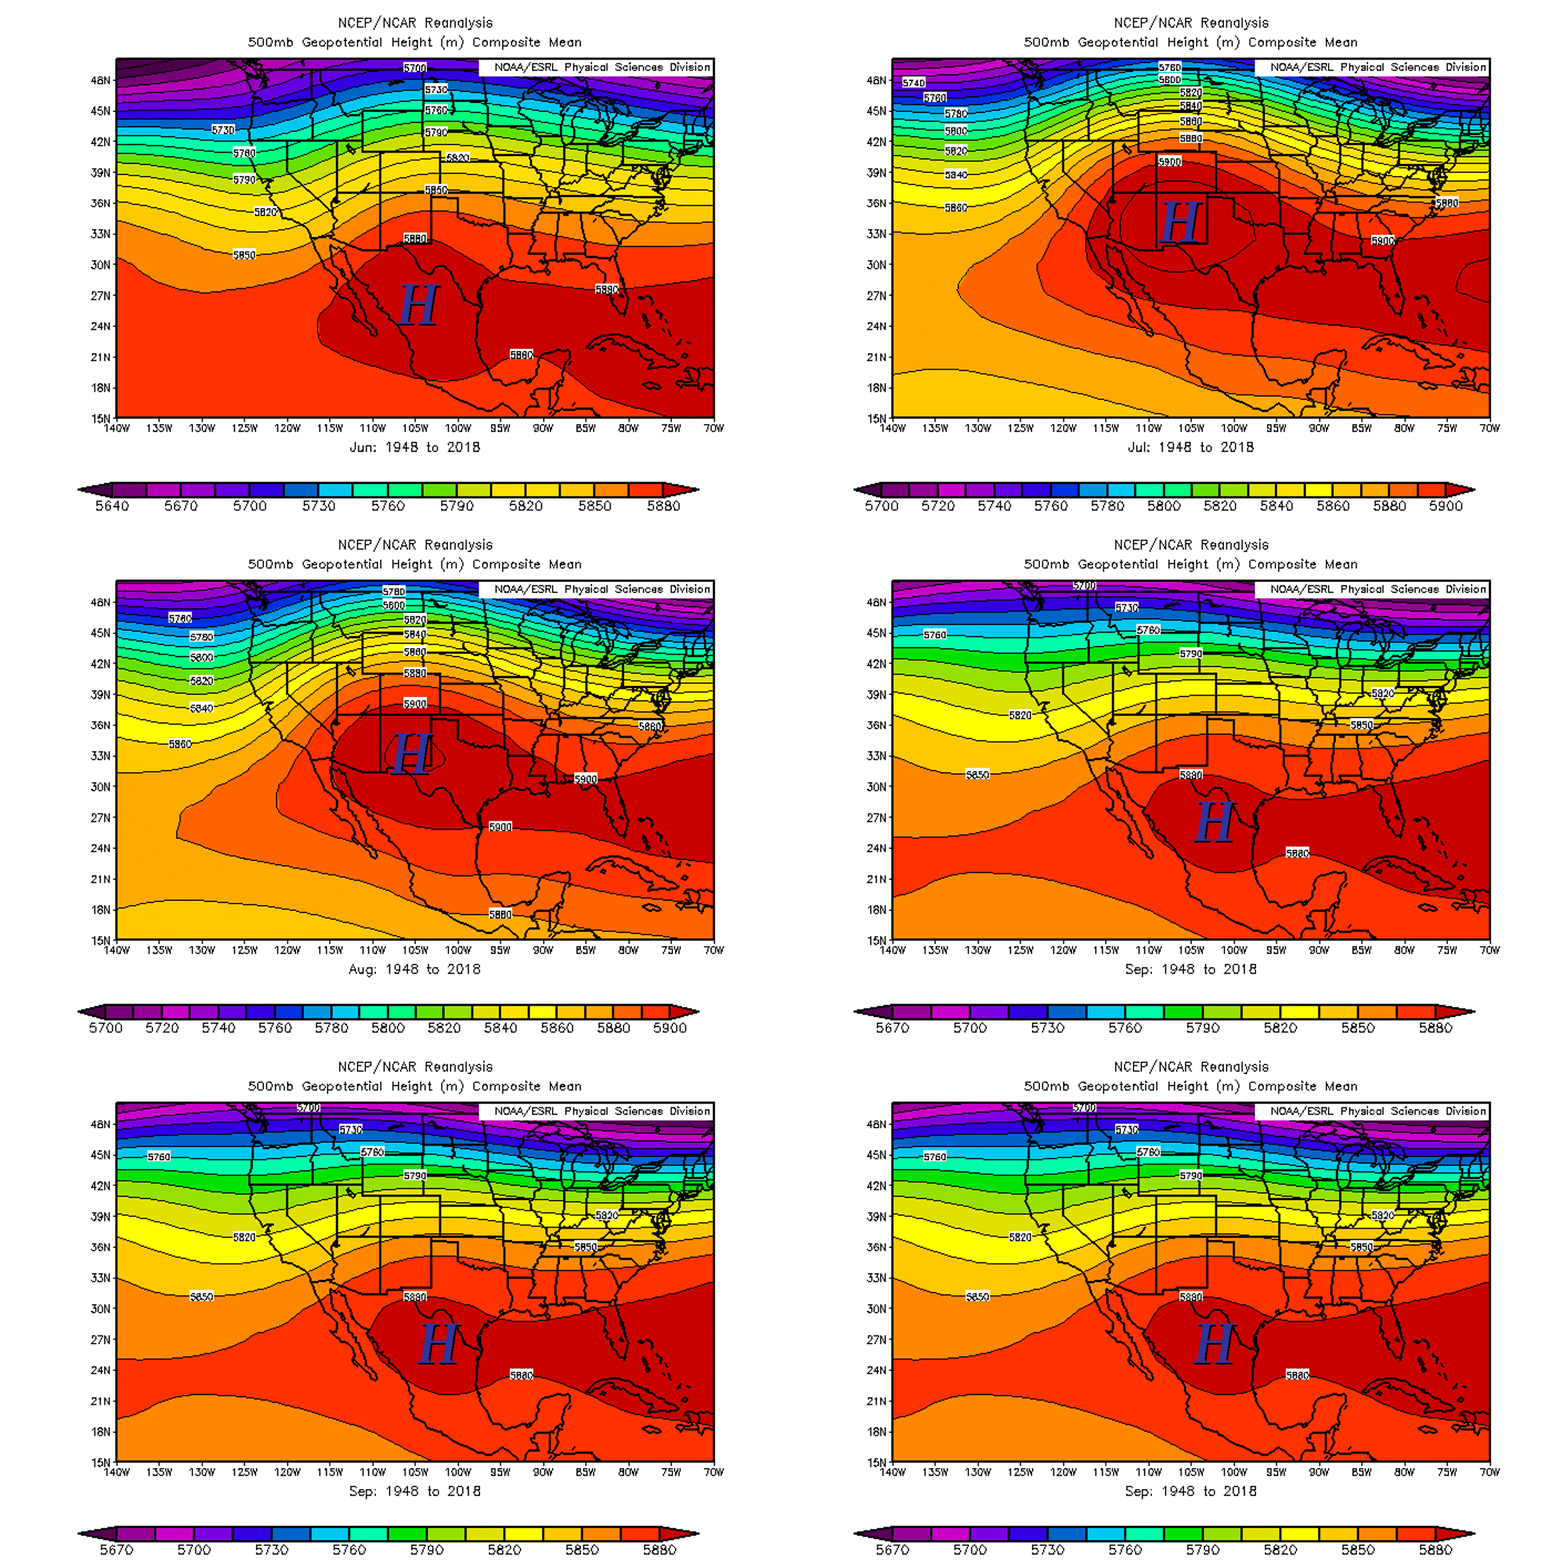
The strength and position of the subtropical ridge changes throughout monsoon season and plays an important role in the location and coverage of thunderstorms. This is why we see fluctuations in rainfall across the area from day to day. One positive trigger for rainfall during the monsoon season in northern Arizona is the high elevation area known as the Mogollon Rim. This land feature acts as a trigger for showers and thunderstorms on most days during the monsoon season.
In most years, the monsoon season begins to wind down across northern Arizona in September. There tends to be longer breaks between the rounds of showers and thunderstorms. This is because the atmosphere is not as warm and the weakened subtropical ridge has begun to shift southward again. However, this period can be where we see our most severe weather with cooler Pacific Ocean troughs combining with lingering monsoonal moisture.
Is Every Monsoon Season Similar?
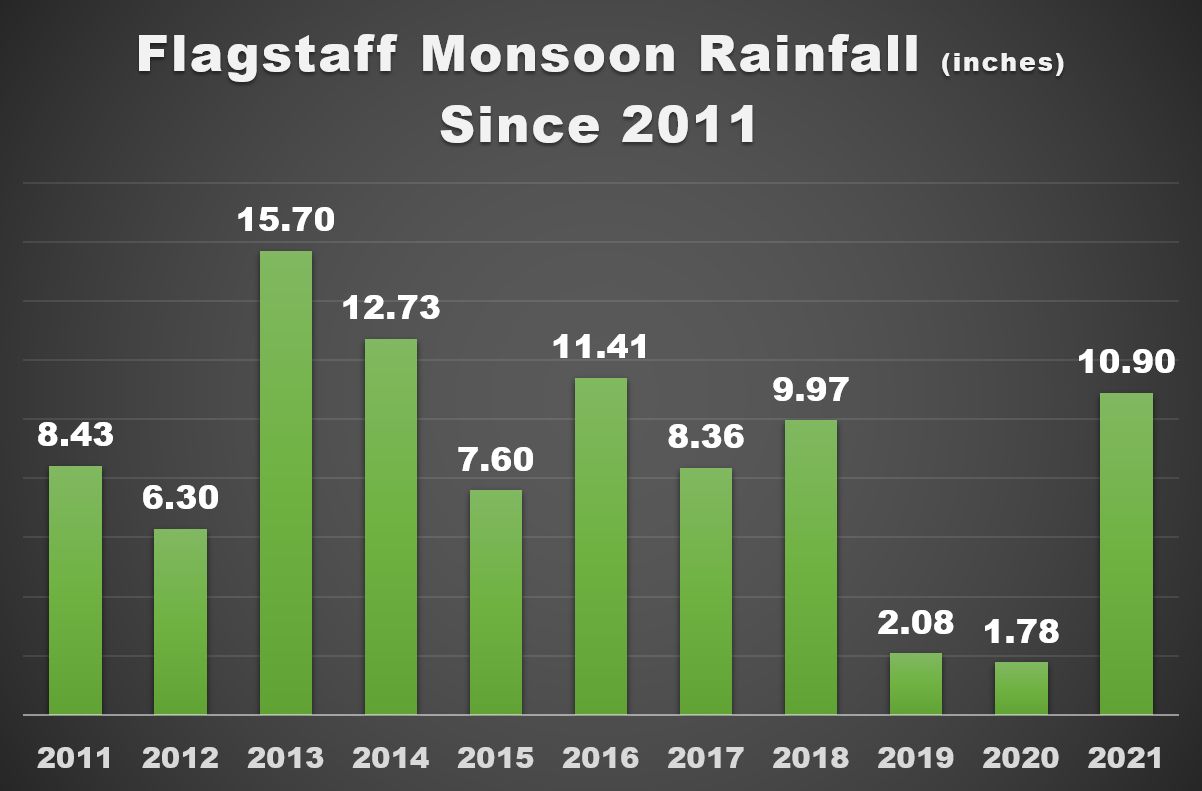
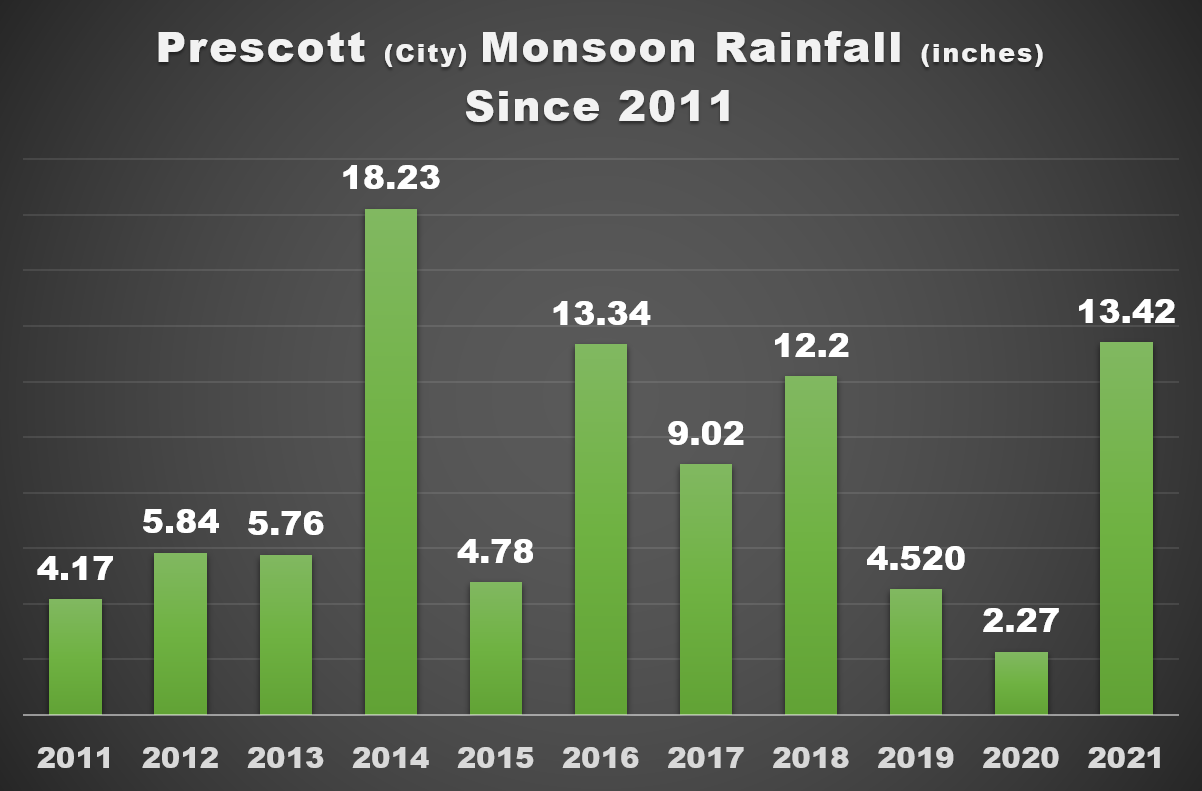
No, each monsoon season is different in almost every aspect from the onset/end, to the amount of available moisture and to the location of the heaviest rainfall. Precipitation totals vary widely each monsoon season and within each season, amounts change quite dramatically from city to city. The reason for this is the widely scattered nature of the monsoonal thunderstorms. Figures 2 and 3 below illustrate this concept well with the differences in precipitation between the two cities. As an example, during the 2013 monsoon season, Flagstaff recorded well above normal monsoon season total precipitation, while Prescott was almost two inches below normal.
Importance Of The Monsoon Season To Northern Arizona
The value of water across the American Southwest is well documented. Each monsoon season is viewed as a way to refill reservoirs and water supplies across the region. Forty to fifty percent of the annual precipitation falls during monsoon season. This is especially important to the many farmers and ranchers around northern Arizona who depend on this water to make a living.
Another aspect of monsoon season is the influence on the local fire weather season. The fire weather season in northern Arizona peaks near the end of June; as this is normally the warmest and driest period of the year. The beginning of the monsoon season continues the threat of fires as fire starts from dry lightning are common. However, after one to two weeks of widespread rainfall throughout early to mid July, the fire threat is greatly reduced during most years.
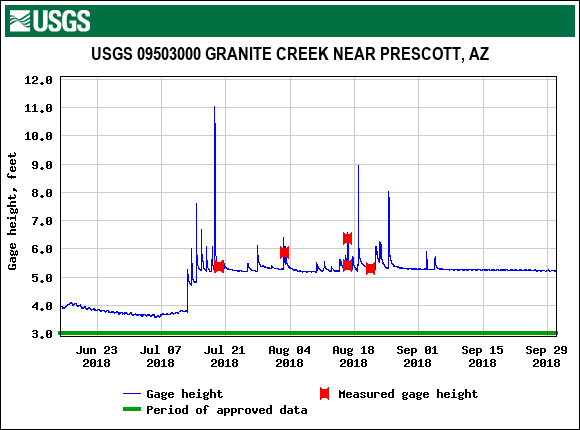

Let's take a look at how much rain normally falls across northern Arizona during the monsoon season. Amounts vary widely from year to year at any particular location due to the scattered nature of the monsoonal showers and thunderstorms. Even more monsoon rainfall statistics for Flagstaff.
| Normal Monsoon Rainfall (June 15th-September 30th) | ||||
| Location | Rainfall (Inches) | |||
|---|---|---|---|---|
| Alpine | 11.14 | |||
| Bagdad | 5.10 | |||
| Betatakin | 4.00 | |||
| Blue Ridge Ranger Station | 8.24 | |||
| Bright Angel Ranger Station | 6.64 | |||
| Canyon De Chelly NM | 3.37 | |||
| Cottonwood (Tuzigoot NM) | 5.21 | |||
| Flagstaff Airport | 7.68 | |||
| Heber (Black Mesa RS) | 7.80 | |||
| Jerome | 7.26 | |||
| Lee's Ferry | 3.17 | |||
| McNary | 10.92 | |||
| Montezuma Castle | 5.27 | |||
| Page | 2.03 | |||
| Payson | 7.09 | |||
| Petrified Forest | 4.46 | |||
| Phantom Ranch | 3.49 | |||
| Prescott (City) | 7.28 | |||
| Prescott Airport | 5.86 | |||
| Saint Johns | 5.16 | |||
| Seligman | 5.36 | |||
| Show Low Airport | 7.03 | |||
| Snowflake | 5.44 | |||
| Springerville | 7.17 | |||
| Sunset Crater NM | 8.00 | |||
| Walnut Canyon NM | 7.72 | |||
| Winslow Airport | 3.00 | |||
| Wupatki NM | 4.13 | |||
| Flagstaff | ||||
| Wettest | Driest | |||
| 1. | 20.00" (1986) | 1. | 1.78" (2020) | |
| 2. | 15.70" (2013) | 2. | 2.08" (2019) | |
| 3. | 13.95" (1904) | 3. | 2.31" (1978) | |
| 4. | 13.16" (1983) | 4. | 2.87" (2009) | |
| 5. | 12.73" (2014) | 5. | 2.94" (1991) | |
| 6. | 12.65" (1911) | 6. | 3.12" (1973) | |
| 7. | 12.21" (1990) | 7. | 3.22" (1957) | |
| 8. | 11.99" (1998) | 8. | 3.33" (1979) | |
| 9. | 11.99" (1919) | 9. | 3.80" (1942) | |
| 10. | 11.61" (1927) | 10. | 3.84" (1944) | |
| Prescott (City) | ||||
| Wettest | Driest | |||
| 1. | 18.23" (2014) | 1. | 2.27" (2020) | |
| 2. | 17.84" (1983) | 2. | 2.29" (1900) | |
| 3. | 16.40" (1984) | 3. | 2.68" (1978) | |
| 4. | 14.93" (1971) | 4. | 2.94" (1928) | |
| 5. | 13.75" (1958) | 5. | 3.19" (1979) | |
| 6. | 13.64" (1927) | 6. | 3.23" (1993) | |
| 7. | 13.61" (1970) | 7. | 3.25" (1944) | |
| 8. | 13.42" (2021) | 8. | 3.53" (1968) | |
| 9. | 13.34" (2016) | 9. | 4.12" (1980) | |
| 10. | 12.95" (1999) | 10. | 4.17" (2011) | |
| Payson | ||||
| Wettest | Driest | |||
| 1. | 14.74" (2021) | 1. | 2.90" (1979) | |
| 2. | 14.51" (1970) | 2. | 3.02" (1991) | |
| 3. | 13.58" (1963) | 3. | 3.51" (1960) | |
| 4. | 12.52" (1984) | 4. | 3.54" (1978) | |
| 5. | 12.51" (2004) | 5. | 3.61" (2020) | |
| 6. | 12.51" (1951) | 6. | 4.55" (1993) | |
| 7. | 12.30" (1954) | 7. | 4.62" (2015) | |
| 8. | 12.13" (1999) | 8. | 4.67" (1997) | |
| 9. | 12.01" (1990) | 9. | 4.72" (1995) | |
| 10. | 11.84" (2013) | 10. | 5.08" (1962) | |
Monsoon Awareness Week Videos
Monsoon 101
Lightning
Flash Flooding
Downbursts
Hiking Safety
Camping Safety
Debris Flows
Boating
Blowing Dust
How To Stay Safe During Monsoon Season
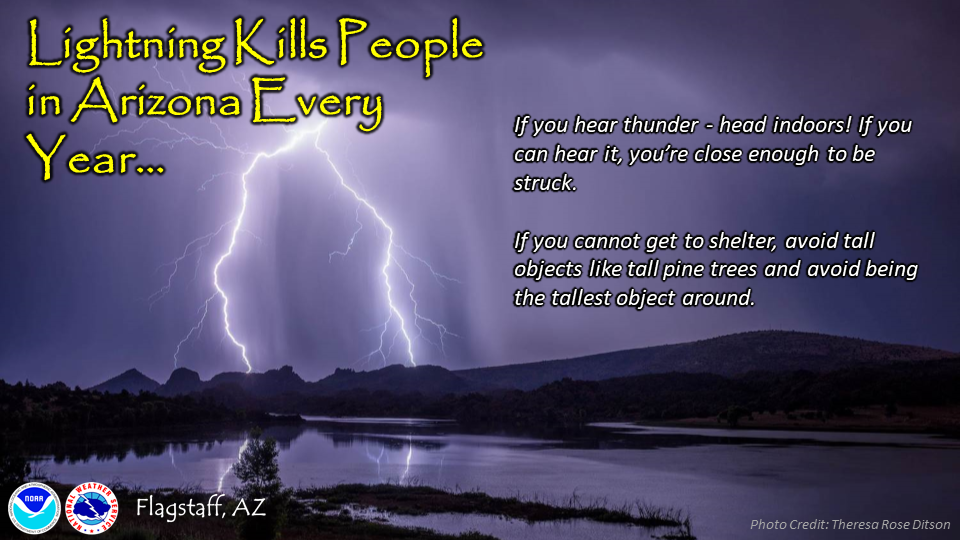
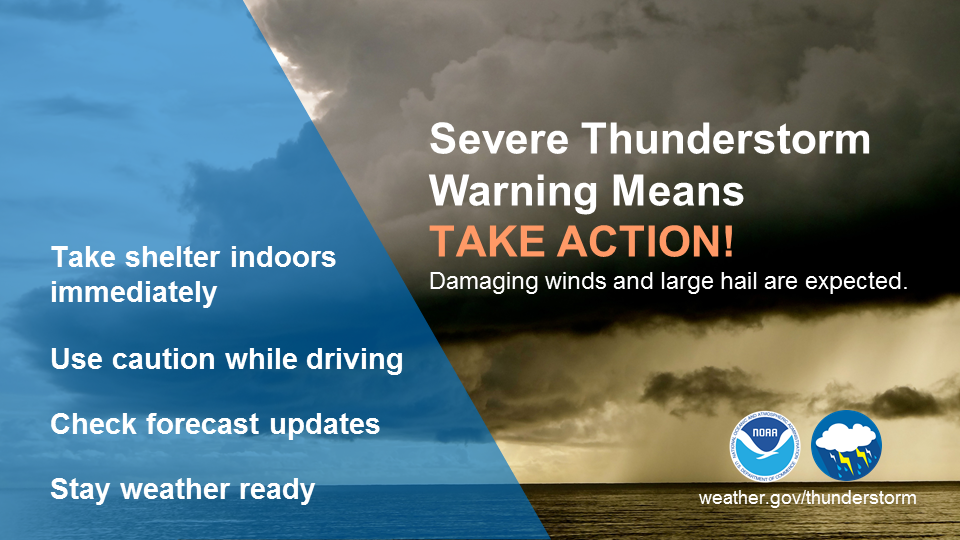
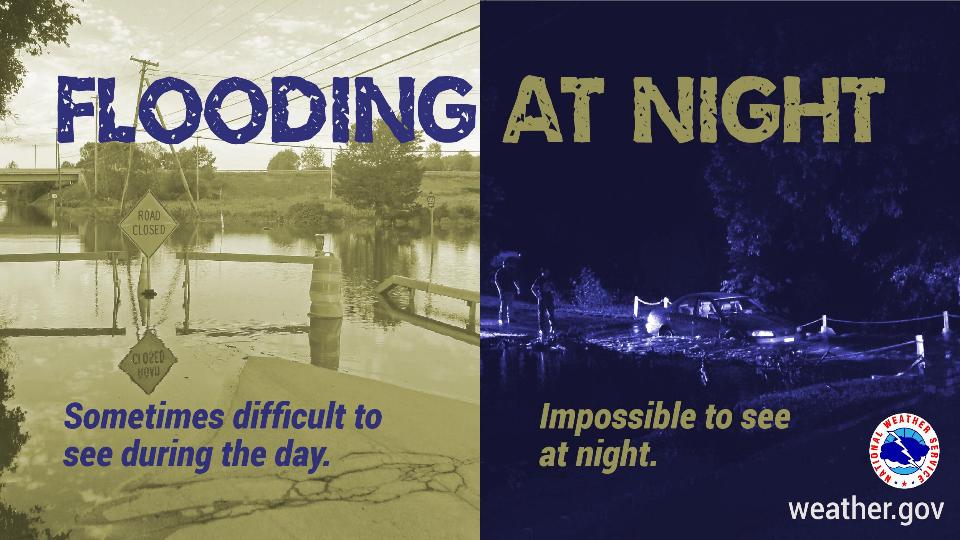
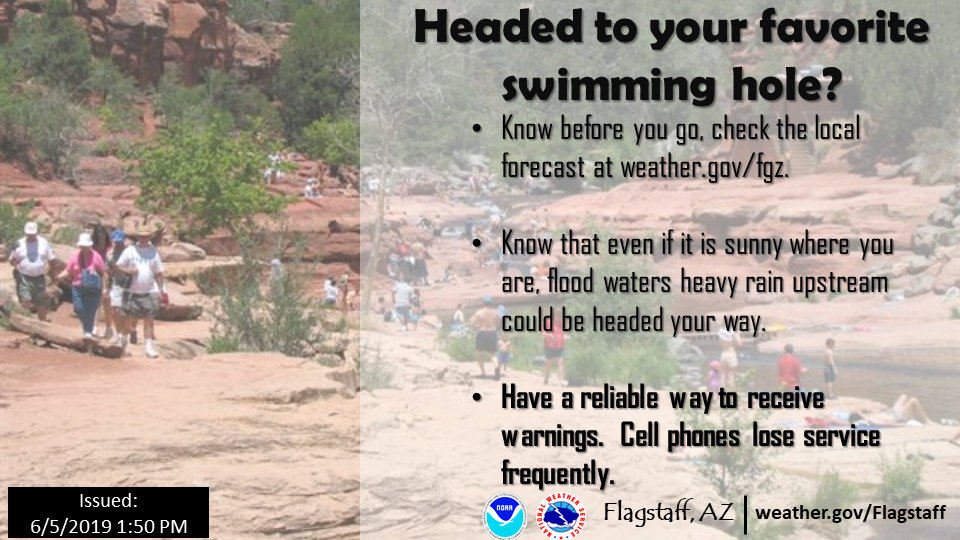
Northern Arizona offers a wide variety of outdoor recreation including hiking, mountain biking, slot canyons, swimming holes, and the Grand Canyon. However, Monsoon season provides dangerous threats to these activities with almost daily showers and thunderstorms across the area. Here are some of our key tips for staying safe during the summer months:
There is plenty of fun to be had in northern Arizona from mid June-late September, but be smart and always prepare for what hazards Monsoon season can bring!
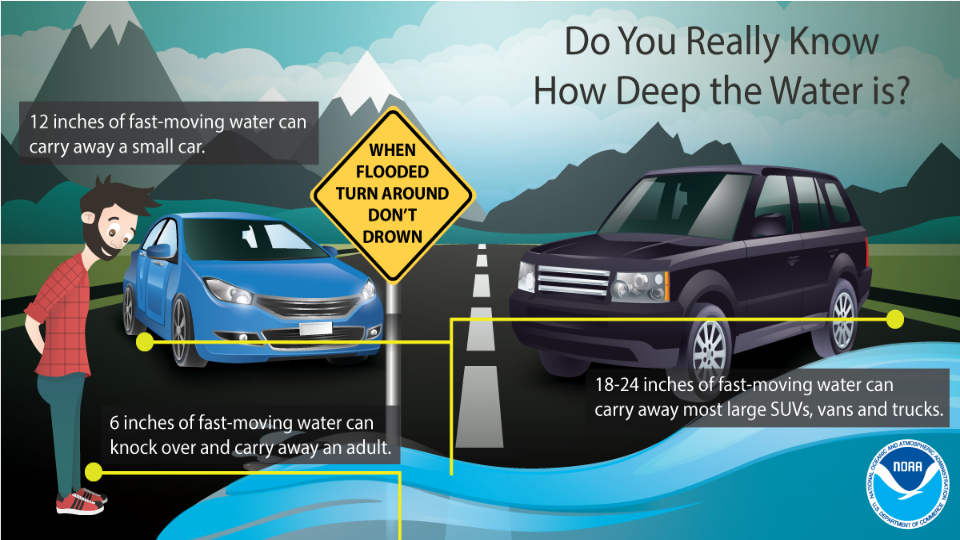
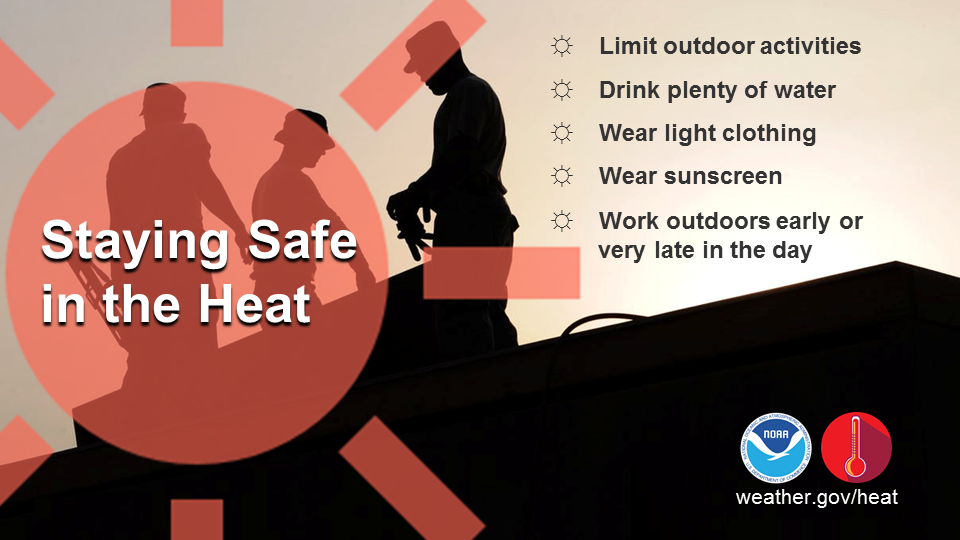
Monsoon Safety Graphics
2021 Arizona Monsoon Outlook
Climate Prediction Center Outlook Graphics
Current Three Month Temperature Outlook

Current Three Month Precipitation Outlook

Extended Three Month Temperature Outlook

Extended Three Month Precipitation Outlook

Here are a few other resources to use if you would like to learn more about the Southwest United States monsoon: