
Scattered thunderstorms with severe gusts, hail and a tornado risk are possible near a cold front from the Ohio Valley to the Mid-Atlantic tonight. Tropical Storm Bertha is expected to bring tropical storm conditions to portions of the Gulf Coast from the panhandle of Florida into Louisiana through Wednesday. Read More >
|
The Impact of Tropical Storm "Hermine" on the Western Carolinas and Northeast Georgia on 2-3 September 2016
1. Introduction Hurricane Hermine made landfall on the Florida coast just east of St. Marks at approximately 130 am EDT (0530 UTC) on Friday, 2 September 2016. Although the forecast cone of uncertainty for tropical storm force winds encompassed parts of upstate South Carolina and the western Piedmont of North Carolina for forecasts made during the afternoon and evening of 31 August 2016, at no point did the official track forecast from the National Hurricane Center take the center of the storm across any part of the county warning area (CWA) of the Greenville/Spartanburg (GSP) National Weather Service (NWS) office. Hermine weakened quickly to a Tropical Storm over extreme south Georgia near Valdosta at 0900 UTC on 2 September, and ultimately tracked northeastward across the Low Country of South Carolina during the afternoon and evening of 2 September (Fig. 1). NOTE: All times from this point forward will be referenced to Universal Time Coordinated (UTC), which is Eastern Daylight Time plus four hours. 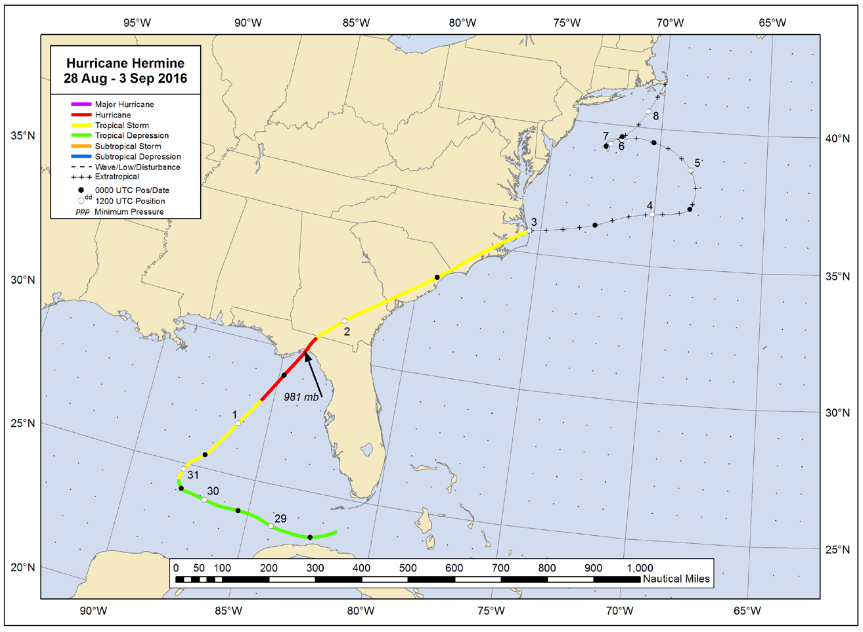
Fig. 1. Locations of the center of circulation of Tropical Cyclone “Hermine” from National Hurricane Center best track data. Image courtesy of the National Hurricane Center. Click on image to enlarge. The passage of Hermine had minimal effect on the western Carolinas and northeast Georgia, with minor wind damage and rainfall insufficient to produce flooding. The low impact was not unexpected given the location of landfall and the forecast track of Hermine, relative to the climate record of tropical cyclones (TC) that affect the GSP CWA as discussed in the next section. Most of the wind damage was observed across the Charlotte, North Carolina, metropolitan area, mainly trees blown down in parts of Union County and Mecklenburg County, North Carolina (Fig. 2). A severe thunderstorm produced wind damage over Laurens County, South Carolina. Most of the significant precipitation (i.e., greater than two inches) for the 48-hour period ending at 1200 UTC on 3 September fell across the area generally along and to the south and east of Interstate 85 (Fig. 3). The majority of the rainfall occurred with the passage of a surface boundary in advance of Hermine on 1 September, as discussed in a subsequent section. Flooding was not observed in part because of dry antecedent conditions across the region as of the end of August (Fig. 4). 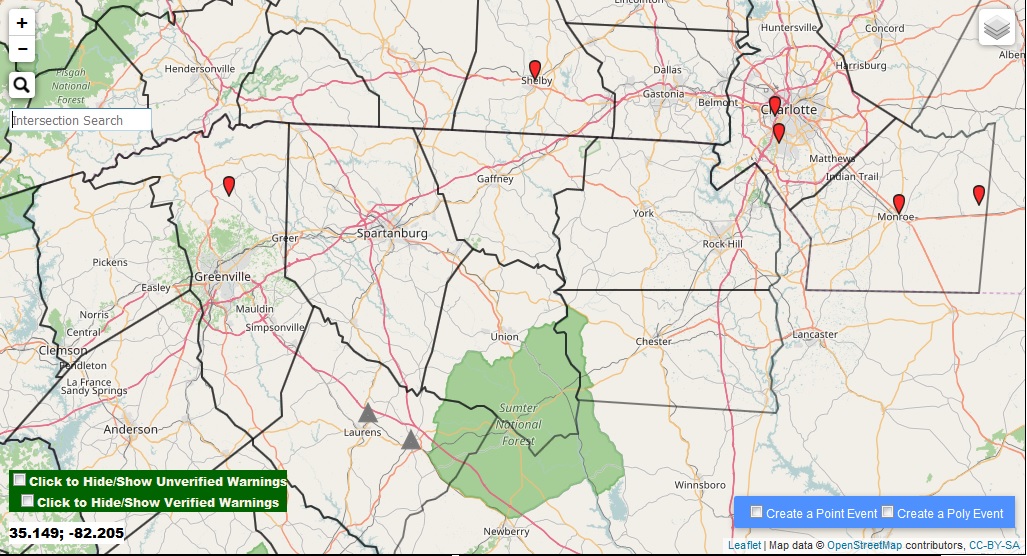
Fig. 2. Location of severe weather reports for the 48 hour period ending 1200 UTC on 3 September 2016. Thunderstorm wind damage is shown by a gray triangle and non-thunderstorm wind damage is shown by a red marker. Click on image to enlarge. 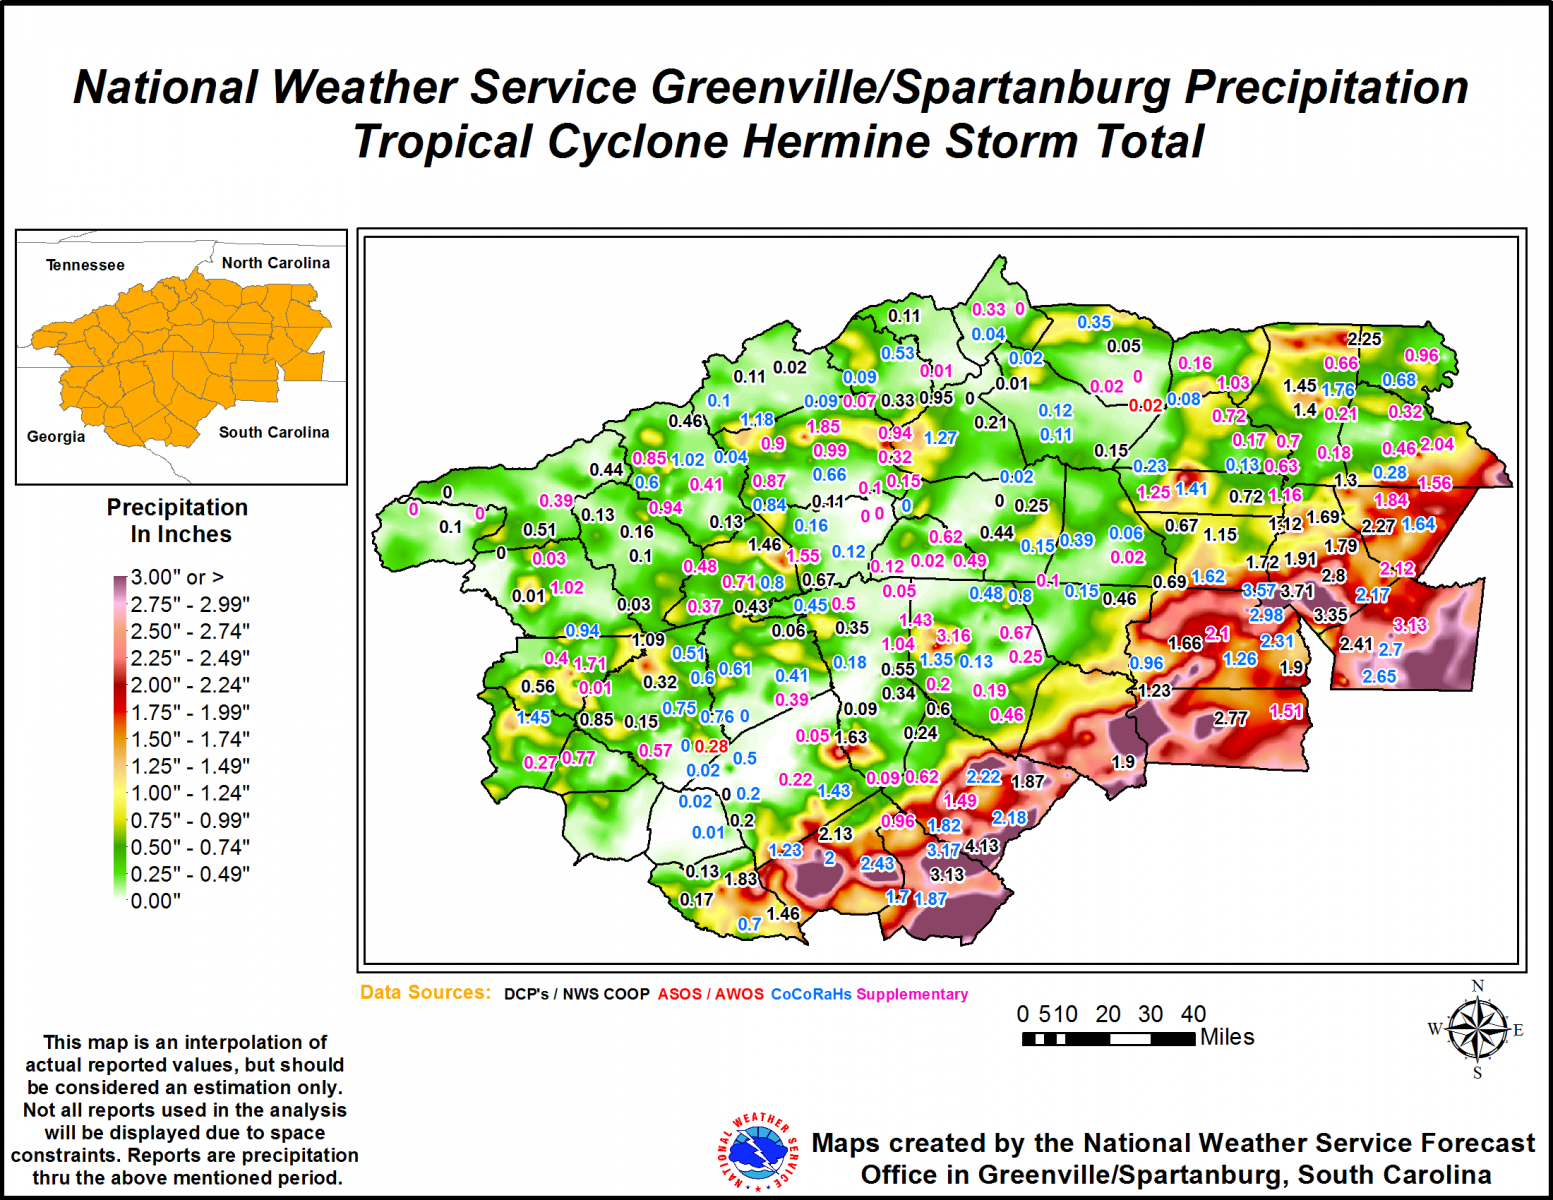
Fig. 3. Rainfall amounts for the GSP CWA for the 48-hour period ending 1200 UTC on 3 September 2016. Click on image to enlarge. 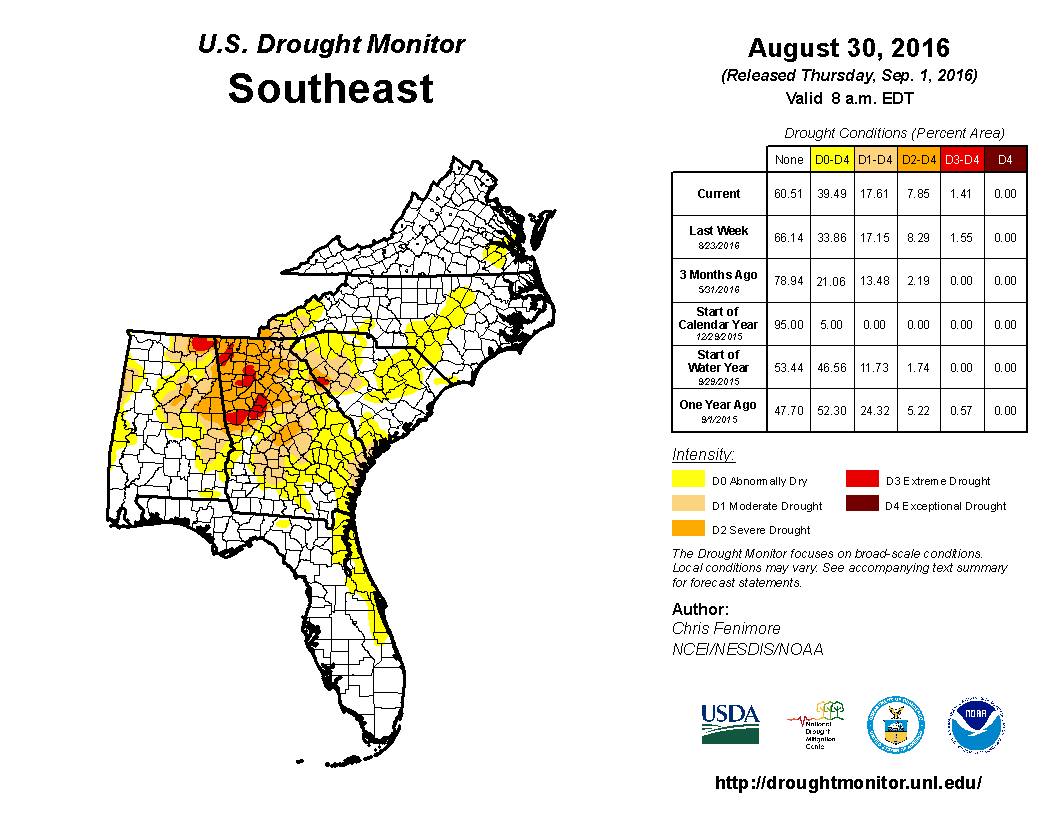
Fig. 4. Drought monitor for the Southeast United States for the week ending 30 August 2016. Click on image to enlarge. 2. Hermine Track and Tropical Cyclone Climatology At least 36 tropical cyclones or remnants thereof have been identified in the climate record (1851-2015) as having tracked across part of the GSP CWA. Of those tropical cyclones, 20 either formed over the Gulf of America or had a substantial portion of the track across the Gulf (Fig. 5). Two additional storms crossed the Florida peninsula moving northwestward and briefly emerged over the Apalachee Bay, but were not considered. Only two of the 20 storms made landfall east of Apalachicola, Florida. Thus, from a climatological perspective, the track of Hermine, with a landfall east of Apalachicola, missing the GSP CWA was a relatively common event (i.e., a 90 percent occurrence). The track of Hermine kept the GSP CWA in the northwest quadrant of the storm as it passed, in a location climatologically unfavorable for significant impact for a storm before extratropical transition. 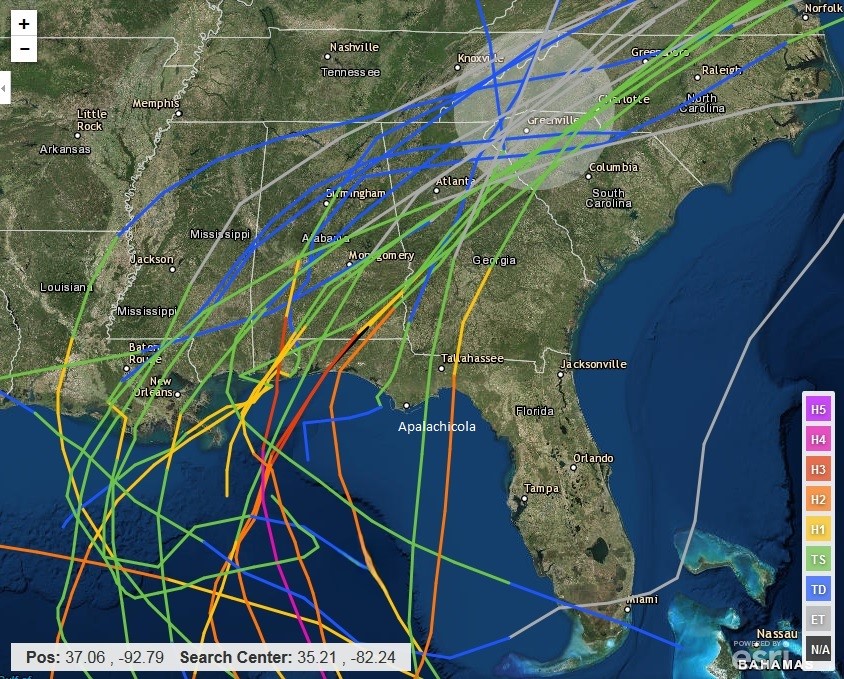
Fig. 5. Tropical cyclone tracks for the period 1851 to 2015 for storms with landfall along the Gulf of America, passing through an area within a 100 mile radius of Tryon, North Carolina (shown by the gray circle). Storm intensity is given by the color table in the lower right of the figure. Click on image to enlarge. 3. Preliminary Rainfall Discussion A preliminary round of rainfall affected mainly the eastern third of the GSP CWA on 1 September 2016 before the passage of the main circulation of Hermine late on 2 September 2016. The rainfall event occurred as a result of moisture related to Hermine, but happened prior to the arrival of Hermine. The question as to whether this rainfall event prior to Hermine can be considered an objectively classified Predecessor Rainfall Event (PRE, Cote 2007) can therefore be posed. The objective criteria for a PRE, defined using the PRE-relative composite analyses of Cote (2007) and Galarneau et al. (2010), will be used to evaluate this rainfall event. First, the favorability of the synoptic and mesoscale environment during and immediately preceding the rainfall event will be assessed. According to the conceptual model presented by Bosart and Carr (1978) in their analysis of the excessive rainfall event preceding Agnes in 1972, a 500 mb trough approaching, yet still to the west of the TC location was the most favorable configuration for PRE development. A mid-level trough was present over the eastern U.S. in the hours just before and during the rainfall event, as can be observed in the 500 mb height analysis at 0000 UTC on 2 September 2016 (Fig. 6). 
Fig. 6. Storm Prediction Center (SPC) objective analysis of geopotential height (dm; gray contours), temperature (degrees C; dashed red contours), and wind (kt; barbs) at 500 hPa, valid 0000 UTC 2 September 2016. Click on image to enlarge. According to the same study, the area most favorable for a PRE was that located under the right entrance region (right rear quadrant) of an upper level jet streak, as that area was subject to quasi-geostrophic forcing for lift, or upward motion. It was apparent in the 250 mb analysis valid 2 September 2016 at 0000 UTC (Fig. 7) that the southern Appalachians, including parts of the GSP CWA, were roughly located near the right entrance region of a jet streak that was passing over the northeast United States. 
Fig. 7. SPC objective analysis analysis of isotachs (kt; gray contours and color fill above 70 kt) and streamlines (gray contours) at 250 hPa, valid 0000 UTC 2 September 2016. Click on image to enlarge. At the surface, a frontal boundary/low-level baroclinic zone was present near the border of upstate of South Carolina/western North Carolina, poleward of the TC and coincident with the location of substantial upper support at 0000 UTC on 2 September 2016 (see surface analysis in Fig. 8). As was apparent in the 700 mb plot from 0000 UTC 2 September 2016 (Fig. 9), much of the GSP CWA was under the influence of low-level flow that was cyclonic and roughly parallel to the surface boundary and 700 mb moisture gradient, rather than the more favorable perpendicular configuration for PRE events (Galarneau et al., 2010). This cyclonic surface flow also lends some doubt to another PRE qualifier - clear separation between the PRE and the TC itself, with moisture from the TC advected poleward to the PRE area (Cote 2007). Cyclonic flow would indicate the GSP CWA was already under the influence of the outer circulation of Hermine, so the precipitation preceding Hermine was not separate from the TC. The rainfall, in fact, appears to be the result of an outer rainband, and a possible connection to Hermine’s central dense overcast (CDO) was implied by satellite water vapor imagery (Fig. 10). 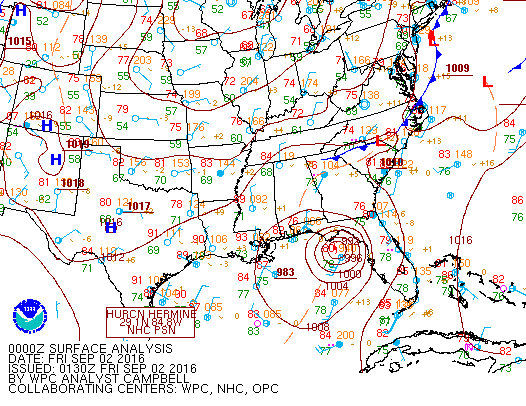
Fig. 8. Weather Prediction Center analysis of sea level pressure (mb; gray contours) and surface fronts at 0000 UTC 2 September 2016. Click on image to enlarge. 
Fig. 9. SPC objective analysis of geopotential height (dm; dark gray contours), temperature (degrees C; dashed red contours above zero, dashed blue contours zero and below), dewpoint (degrees C; green contours above -4), and wind (kt; barbs) at 700 hPa, valid 0000 UTC 2 September 2016. Click on image to enlarge. 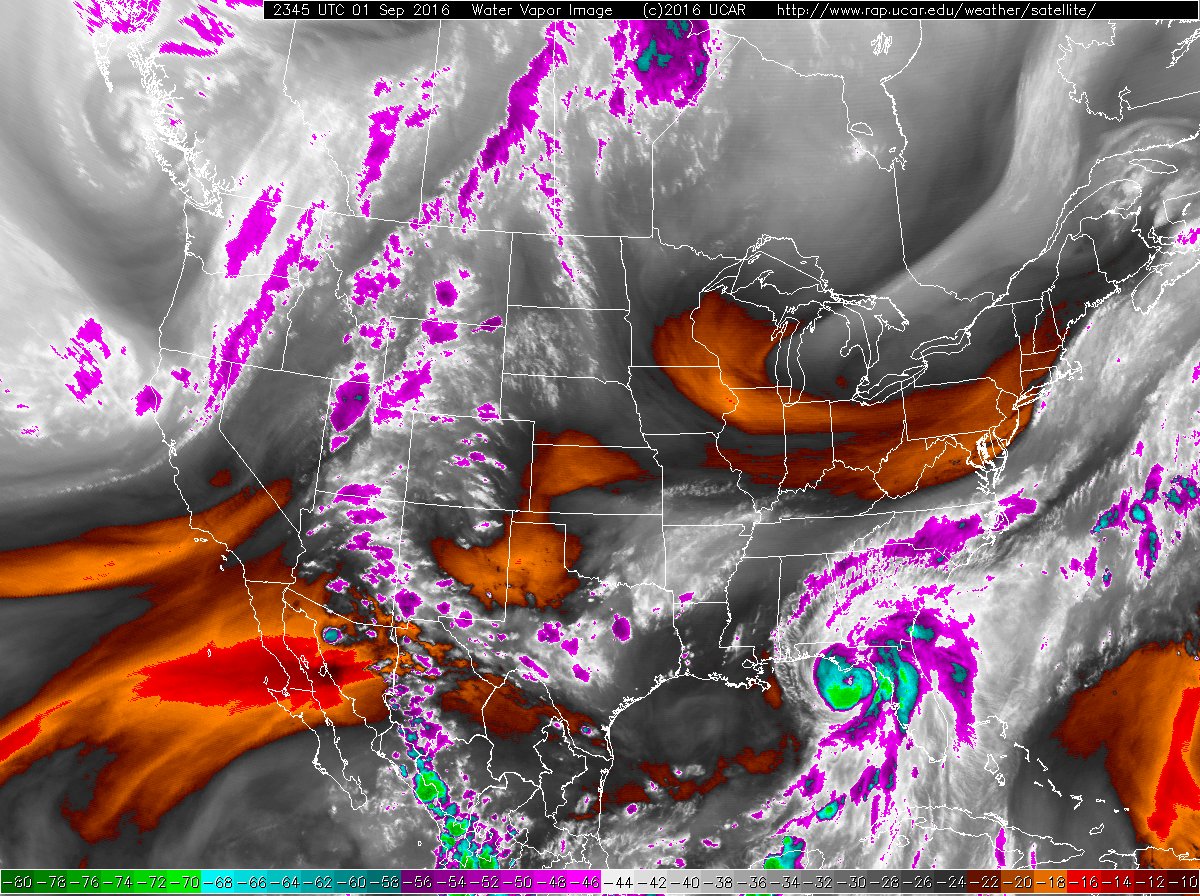
Fig. 10. Water vapor imagery mosaic valid 2345 UTC 1 September 2016. Click on image to enlarge. Following Cote (2007), the study of Galarneau and Bosart (2010) required rainfall rates equivalent to or greater than 100 mm (approximately 4 inches) in 24 hours to constitute a PRE. In the GSP CWA (and South Carolina), though locally heavy rain was reported in some locations, rainfall totals prior to the arrival of Hermine were generally 3 inches or less, under the threshold established in the literature. Figure 11 displays the rainfall accumulations from 1200 UTC 1 September 2016 to 1200 UTC 2 September 2016, which encompasses the rainfall prior to the arrival of Hermine’s main area of circulation in the GSP CWA. The continuity of the rain shield on radar and the presence of numerous echoes above 35 dBZ appear to meet those PRE criteria from Galarneau et al. (2010), and the rainfall persisted more than 6 hours. In order to assess separation distance between the rainfall associated with a PRE and rainfall due to the TC itself, Cote (2007) and Galarneau and Bosart measured the minimum distance between the PRE rain shield (visible in reflectivity, or water vapor imagery, as in Fig. 10) and any rainfall directly associated with the TC (also visible in reflectivity or water vapor imagery), including outer rain bands. As stated previously, the rainfall before the arrival Hermine may have been the result of an outer rainband and not separate from Hermine’s outer circulation, so the separation distance between the pre-TC rainfall event and Hermine (another PRE criterion) cannot be assessed. 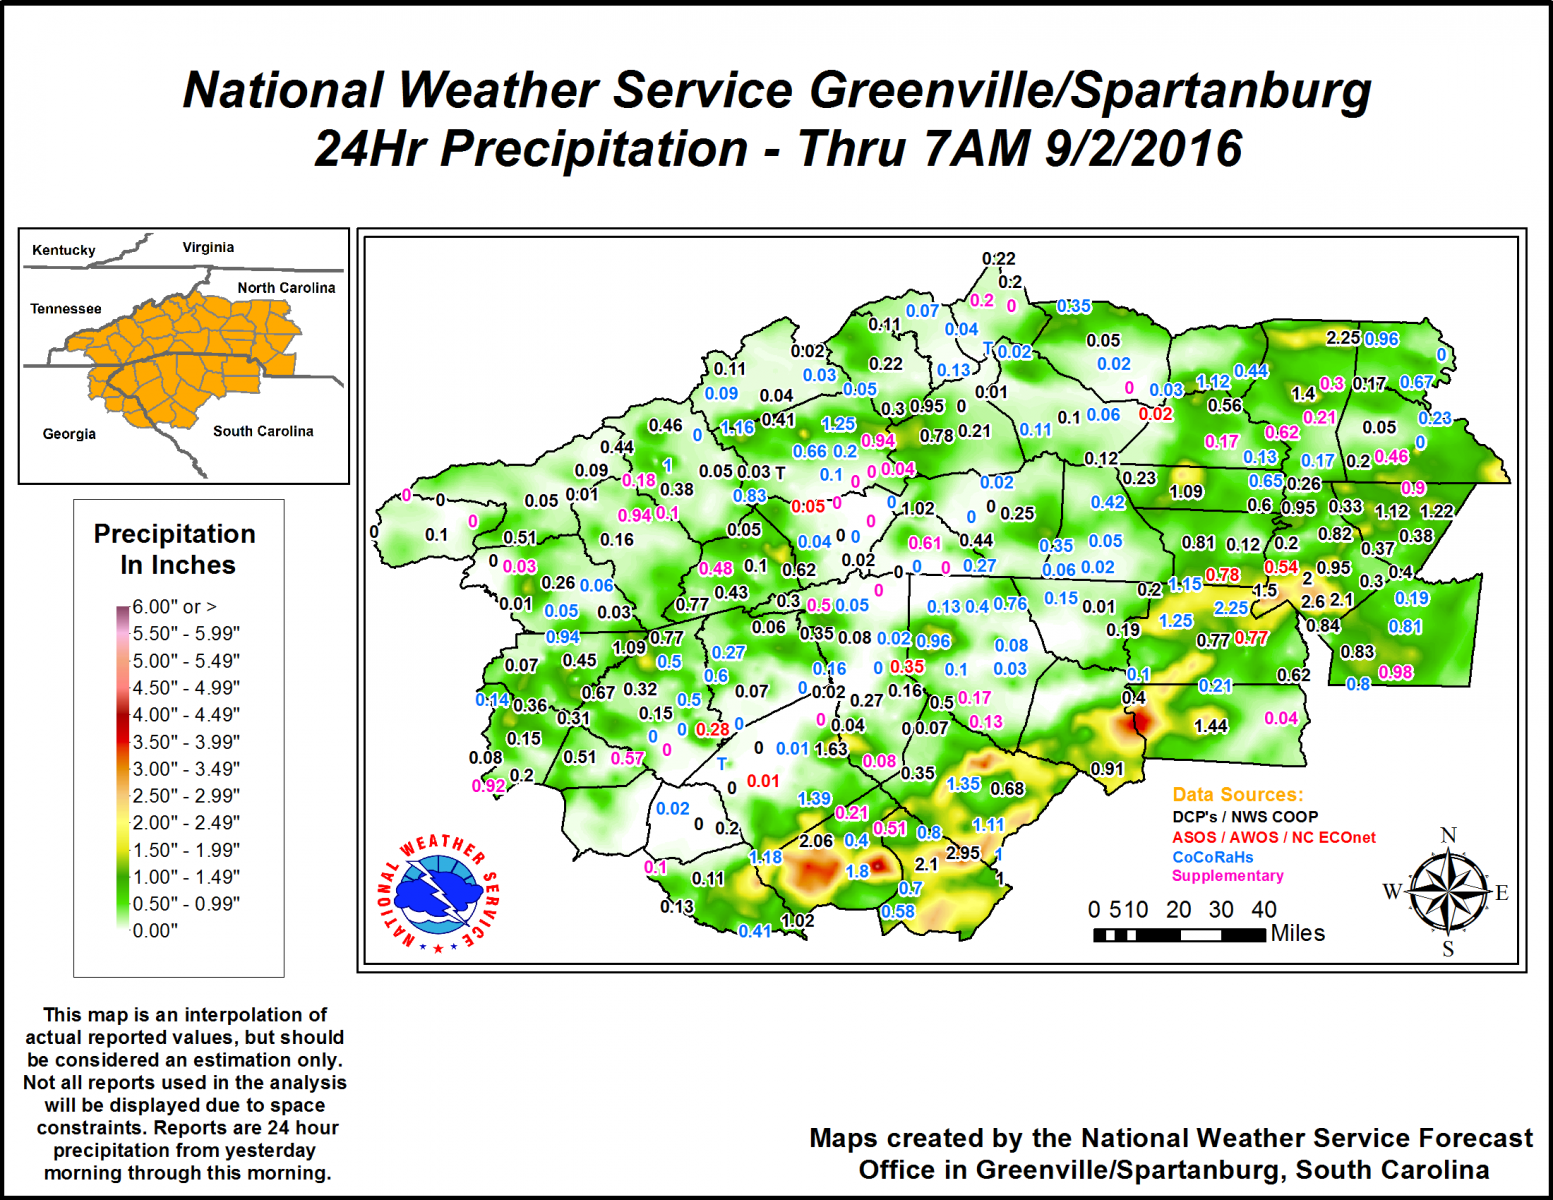
Fig. 11. Rainfall totals across the GSP CWA from 1200 UTC 1 September 2016 to 1200 UTC 2 September 2016. Click on image to enlarge. 4. Conclusions Based on the assessment of several factors, the rainfall in the GSP CWA that preceded the arrival of then-Tropical Storm Hermine cannot be objectively classified as a PRE. Though several synoptic and mesoscale features were favorable, the area of rainfall that occurred in the day preceding the landfall of Hurricane Hermine was not heavy enough in the GSP CWA to constitute a PRE. The separation of the rainfall from the outer circulation of Hermine (defined in this case by Hermine’s outer rainbands, which can be seen in water vapor imagery in Fig. 10), another PRE requirement, was also somewhat doubtful based on cyclonic low-level flow during the rainfall event and satellite imagery showing a possible connection of the rainfall to Hermine’s CDO. Antecedent drought/abnormally dry conditions were present across the majority of the GSP CWA prior to the onset of rain related to Hermine. The resulting low river, creek, and lake levels likely contributed to a lack of flooding impacts, particularly over the lower Piedmont region of South Carolina. The dry antecedent conditions might have also prevented more widespread wind damage across the lower Piedmont and the Charlotte metropolitan area. The relatively minor impacts from the passage of Hermine were not unexpected from a climatological perspective, given the landfall of the storm east of Apalachicola, Florida, and the eventual track over coastal regions of South Carolina. Acknowledgements Rainfall graphics were prepared with ArcMap software. The composite chart of previous tropical cyclone tracks was obtained from the NOAA Coastal Services Center. Upper air analyses were obtained from the Storm Prediction Center. The surface analysis was obtained from the Hydrometeorological Prediction Center. Satellite and radar mosaic imagery was obtained from the University Corporation for Atmospheric Research. References Bosart, L. F., and F. H. Carr, 1978: A case study of excessive rainfall centered around Wellsville, New York, 20–21 June 1972. Mon. Wea. Rev., 106, 348–362. Cote, M. R., 2007: Predecessor rain events in advance of tropical cyclones. M.S. thesis, Department of Atmospheric and Environmental Sciences, University at Albany, State University of New York, 200 pp. [Available online at http://cstar.cestm. albany.edu/CAP_Projects/Project10/index.htm.] Galarneau, T. J., Jr., L. F. Bosart, and R. S. Schumacher, 2010: Predecessor rain events ahead of tropical cyclones. Mon. Wea. Rev., 138, 3272–3297. |


 Hourly Weather