Temperature and precipitation outlooks for the 6-10 day and 8-14 day periods. Issued daily by the NOAA/NWS Climate Prediction Center. The outlooks express forecast probability that temperatures or total precipitation in the 6-10 or 8-14 day period will tend to be similar to the 10-highest ("above-normal"), middle-10 ("near-normal"), or 10-lowest ("below-normal") observed in the 1981-2010 normals period. Color shading on the outlook maps follows standard convention for warmer/colder or wetter/drier, with near-normal in white. Darker shades of red or blue (or green and brown) indicate a higher forecast probability.
6-10 Day Outlook
8-14 Day Outlook
Temperature
Precipitation
Temperature
Precipitation
One Month and Three-Month temperature and precipitation outlooks. The outlooks are issued by the Climate Prediction Center on the last day of each month (valid for the following month), with an update to the outlook on the third Thursday of the following month. The monthly and seasonal outlooks are similar to the 6-10 and 8-14 day outlooks. However, in areas where "Equal Chances" (EC) is shown, it means that climate signals do not favor either above- or below-normal, and above-, near-, or below-normal forecast categories are equally likely to occur. A forecast of Equal Chances does NOT necessarily mean forecast conditions are expected to be near-normal.
One Month Outlook
Three Month Outlook
Temperature
Precipitation
Temperature
Precipitation
Daily Records and Normals
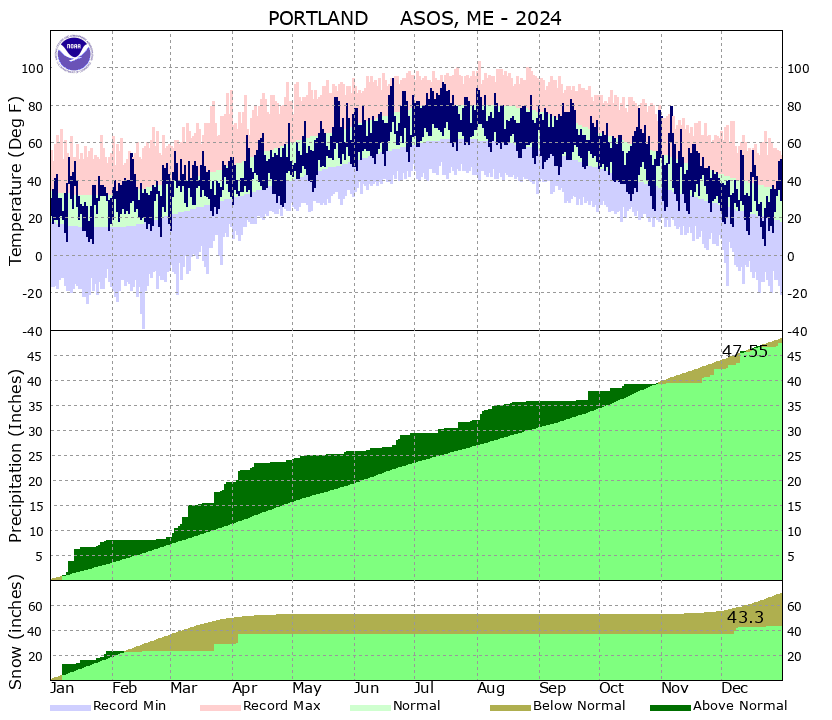
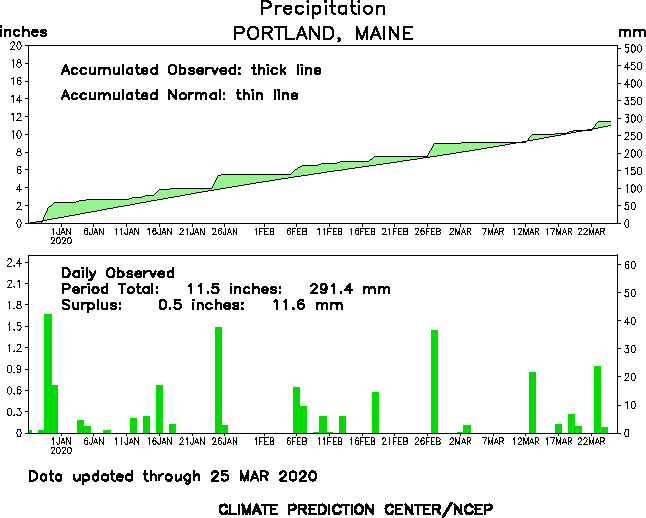
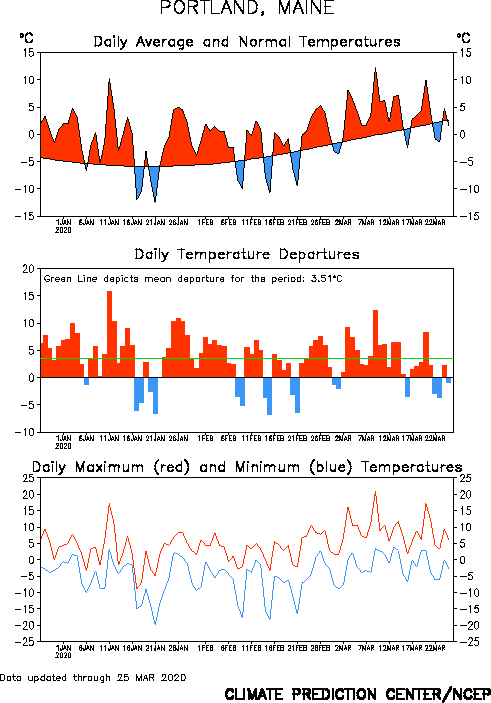
PORTLAND, ME Climate Data...
Temperature records began: November 1, 1940
Precipitation records began: January 1, 1871
Snowfall records began: January 1, 1882
Daily Data by Month:
Records updated shortly after the start of each month.
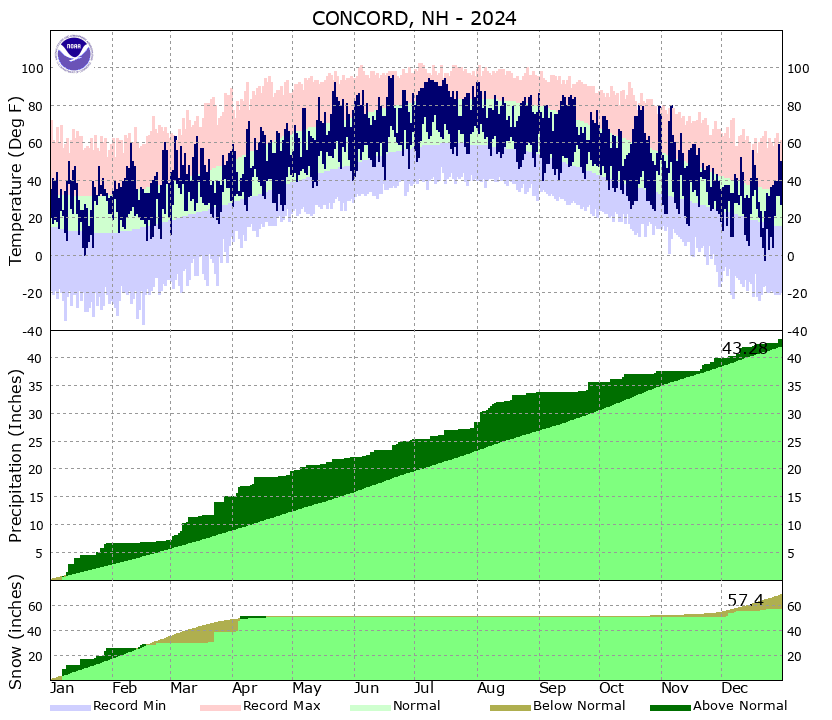
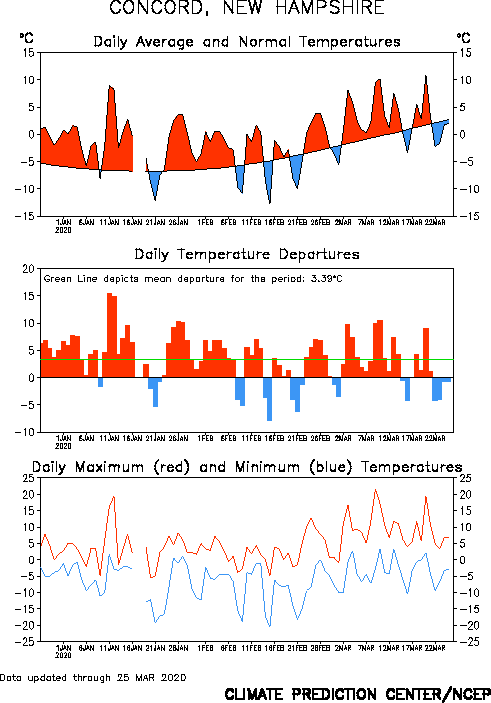
CONCORD, NH Climate Data...
Temperature records began: September 1, 1868
Precipitation records began: January 1, 1868
Snowfall records began: January 1, 1868
Daily Data by Month:
Temperature records began: November 1, 1940
Precipitation records began: January 1, 1871
Snowfall records began: January 1, 1882
Monthly Records (updated monthly):
CONCORD, NH Climate Data...
Temperature records began: September 1, 1868
Precipitation records began: January 1, 1868
Snowfall records began: January 1, 1868
Monthly Records (updated monthly):


