Synoptic Analysis
On Friday morning, a coastal low just offshore of the Georgia-South Carolina coast started moving ENE up the coast, the northern extent reaching the southern coastal zones of the local forecast area by 8-10 AM EDT (Fig. 1).
Figure 1. A 3-hourly loop of the surface maps valid from 5 AM - 2 PM EDT on 19 May 2023 (SPC Mesoscale Analysis Archive).
Aloft, a trough at 300mb lingered just to the west, the axis of which was located just south of Savannah at 5 AM EDT that morning. Throughout the morning, the trough did not move downstream, but instead lifted northward up the Savannah River, through the South Carolina Midlands, and into South Carolina Upstate by 11 AM EDT. A similar pattern is seen in the 500mb analysis, though the trough is a bit wider at this level, encompassing most of South Carolina and even parts of southeast North Carolina. This kept the Cape Fear region in a consistent area of positive vorticity advection (PVA) and upper air differential divergence (Figs. 2-5).
Figure 2. A 3-hourly loop of the 300mb maps valid from 5 AM - 2 PM EDT on 19 May 2023 (SPC Mesoscale Analysis Archive).
Figure 3. A 3-hourly loop of the 500mb maps valid from 5 AM - 2 PM EDT on 19 May 2023 (SPC Mesoscale Analysis Archive).
Figure 4. A 3-hourly loop of the positive vorticity advection (PVA) occurring at 500mb valid from 5 AM - 2 PM EDT on 19 May 2023 (SPC Mesoscale Analysis Archive).
Figure 5. A 3-hourly loop of the differential divergence occurring in the 250-850mb layer valid from 5 AM - 2 PM EDT on 19 May 2023 (SPC Mesoscale Analysis Archive).
Strong moisture advection starts to become apparent at the 700mb and 850mb analysis, with ESE flow funneling in ample Atlantic air (Figs 6-7).
Figure 6. A 3-hourly loop of the 700mb maps valid from 5 AM - 2 PM EDT on 19 May 2023 (SPC Mesoscale Analysis Archive).
Figure 7. A 3-hourly loop of the 850mb maps valid from 5 AM - 2 PM EDT on 19 May 2023 (SPC Mesoscale Analysis Archive).
Mesoanalysis
An analysis of the 12Z MHX sounding shows an atmospheric primed for possible flash flooding. The SBCAPE profile was long and skinny in nature, measuring a weak 31 J/kg, and only went up to about 500mb. The low- and mid-levels were nearly saturated, with relative humidity values measuring at 96% in both layers. The precipitable water (PWAT) clocked in at 1.72 inches, which was over the 90th percentile of values measured at 12Z on 19 May, per SPC Sounding Climatology. As even more moisture advected into the local atmosphere throughout the event, the PWAT climbed up to over 1.80 inches (Figs. 8-9).
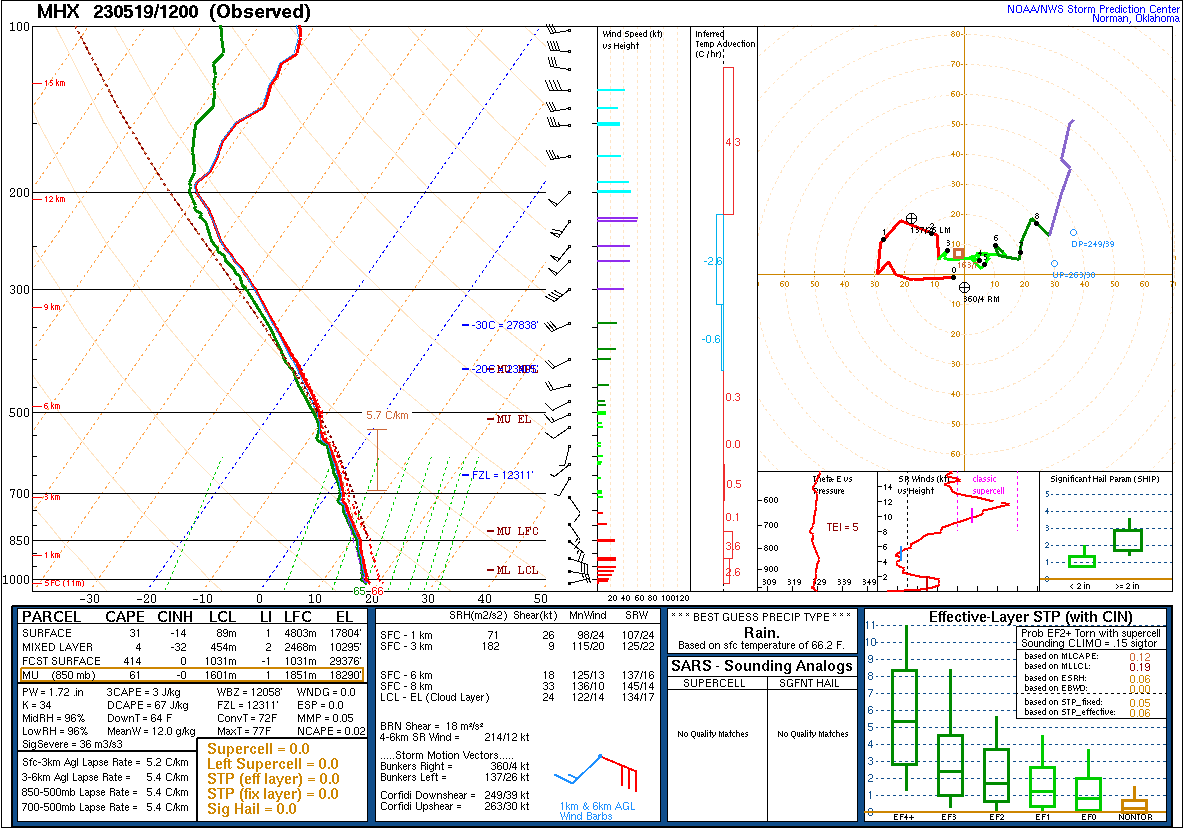
Figure 8. 12Z Sounding at MHX (Morehead City, NC), which is the closest upper air site to this flash flooding event. It can be assumed that the local atmosphere was very similar to the one observed here (SPC Sounding Analysis Page).
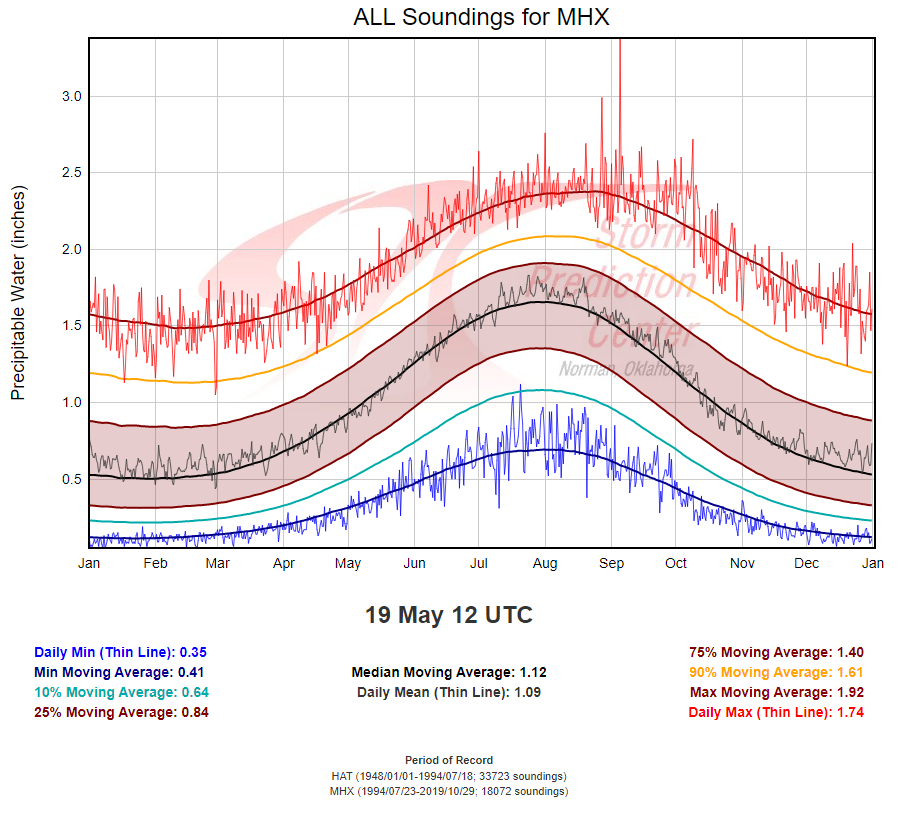
Figure 9. A sounding climatology of the PWAT values (in inches) recorded across the MHX and HAT upper air sites dating back to 1948 (SPC Sounding Climatology Page).
The freezing level might just be the most impressive piece of this entire setup, measuring at 12,311 ft on the 12Z MHX sounding. This shatters the daily max record of 11,974.21 ft found in the MHX sounding climatology (Fig. 10).
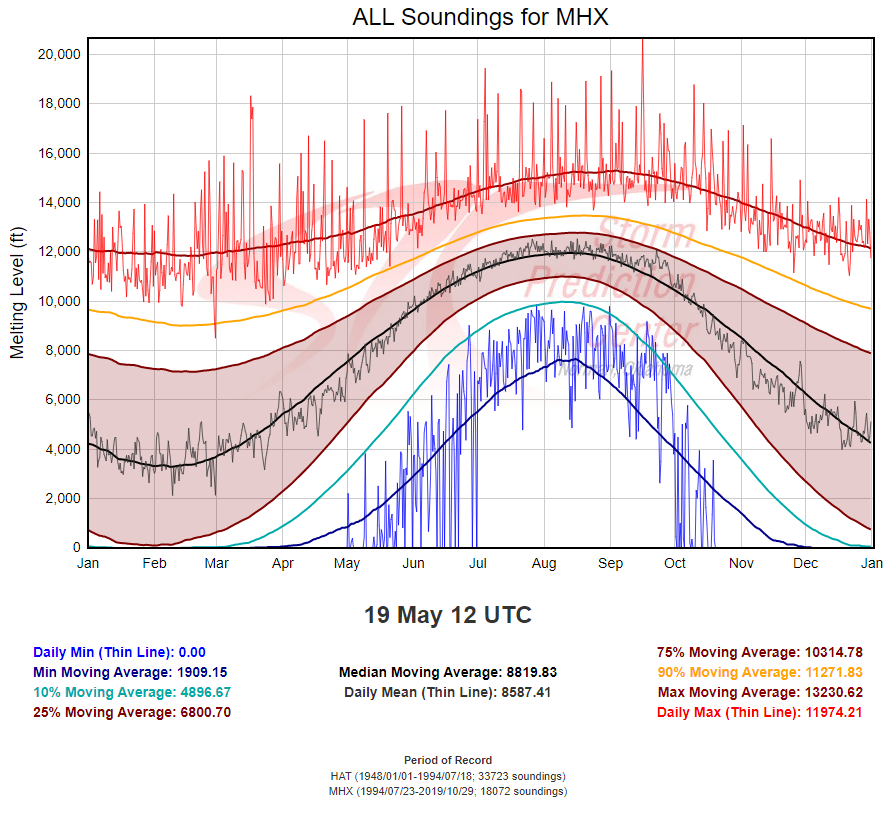
Figure 10. A sounding climatology of the freezing/melting levels (in feet) recorded across the MHX and HAT upper air sites dating back to 1948 (SPC Sounding Climatology Page).
Combining that freezing level with the low Lifted Condensation Levels (LCLs), this created a warm cloud layer depth of approximately 12,019 feet, meaning warm cloud processes dominated throughout this event. Only factors that went against the idea of flash flooding were the wind speeds. The LCL-EL wind was 14 kts, which is a tad too fast (typically, less than 10 kts brings more efficient flash flooding events). Meanwhile, the Corfidi downshear and upshear vectors were measured at 39 kts and 30 kts, respectively (Fig. 8). These shear vectors are noticeably high, with less than 15 kts being the most ideal for flash flooding, per the Flash Flood Warning Operations Methodology adapted from the NWS Warning Decision Training Division. This reinforced the idea that training storms were necessary in order for significant flash flooding to occur.
While the coastal low itself seemed to track a little more to the NE than expected, a quasi-vertically stacked low developed just south and east of Cape Fear, ranging from 1000-700mb. While rainfall had been ongoing in the Cape Fear region since about 4-5 AM EDT that morning, the more significant amounts did not start falling until 7-8 AM EDT. SPC mesoanalysis showed significant moisture convergence/transport and frontogenesis along the 925mb, 850mb, and 700mb layers, along with all the thicknesses therein (Figs. 11-15).
Figure 11. A 3-hourly loop of 700mb frontogenesis valid from 5 AM - 2 PM EDT 19 May 2023 (SPC Mesoscale Analysis Archive).
Figure 12. A 3-hourly loop of 850mb frontogenesis valid from 5 AM - 2 PM EDT 19 May 2023 (SPC Mesoscale Analysis Archive).
Figure 13. A 3-hourly loop of 925mb frontogenesis valid from 5 AM - 2 PM EDT 19 May 2023 (SPC Mesoscale Analysis Archive).
Figure 14. A 3-hourly loop of 925-850mb frontogenesis valid from 5 AM - 2 PM EDT 19 May 2023 (SPC Mesoscale Analysis Archive).
Figure 15. A 3-hourly loop of 1000-925mb frontogenesis valid from 5 AM - 2 PM EDT 19 May 2023 (SPC Mesoscale Analysis Archive).
The heaviest of the rain started not long before sunrise. By 7:00-7:30 AM EDT, Multi-Radar Multi-Sensor (MRMS) data estimated that between 2-3 inches had fallen in the previous three hours across parts of New Hanover and Brunswick Counties. This prompted forecasters at NWS Wilmington, NC to issue the first flood-related product of the day at 7:27 AM EDT, a Flood Advisory. This was done to outline the probable localized flooding occurring near small streams, creeks, and especially low-lying areas. In the Leland, NC area, the first weather-related 911 call occurred at 7:41 AM EDT that morning, where hydroplaning was reported. By 9 AM EDT, the MRMS estimated totals grew to near 4-6 inches of total rainfall, with a bullseye over parts of Wilmington and Leland (Figs. 16-18).
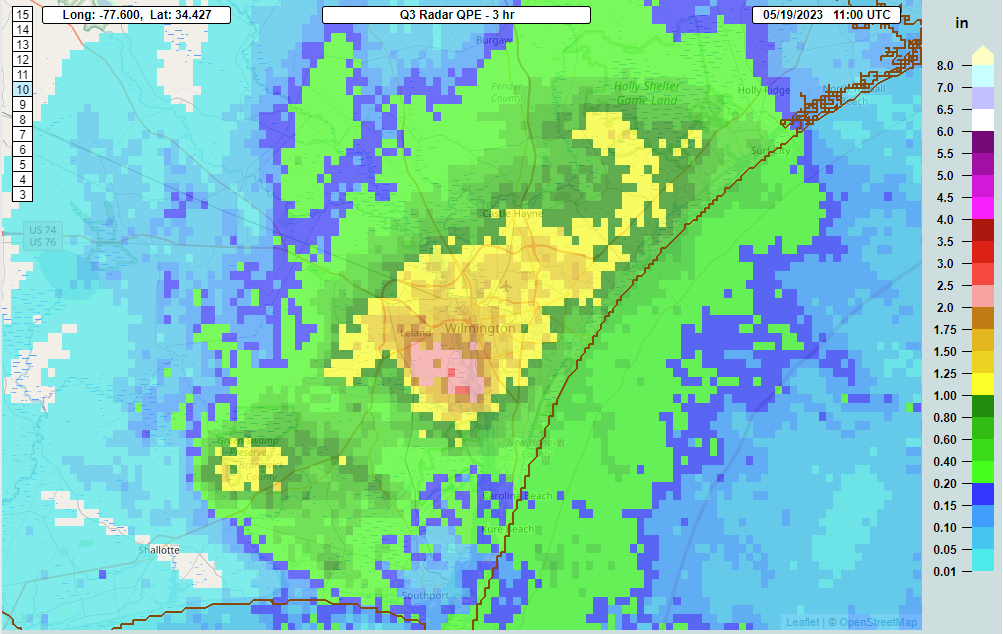
Figure 16. MRMS data showing the quantitative precipitation estimate (QPE) of the previous 3 hours, valid at 7 AM EDT 19 May 2023 (NSSL MRMS Operational Product Viewer).
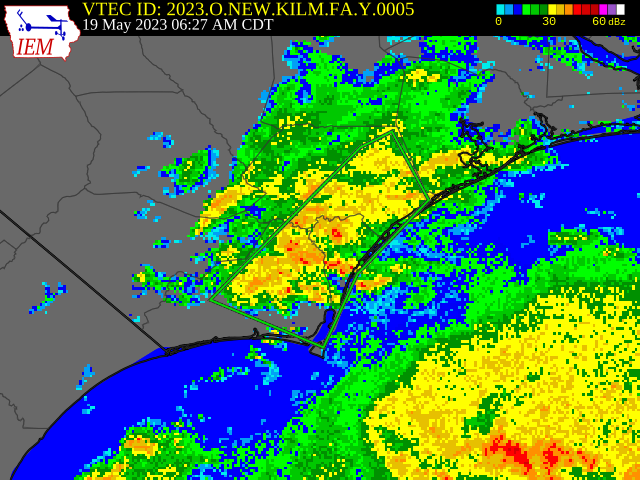
Figure 17. Polygon of the first Flood Advisory issued by NWS Wilmington, NC at 7:27 AM EDT 19 May 2023 (IEM VTEC Browser).

Figure 18. MRMS data showing the quantitative precipitation estimate (QPE) of the previous 3 hours, valid 10 AM EDT 19 May 2023 (NSSL MRMS Operational Product Viewer).
The Leland Emergency Manager reported that flooding started around 8:00-8:15 AM EDT that morning, with NWS Wilmington, NC issuing the first Flash Flood Warning of the day at 8:50 AM EDT (IEM Cow verification data here). At 9:26 AM EDT, the Weather Prediction Center (WPC) issued a Mesoscale Precipitation Discussion (MPD) to outline some "significant flash flooding unfolding" along Wilmington and surrounding areas. Latent heat release assisted in the western expansion of the mesoscale convective vortex (MCV), and rainfall amounts climbed up to several inches (Fig. 19).
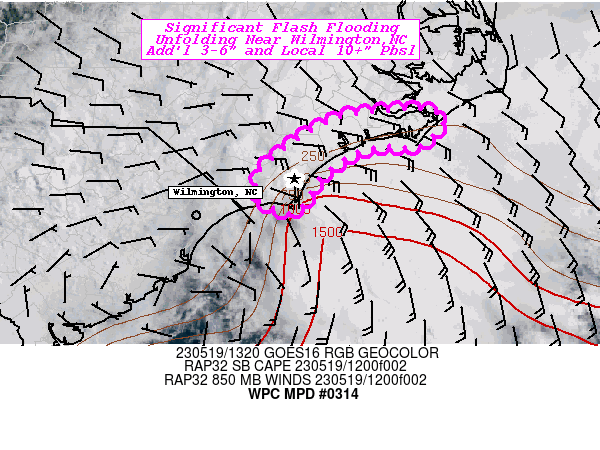
Figure 19. The area highlighted by WPC in their MPD, issued at 9:26 AM EDT 19 May 2023 (Weather Prediction Center Met Watch).
Leland and surrounding areas received the most, generally hitting 6-9 inches of rain, with a few localized amounts up to 10-13 inches (Figs. 20-21). By 9 AM EDT, the first water rescues started to occur, and a total of nine flood-related 911 calls occurred between 9-11 AM EDT. By 11:30 AM EDT, the calls finally started to decrease. Across Leland, over 20 roads were closed, 4 homes and 3 businesses recorded water intrusion (including a bank), and North Brunswick High School recorded three inches of water in their cafeteria, which prompted all of Brunswick County Schools to shelter in place. Multiple rescues out of flooded/submerged vehicles were recorded. The event was so significant that Leland Emergency Management had to set up an Incident Command Post (ICP) to coordinate response actions during the incident.
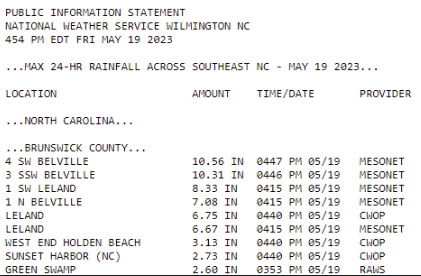
Figure 20. Public Information Statement outlining the higher rainfall totals measured from the 19 May 2023 flash flooding event (NWS Wilmington, NC).
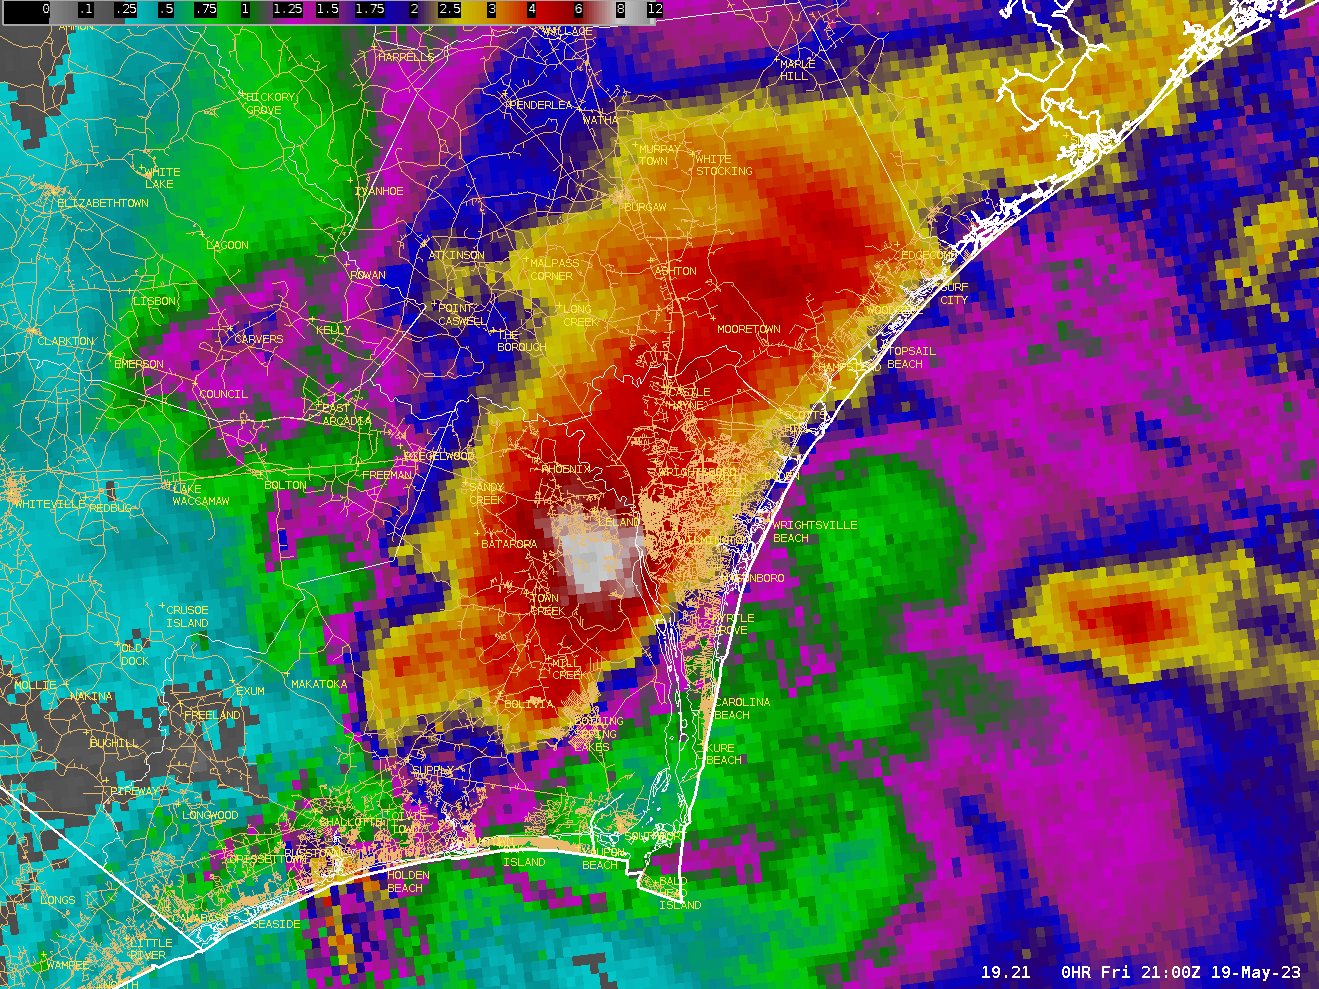
Figure 21. MRMS data showing estimated rainfall totals throughout the event's duration (NWS Wilmington, NC).
Rain started to subside by the afternoon, and flooding slowly receded. The lone Flash Flood Warning issued by NWS Wilmington, NC expired at 3 PM EDT. MRMS data suggested that the average recurrence interval (ARI) for this event was 45 years. This means we expect an average of 45 years in which this particular precipitation magnitude is exceeded at least once (Fig. 22).
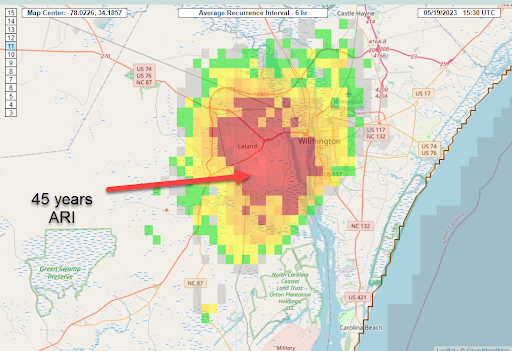
Figure 22. Average Recurrence Interval (ARI) from MRMS data show that this was a 1-in-45-year event (NSSL MRMS Operational Product Viewer).
Page Author: Meteorologist Ian Boatman
Last Updated: August 3, 2023


 Coastal Flood