Severe Weather Climatology for NWS Wilmington, NC
Between 1991 and 2021 there were 5,265 reports of severe weather across the area covered by the National Weather Service forecast office in Wilmington, NC. Reports of tornadoes, large hail, damaging thunderstorm winds, and freshwater flooding were evaluated for this study across the following counties:
North Carolina: Bladen, Brunswick, Columbus, New Hanover, Pender, Robeson
South Carolina: Darlington, Dillon, Florence, Georgetown, Horry, Marion, Marlboro, Williamsburg
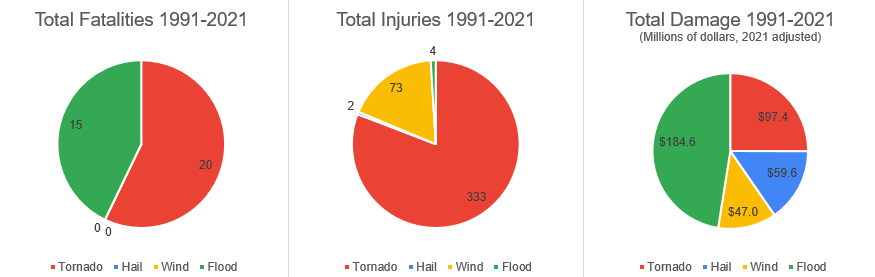
Over this time period severe weather was directly responsible for 412 injuries, 35 fatalities, and property damage (inflation-adjusted to 2021 dollars) totaling over $388 million.
| Hazard | Injuries | Fatalities | Total Damage (2021 Dollars) |
| Tornado | 333 | 20 | $97.4 million |
| Hail | 2 | 0 | $59.6 million |
| Wind | 73 | 0 | $47.0 million |
| Flood | 4 | 15 | $184.6 million |
| Totals | 412 | 35 | $388.6 million |
Although records of severe weather extend back to 1950, a more recent period was selected for this study given limited records for non-fatal severe weather events prior to the 1990s. This study did not evaluate damage from saltwater flooding or from winds caused by tropical storms and hurricanes.
Browse through the tabs above for specific details.
Data Sources:
National Centers for Environmental Information (NCEI) Storm Data: https://www.ncdc.noaa.gov/stormevents
Storm Prediction Center, U.S. Tornadoes: https://www.spc.noaa.gov/wcm
Data Analysis: Tim Armstrong
TORNADOES 1991-2021
Number of reported tornadoes: 267 (5% of all severe weather reports)
Total damage in inflation-adjusted 2021 dollars: $97,382,655 (25% of all severe weather damage)
Injuries: 333 (81% of all severe weather injuries)
Fatalities: 20 (57% of all severe weather fatalities)
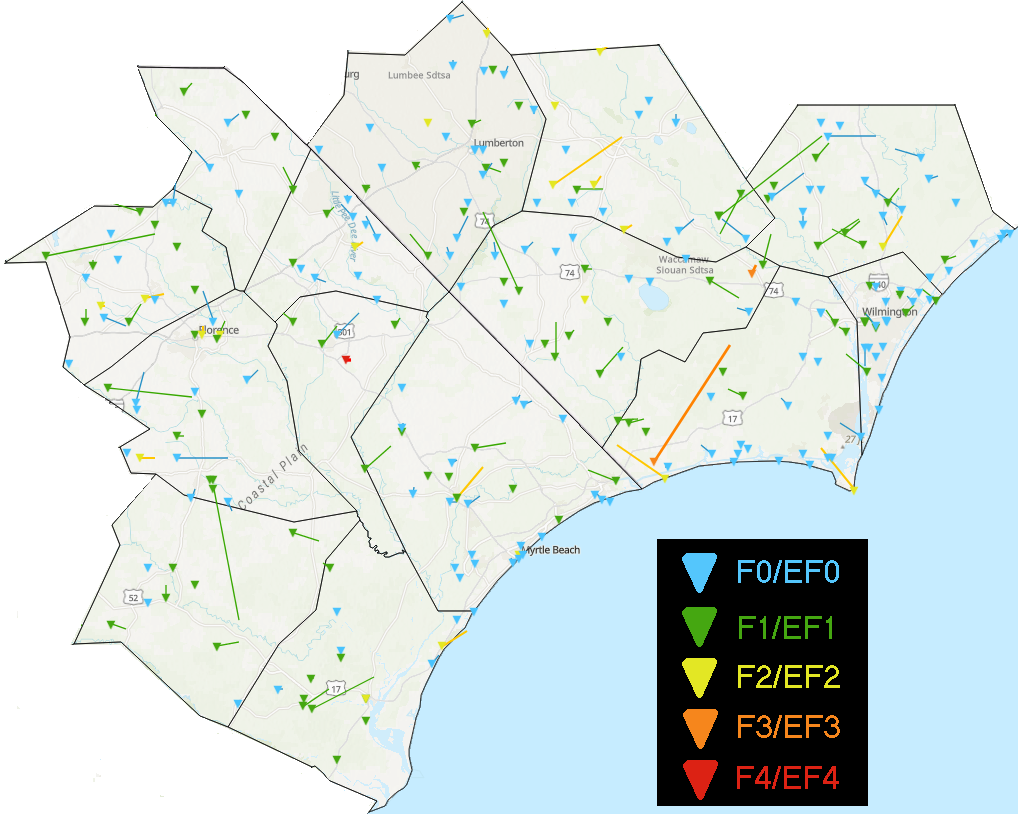
|
Map of surveyed tornado touchdown points and paths across the NWS Wilmington, NC forecast area, 1991-2021 |
TOTAL NUMBER OF TORNADOES BY COUNTY, 1991-2021
| Month | Non-tropical Tornadoes | Tropical Tornadoes | Fair Weather Waterspouts |
| Bladen County, NC | 17 | 3 | 0 |
| Brunswick County, NC | 16 | 11 | 2 |
| Columbus County, NC | 17 | 5 | 0 |
| New Hanover County, NC | 9 | 15 | 1 |
| Pender County, NC | 21 | 10 | 2 |
| Robeson County, NC | 18 | 8 | 0 |
| Darlington County, SC | 13 | 4 | 0 |
| Dillon County, SC | 5 | 6 | 0 |
| Florence County, SC | 13 | 6 | 0 |
| Georgetown County, SC | 14 | 4 | 0 |
| Horry County, SC | 15 | 13 | 1 |
| Marion County, SC | 3 | 2 | 0 |
| Marlboro County, SC | 1 | 6 | 0 |
| Williamsburg County, SC | 8 | 1 | 0 |
Tornadoes that have affected southeastern North Carolina and northeastern South Carolina can be sorted into three broad categories.
TOTAL NUMBER OF TORNADOES BY MONTH, 1991-2021
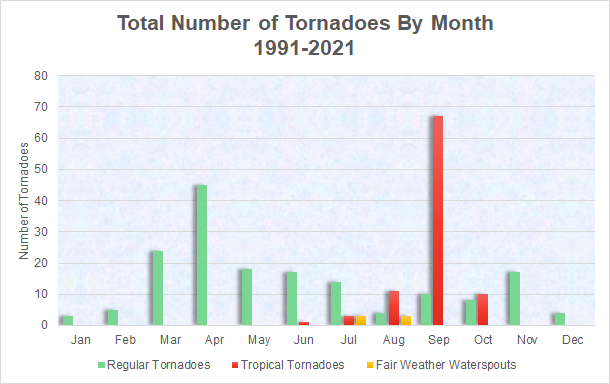
| Month | Non-tropical Tornadoes | Tropical Tornadoes | Fair Weather Waterspouts |
| January | 3 | 0 | 0 |
| February | 5 | 0 | 0 |
| March | 24 | 0 | 0 |
| April | 45 | 0 | 0 |
| May | 18 | 0 | 0 |
| June | 17 | 1 | 0 |
| July | 14 | 3 | 3 |
| August | 4 | 11 | 3 |
| September | 10 | 67 | 0 |
| October | 8 | 10 | 0 |
| November | 17 | 0 | 0 |
| December | 4 | 0 | 0 |
| Totals | 169 | 92 | 6 |
Some significant tornado outbreaks on record for southeastern North Carolina and northeastern South Carolina include:
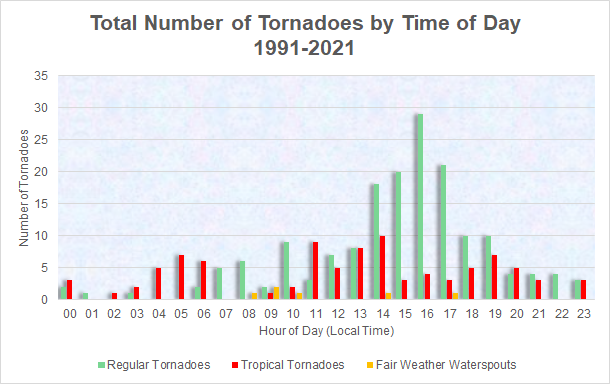
TOTAL NUMBER OF TORNADOES BY TIME OF DAY, 1991-2021
Tornadoes not associated with tropical cyclones showed a strong association with afternoon and evening occurrence, mainly between 2 p.m. and 7 p.m. local standard time. Tornadoes associated with tropical cyclones showed little diurnal preference and were actually the most numerous tornado variety during the pre-dawn morning hours. Landfalling fair weather waterspouts most often occurred during late mornings between 8 a.m. and 11 a.m. local time.
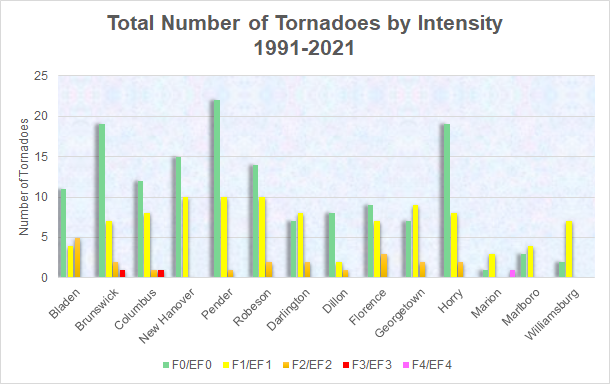
TORNADO INTENSITY, 1991-2021
Since few weather stations are designed to survive the powerful winds of a tornado, tornado intensity is estimated based on the degree of damage left behind. The Enhanced Fujita Scale, an improvement on the original Fujita Scale from 1971, uses 28 damage indicators to estimate a tornado's wind speeds.
Over half (55 percent) of all recorded tornadoes across southeastern North Carolina and northeastern South Carolina were weak, F0/EF0, with wind speeds of 85 mph or less. Tornadoes of F1/EF1 intensity made up an additional 36 percent of events. Only 9 percent for tornadoes were strong: F2/EF2 intensity or stronger.
A very small number, around one percent, of local tornadoes were F3/EF3 or stronger with wind speeds in excess of 136 mph.
There was no significant difference in intensity noted between the average tropical cyclone tornado versus non-tropical tornado. Observed landfalling fair weather waterspouts were all weak with wind speeds less than 85 mph.
Only one tornado during this study period was rated F4. It occurred in Marion County, SC on November 5, 1995. Prior to 1991, a significant tornado outbreak on March 28, 1984 produced multiple F3 and F4 tornadoes across the Carolinas and is the largest and most destructive severe weather outbreak in local history.
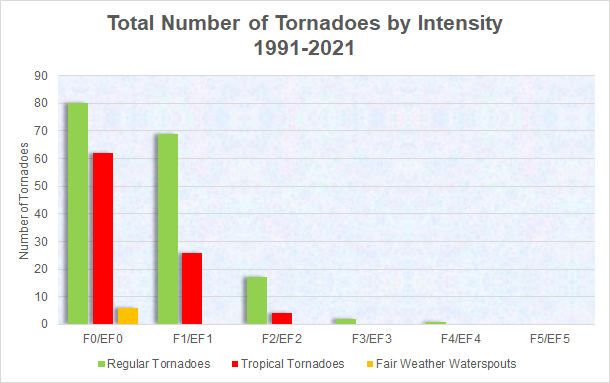
| EF Scale | Non-Tropical Tornadoes | Tropical Tornadoes | Fair Weather Waterspouts |
| F0/EF0 | 80 | 62 | 6 |
| F1/EF1 | 69 | 26 | 0 |
| F2/EF2 | 17 | 4 | 0 |
| F3/EF3 | 2 | 0 | 0 |
| F4/EF4 | 1 | 0 | 0 |
TORNADO INTENSITY BY COUNTY, 1991-2021
Tornadoes have occurred in every county covered by NWS Wilmington, NC. Even prior to 1991, there has never been an F5/EF5 tornado confirmed in either North or South Carolina.
Strong tornadoes (F3/EF3 or stronger) have been recorded near the coast (Brunswick County in 2021) as well as inland (Marion County in November 1995, and Columbus County in November 2006.)
| North Carolina | F0/EF0 | F1/EF1 | F2/EF2 | F3/EF3 | F4/EF4 |
| Bladen | 11 | 4 | 5 | 0 | 0 |
| Brunswick | 19 | 7 | 2 | 1 | 0 |
| Columbus | 12 | 8 | 1 | 1 | 0 |
| New Hanover | 15 | 10 | 0 | 0 | 0 |
| Pender | 22 | 10 | 1 | 0 | 0 |
| Robeson | 14 | 10 | 2 | 0 | 0 |
| South Carolina | F0/EF0 | F1/EF1 | F2/EF2 | F3/EF3 | F4/EF4 |
| Darlington | 7 | 8 | 2 | 0 | 0 |
| Dillon | 8 | 2 | 1 | 0 | 0 |
| Florence | 9 | 7 | 3 | 0 | 0 |
| Georgetown | 7 | 9 | 2 | 0 | 0 |
| Horry | 19 | 8 | 2 | 0 | 0 |
| Marion | 1 | 3 | 0 | 0 | 1 |
| Marlboro | 3 | 5 | 0 | 0 | 0 |
| Williamsburg | 2 | 7 | 0 | 0 | 0 |
TORNADO TYPE BY COUNTY, 1991-2021
Tornadoes from both tropical and non-tropical weather systems have occurred in every county across the NWS Wilmington, NC forecast area, however fair weather waterspouts were limited to coastal counties only.
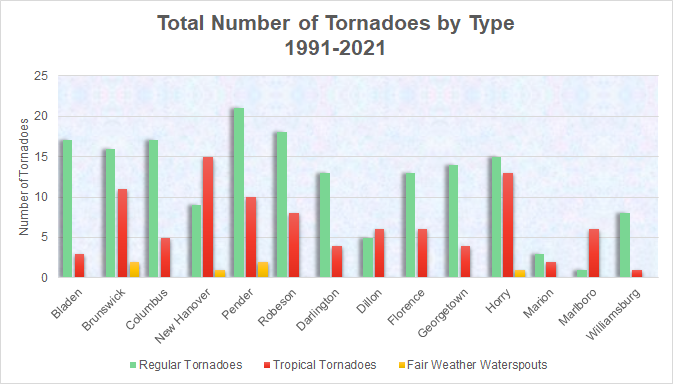
| North Carolina | Regular Tornadoes | Tropical Tornadoes | Fair Weather Waterspouts |
| Bladen | 17 | 3 | 0 |
| Brunswick | 16 | 11 | 2 |
| Columbus | 17 | 5 | 0 |
| New Hanover | 9 | 15 | 1 |
| Pender | 21 | 10 | 2 |
| Robeson | 18 | 8 | 0 |
| South Carolina | Regular Tornadoes | Tropical Tornadoes | Fair Weather Waterspouts |
| Darlington | 13 | 4 | 0 |
| Dillon | 5 | 6 | 0 |
| Florence | 13 | 6 | 0 |
| Georgetown | 14 | 4 | 0 |
| Horry | 15 | 13 | 1 |
| Marion | 3 | 2 | 0 |
| Marlboro | 1 | 6 | 0 |
| Williamsburg | 8 | 1 | 0 |
TORNADO TYPE BY COUNTY, NORMALIZED BY AREA
Since counties vary greatly in size, a better metric to gauge tornado frequency may be the number of tornadoes per unit area. The table and chart below show county tornado totals normalized to the number of events reported per 100 square miles over the period 1991 to 2021.
The relatively large normalized frequency of tornadoes observed in New Hanover County, NC could reflect the high population density of the county and an assumed high reporting efficiency even for weak tornadoes. The relatively low tornado frequency calculated for some inland counties like Marlboro and Marion, SC, may reflect low population density and an assumed low reporting efficiency for tornadoes there.
Reporting efficiency is a hypothetical ratio of reported tornadoes to the number of tornadoes that actually occurred -- a value that realistically cannot be known. A short-track, weak tornado occurring in a rural area has a relatively low chance to be observed and reported; however, a similar event occurring within a densely populated area has a considerably higher chance of being reported.
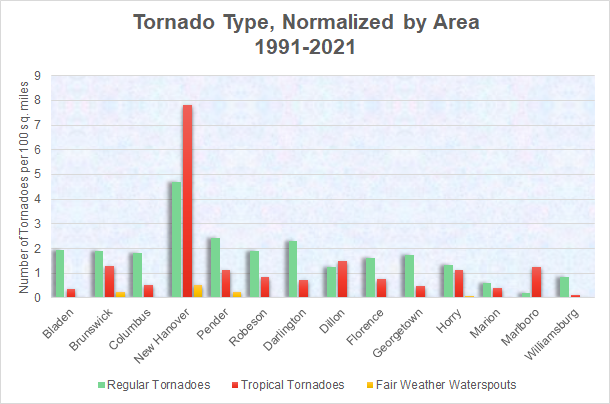
| North Carolina | Regular Tornadoes/100 mi² | Tropical Tornadoes/100 mi² | Fair Weather Waterspouts/100 mi² |
| Bladen | 1.9 | 0.3 | 0.0 |
| Brunswick | 1.9 | 1.3 | 0.2 |
| Columbus | 1.8 | 0.5 | 0.0 |
| New Hanover | 4.7 | 7.8 | 0.5 |
| Pender | 2.4 | 1.1 | 0.2 |
| Robeson | 1.9 | 0.8 | 0.0 |
| South Carolina | Regular Tornadoes/100 mi² | Tropical Tornadoes/100 mi² | Fair Weather Waterspouts/100 mi² |
| Darlington | 2.3 | 0.7 | 0.0 |
| Dillon | 1.2 | 1.5 | 0.0 |
| Florence | 1.6 | 0.7 | 0.0 |
| Georgetown | 1.7 | 0.5 | 0.0 |
| Horry | 1.3 | 1.1 | 0.1 |
| Marion | 0.6 | 0.4 | 0.0 |
| Marlboro | 0.2 | 1.3 | 0.0 |
| Williamsburg | 0.9 | 0.1 | 0.0 |
TOTAL TORNADO INJURIES AND FATALITIES, 1991-2021
Non-tropical tornadoes were responsible for over 87 percent of tornado-related injuries and fatalities across the NWS Wilmington, NC forecast area between 1991 and 2021. Tornadoes associated with tropical cyclones were responsible for the remainder of tornado-related injuries, all occurring during the peak of the Atlantic Hurricane Season from August through October. Within the time period covered by this study, fair weather waterspouts caused no injuries or fatalities.
There was a single, large severe weather outbreak on November 7, 1995 when a series of 12 tornadoes injured 140 people across northeastern South Carolina into Columbus County, NC. Even if we were to assume this one November event was an outlier, other tornado events during November also have led to numerous injuries and fatalities. Perhaps surprisingly, November is statistically the most dangerous month of the year for tornado-related injuries and fatalities across this portion of the Carolinas.
Monthly totals of injuries and fatalities due to tornadoes bear little relationship to raw tornado counts which show pronounced peaks in April (non-tropical tornadoes) and September (tropical tornadoes).
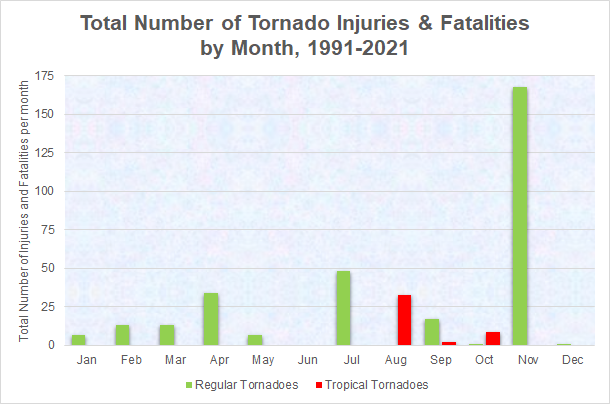
| Month | Non-tropical Tornado Injuries + Fatalities | Tropical Tornado Injuries + Fatalities |
| January | 7 | 0 |
| February | 13 | 0 |
| March | 13 | 0 |
| April | 34 | 0 |
| May | 7 | 0 |
| June | 0 | 0 |
| July | 48 | 0 |
| August | 0 | 33 |
| September | 17 | 2 |
| October | 1 | 9 |
| November | 168 | 0 |
| December | 1 | 0 |
| Totals | 309 | 44 |
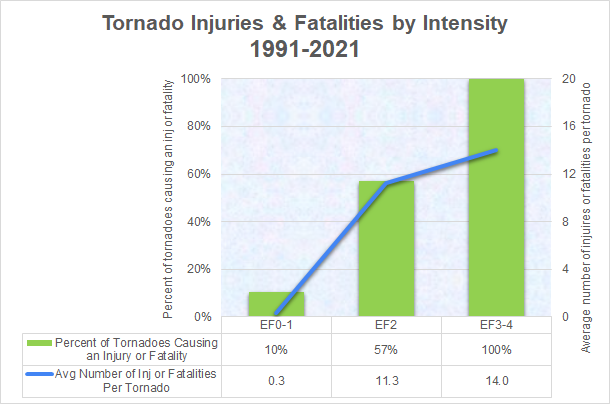
TORNADO INJURIES & FATALITIES BY INTENSITY
Weak tornadoes, rated F0/EF0 and F1/EF1, made up the majority of tornado events in the NWS Wilmington, NC forecast area. Statistically only 10 percent of these weak tornadoes have resulted in any injuries or fatalities.
Over half of F2/EF2 tornadoes have produced injuries or fatalities with an average of 11 injuries per tornado noted within the study period. For violent tornadoes, F3/EF3 and stronger, all recorded events within the study period produced at least one injury or fatality. Each F3/EF3 and stronger tornado injured or killed an average of 14 people.
TORNADO DAMAGE BY MONTH, 1991-2021
In contrast to injury and fatality statistics, damage amounts correlate fairly well with raw tornado counts per month across the area served by NWS Wilmington, NC. For tornadoes not associated with tropical cyclones, the largest damage amount and the largest number of recorded tornadoes have occurred in the month of April.
Tornadoes associated with tropical cyclones peak in occurrence and also in recorded damage during the month of September.
Landfalling fair weather waterspouts have caused only small amounts of property damage.
All monetary damage reports below are in inflation-adjusted 2021 dollars.
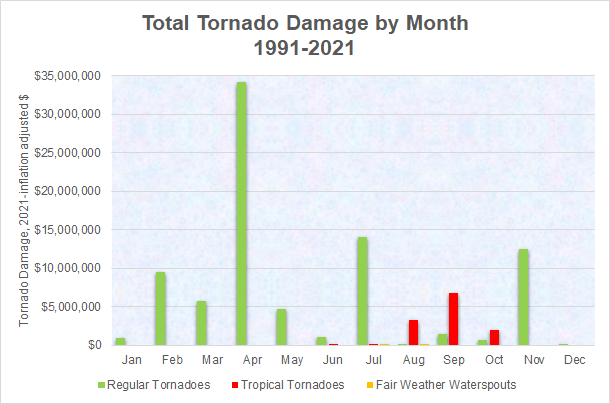
| Month | Non-tropical Tornadoes | Tropical Tornadoes | Fair Weather Waterspouts |
| January | $953,800 | $0 | $0 |
| February | $9,468,270 | $0 | $0 |
| March | $5,718,835 | $0 | $0 |
| April | $34,161,930 | $0 | $0 |
| May | $4,763,600 | $0 | $0 |
| June | $1,043,650 | $11,600 | $0 |
| July | $14,121,770 | $147,000 | $11,110 |
| August | $62,280 | $3,246,700 | $5,720 |
| September | $1,539,100 | $6,819,600 | $0 |
| October | $651,800 | $2,037,500 | $0 |
| November | $12,499,250 | $0 | $0 |
| December | $119,150 | $0 | $0 |
| Totals | $85,103,435 | $12,262,400 | $16,820 |
TORNADO DAMAGE BY F/EF SCALE CLASSIFICATION
As tornado intensity increases, the capacity for damage, injuries, and fatalities also increases. Weak tornadoes, F0/EF0 through F1/EF1 intensity, were responsible for slightly over $126,000 in monetary damage per event, on average. These weak events made up the majority of tornadoes within the NWS Wilmington forecast area.
The average F2/EF2 tornado caused over $2.5 million in property damage.
For F3/EF3 and stronger tornadoes, the average damage per event was nearly $4.5 million.
TORNADO PATH LENGTH, 1991-2021
Although a small number of tornadoes in the NWS Wilmington, NC forecast area have had observed path lengths in excess of 20 miles, the majority are on the ground for less than one mile. Path length statistics show a non-standard distribution with a notable difference between the mean and median path length. Among non-tropical tornadoes, the mean (50th percentile) path length is 0.5 miles while the average is nearly 2 miles.
For tornadoes associated with tropical cyclones, the mean path length (0.8 miles) is longer than for non-tropical tornadoes likely due to a faster translation speed of the tornado across the ground. However, there were no tropical tornadoes with path lengths in excess of 10 miles.
All observed fair weather waterspouts had short overland path lengths of one-third of a mile or less. These circulations quickly dissipate once they move across the rough ground surface.
In the box-and-whisker plot below, the mean path length is indicated by an "x" while the median path length is indicated by the horizontal line bisecting the colored rectangle. The rectangle encompasses the 25th through 75th percentile of path length observations for each tornado type, while the "whisker" extends another 1.5 times the interquartile length. Colored dots represent outlier observations near the limits of the observed data.
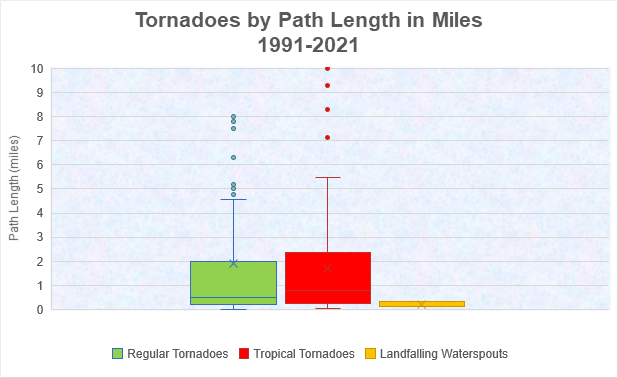
| Percentile | Non-tropical Tornadoes | Tropical Tornadoes | Fair Weather Waterspouts |
| maximum | 29.88 mi. | 10.00 mi. | 0.33 mi. |
| 99% | 20.66 mi. | 9.37 mi. | 0.33 mi. |
| 95% | 7.71 mi. | 5.45 mi. | 0.32 mi. |
| 90% | 4.18 mi. | 4.85 mi. | 0.32 mi. |
| 75% | 2.00 mi. | 2.27 mi. | 0.26 mi. |
| 50% | 0.50 mi. | 0.80 mi. | 0.13 mi. |
| 25% | 0.20 mi. | 0.23 mi. | 0.10 mi. |
| 10% | 0.10 mi. | 0.10 mi. | 0.10 mi. |
| 5% | 0.07 mi. | 0.09 mi. | 0.10 mi. |
| 1% | 0.02 mi. | 0.08 mi. | 0.10 mi. |
| minimum | 0.00 mi. | 0.02 mi. | 0.10 mi. |
HAIL (1991-2021)
Number of reported hail events: 1605 (30% of all severe weather reports)
Total damage in inflation-adjusted 2021 dollars: $59,642,164 (15% of all severe weather damage)
Injuries: 2 (<1% of all severe weather injuries)
Fatalities: 0 (0% of all severe weather fatalities)
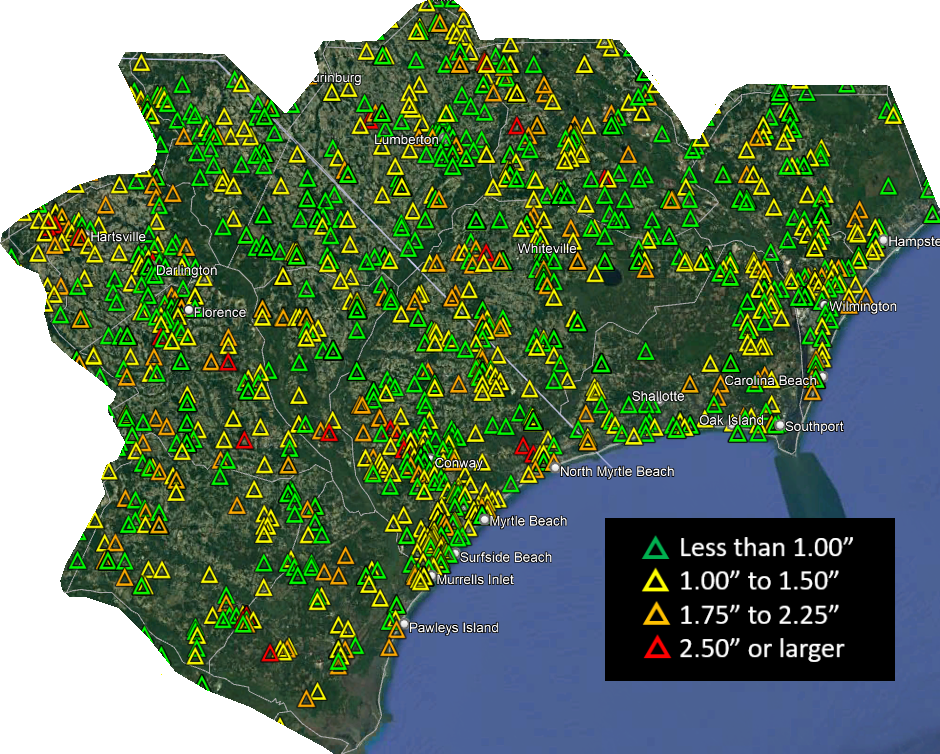
|
Map of all hail reports across the area served by NWS Wilmington from 1991 through 2021 |
TOTAL NUMBER OF HAIL REPORTS BY COUNTY, 1991-2021
| Hail all sizes | Hail ≥ 1.00" | Hail ≥ 1.75" | Hail ≥ 2.50" | |
| Bladen County, NC | 146 | 76 | 23 | 3 |
| Brunswick County, NC | 122 | 66 | 14 | 0 |
| Columbus County, NC | 143 | 76 | 29 | 2 |
| New Hanover County, NC | 93 | 50 | 12 | 0 |
| Pender County, NC | 114 | 52 | 10 | 0 |
| Robeson County, NC | 129 | 55 | 16 | 1 |
| Darlington County, SC | 94 | 50 | 19 | 4 |
| Dillon County, SC | 59 | 24 | 4 | 0 |
| Florence County, SC | 124 | 69 | 21 | 3 |
| Georgetown County, SC | 86 | 59 | 20 | 3 |
| Horry County, SC | 307 | 190 | 46 | 7 |
| Marion County, SC | 65 | 35 | 8 | 2 |
| Marlboro County, SC | 51 | 22 | 3 | 0 |
| Williamsburg County, SC | 72 | 37 | 13 | 0 |
| TOTALS | 1605 | 860 | 236 | 25 |
Hail forms when raindrops are carried upward by thunderstorm updrafts into cold upper regions of the troposphere and freeze. Hail grows larger by colliding with liquid water drops that freeze onto the hailstone’s surface. Eventually hail falls to the ground when the thunderstorm's updraft can no longer support the weight of the hailstones which can occur if they become too heavy or if the updraft weakens.
Large hail (1.00 inch diameter or larger) occurs only in severe thunderstorms. These same severe thunderstorms often produce damaging winds, and can produce flooding or tornadoes as well.
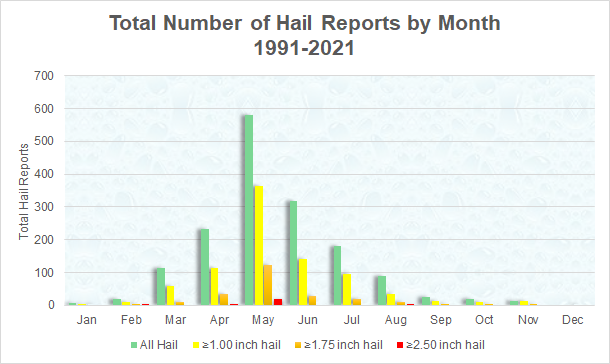
TOTAL NUMBER OF HAIL REPORTS BY MONTH, 1991-2021
|
All hail reports across the NWS Wilmington, NC forecast area between 1991 and 2021, by month and by maximum reported hailstone size. |
| Hail all sizes | Hail 1.00 inch | Hail 1.75 inch | Hail 2.50 inch | |
| January | 6 | 3 | 0 | 0 |
| February | 21 | 9 | 3 | 1 |
| March | 115 | 60 | 10 | 0 |
| April | 233 | 115 | 36 | 2 |
| May | 581 | 363 | 122 | 20 |
| June | 319 | 142 | 29 | 0 |
| July | 180 | 97 | 20 | 0 |
| August | 90 | 34 | 10 | 2 |
| September | 26 | 15 | 3 | 0 |
| October | 19 | 10 | 2 | 0 |
| November | 15 | 12 | 1 | 0 |
| December | 0 | 0 | 0 | 0 |
| TOTALS | 1605 | 860 | 236 | 25 |
No fatalities occurred due to hail in the NWS Wilmington, NC forecast area between 1991 and 2021. Some significant hail events in local history include:
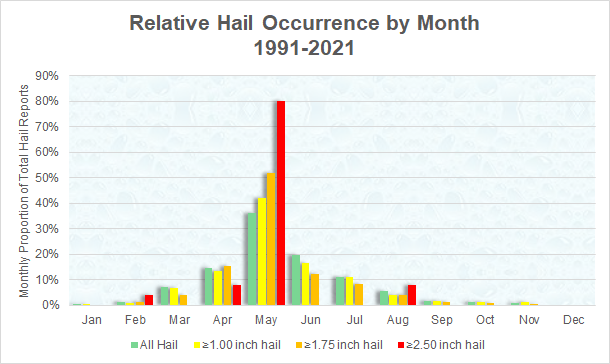
RELATIVE HAIL OCCURRENCE BY MONTH, 1991-2021
Small hail has been reported across southeastern North Carolina and northeastern South Carolina in every month of the year except for December. But from the standpoint of relative occurrence, 36 percent of all area hail reports are from the month of May.
Even more surprising is that 52 percent of all hail reports 1.75 inches and larger, and 80 percent of all hail reports 2.50 inches or larger in diameter have occurred during the month of May. May is, by far, the month most likely to see significant impacts from hail across this portion of the Carolinas.
|
Relative hail occurrence shows what percentage of total hail reports of various sizes occurred during each month of the year. The month of May stands out for its peak in large hail reports. |
| Hail all sizes | Hail 1.00 inch | Hail 1.75 inch | Hail 2.50 inch | |
| January | 0.4% | 0.3% | 0.0% | 0.0% |
| February | 1.3% | 1.0% | 1.3% | 4.0% |
| March | 7.2% | 7.0% | 4.2% | 0.0% |
| April | 14.5% | 13.4% | 15.3% | 8.0% |
| May | 36.2% | 42.2% | 51.7% | 80.0% |
| June | 19.9% | 16.5% | 12.3% | 0.0% |
| July | 11.2% | 11.3% | 8.5% | 0.0% |
| August | 5.6% | 4.0% | 4.2% | 8.0% |
| September | 1.6% | 1.7% | 1.3% | 0.0% |
| October | 1.2% | 1.2% | 0.8% | 0.0% |
| November | 0.9% | 1.4% | 0.4% | 0.0% |
| December | 0.0% | 0.0% | 0.0% | 0.0% |
| TOTALS | 100% | 100% | 100% | 100% |
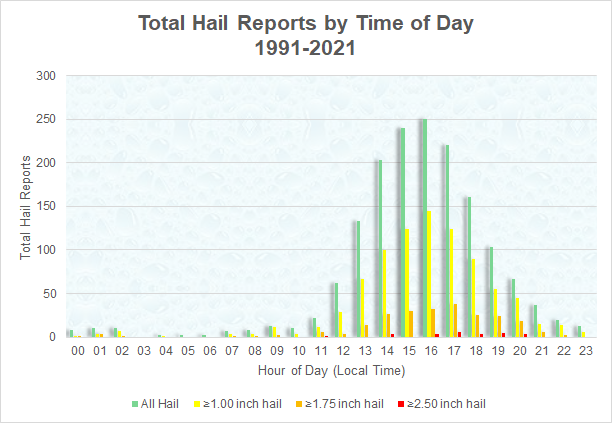
HAIL REPORTS BY TIME OF DAY, 1991-2021
Hail has a strong association with the afternoon and evening hours when solar heating can create atmospheric instability. This instability is necessary to fuel the thunderstorm updrafts that create hail. Hail is rare after 10:00 pm and during the morning hours.
|
Hail reports across the NWS Wilmington, NC forecast area binned by time of day and by size |
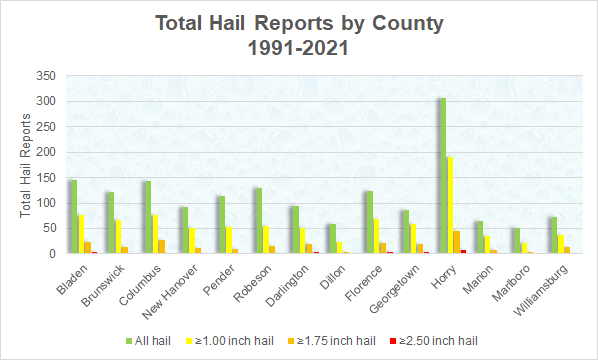
HAIL OCCURRENCE BY COUNTY, 1991-2021
Hail has fallen in virtually every community within the NWS Wilmington, NC forecast area. The largest number of reports of hail of all sizes originated from Horry County, SC.
Giant hail, 2.50 inches or larger in diameter is rare but was most likely to occur across inland areas of northeastern South Carolina. No hail reports of this size occurred during this study period across coastal southeastern North Carolina.
|
Total hail reports across the NWS Wilmington, NC forecast area binned by county and by size |
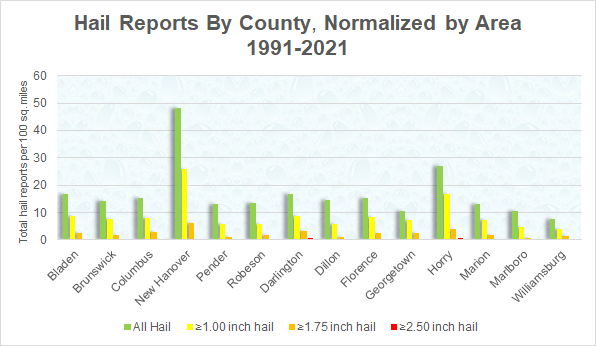
HAIL OCCURRENCE BY COUNTY NORMALIZED BY AREA
Since counties vary greatly in size, a better metric to gauge hail frequency may be the number of hail reports per unit area. The table and chart below shows county hail totals normalized by the number of events reported per 100 square miles over the period 1991 to 2021.
|
Hail reports across the NWS Wilmington, NC forecast area from 1991 to 2021, normalized by the number of reports per 100 square miles within each county. |
| Hail all sizes | Hail ≥ 1.00" | Hail ≥ 1.75" | Hail ≥ 2.50" | |
| Bladen County, NC | 16.7 | 8.7 | 2.6 | 0.3 |
| Brunswick County, NC | 14.4 | 7.8 | 1.6 | 0.0 |
| Columbus County, NC | 15.2 | 8.1 | 2.9 | 0.2 |
| New Hanover County, NC | 48.4 | 26.0 | 6.2 | 0.0 |
| Pender County, NC | 13.1 | 6.0 | 1.1 | 0.0 |
| Robeson County, NC | 13.6 | 5.8 | 1.7 | 0.1 |
| Darlington County, SC | 16.8 | 8.9 | 3.4 | 0.7 |
| Dillon County, SC | 14.6 | 5.9 | 1.0 | 0.0 |
| Florence County, SC | 15.5 | 8.5 | 2.6 | 0.4 |
| Georgetown County, SC | 10.6 | 7.3 | 2.5 | 0.6 |
| Horry County, SC | 27.1 | 16.8 | 4.1 | 0.4 |
| Marion County, SC | 13.3 | 7.2 | 1.6 | 0.0 |
| Marlboro County, SC | 10.6 | 4.6 | 0.6 | 0.0 |
| Williamsburg County, SC | 7.7 | 4.0 | 1.4 | 0.0 |
| TOTALS | 15.6 | 8.4 | 2.3 | 0.2 |
The relatively large normalized frequency of hail observed in New Hanover County, NC could reflect the high population density of the county and an assumed high reporting efficiency even for small hail. The relatively hail frequency calculated for some inland counties like Dillon, Marlboro, and Marion, SC, may reflect low population density and an assumed low reporting efficiency for hail there.
Reporting efficiency is a hypothetical ratio of reported hail events to the number of hail events that actually occurred -- a value that realistically cannot be known. Hail causing little or no damage across a rural area has a relatively low chance to be observed and reported; however, a similar event occurring within a densely populated area has a considerably higher chance of being reported.
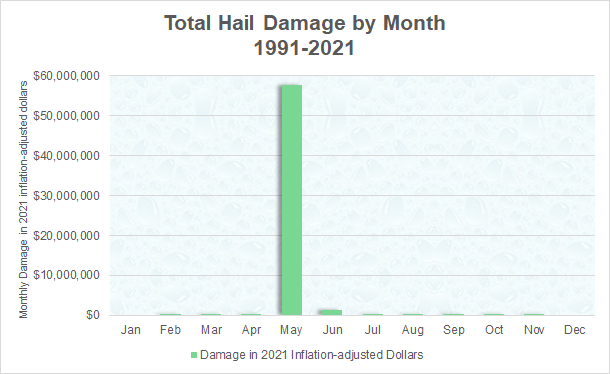
HAIL DAMAGE BY MONTH, 1991-2021
The vast majority of all reported property damage from hail across southeastern North Carolina and northeastern South Carolina between 1991 and 2021 has occurred during the month of May. The majority of that damage occurred during a single severe thunderstorm that struck the Florence, SC area on May 25, 2000 which caused over $47 million in damage as measured in inflation-adjusted 2021 dollars. Hail falling from other severe thunderstorms during the month of May has damaged an additional $10 million dollars of property.
Besides May, June is the only other month to have accumulated over $1 million in inflation-adjusted 2021 dollars of hail damage across southeastern North Carolina and northeastern South Carolina.
|
Total hail damage across the NWS Wilmington, NC forecast area from 1991 to 2021 in inflation-adjusted 2021 dollars. |
| Total Hail Damage in Inflation-adjusted 2021 Dollars | Percent of Total | |
| January | $0 | 0.0% |
| February | $36,750 | 0.1% |
| March | $34,708 | 0.1% |
| April | $134,889 | 0.2% |
| May | $57,698,827 | 96.7% |
| June | $1,269,811 | 2.1% |
| July | $160,984 | 0.3% |
| August | $127,665 | 0.2% |
| September | $99,830 | 0.2% |
| October | $24,085 | 0.0% |
| November | $54,615 | 0.1% |
| December | $0 | 0.0% |
| TOTALS | $59,642,164 | 100.0% |
DAMAGING WINDS (1991-2021)
Number of reported damaging wind events: 2627 (50% of all severe weather reports)
Total damage in inflation-adjusted 2021 dollars: $46,950,381 (12% of all severe weather damage)
Injuries: 73 (18% of all severe weather injuries)
Fatalities: 0 (0% of all severe weather fatalities)
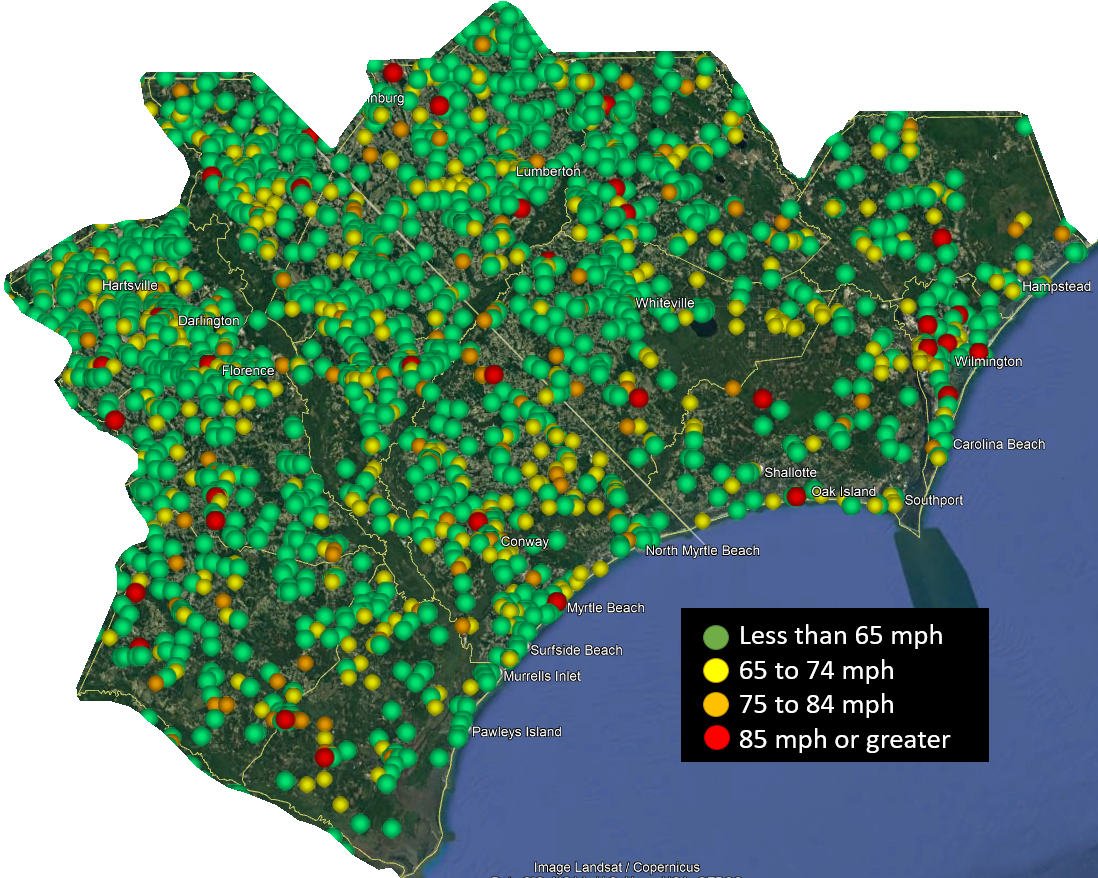
|
Map of all thunderstorm wind damage reports across the NWS Wilmington, NC forecast area between 1991 and 2021 |
DAMAGING WIND REPORTS BY COUNTY, 1991-2021
| All Damaging Wind | Wind ≥ 65 mph | Wind ≥ 75 mph | Wind ≥ 85 mph | |
| Bladen County, NC | 237 | 76 | 30 | 3 |
| Brunswick County, NC | 117 | 46 | 12 | 2 |
| Columbus County, NC | 206 | 81 | 28 | 2 |
| New Hanover County, NC | 105 | 45 | 13 | 8 |
| Pender County, NC | 112 | 52 | 12 | 1 |
| Robeson County, NC | 274 | 105 | 34 | 3 |
| Darlington County, SC | 285 | 90 | 18 | 2 |
| Dillon County, SC | 141 | 43 | 10 | 0 |
| Florence County, SC | 277 | 91 | 31 | 4 |
| Georgetown County, SC | 131 | 41 | 12 | 2 |
| Horry County, SC | 291 | 110 | 29 | 3 |
| Marion County, SC | 158 | 56 | 11 | 1 |
| Marlboro County, SC | 174 | 58 | 16 | 3 |
| Williamsburg County, SC | 119 | 40 | 15 | 2 |
| TOTALS | 2627 | 934 | 271 | 36 |
Although damaging winds can occur from a variety of weather events including tropical cyclones, Nor'easters, and strong fronts, this study focused on winds produced by thunderstorms. Note that straight-line wind events are counted separately from tornadoes.
Prior to 1996 many NWS storm damage reports did not include wind speed estimates or measurements. This may skew statistics slightly for damage without wind speeds of 58 mph or greater.
Some of the more notable instances of local thunderstorm wind damage include:
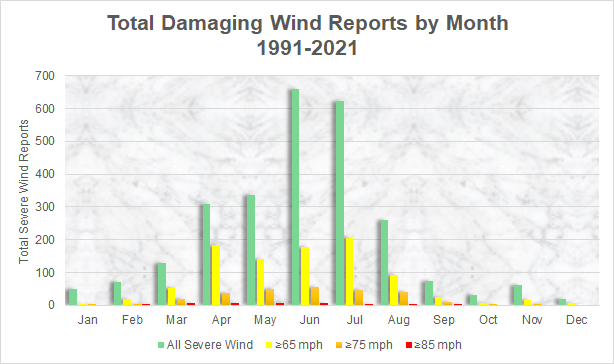
DAMAGING WIND REPORTS BY MONTH, 1991-2021
|
Damaging wind reports from severe thunderstorms across the NWS Wilmington, NC forecast area between 1991 and 2021, binned by month and maximum wind speed. |
| All Wind Damage | Wind | Wind | Wind | |
| January | 49 | 5 | 2 | 0 |
| February | 72 | 21 | 2 | 1 |
| March | 129 | 53 | 21 | 7 |
| April | 310 | 184 | 38 | 8 |
| May | 336 | 141 | 50 | 6 |
| June | 661 | 177 | 55 | 8 |
| July | 624 | 206 | 48 | 1 |
| August | 260 | 92 | 41 | 3 |
| September | 73 | 27 | 10 | 2 |
| October | 32 | 6 | 1 | 0 |
| November | 62 | 16 | 3 | 0 |
| December | 19 | 6 | 0 | 0 |
| TOTALS | 2627 | 934 | 271 | 36 |
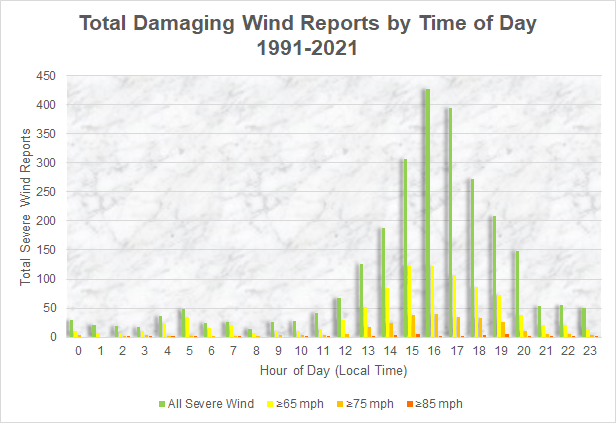
DAMAGING WIND REPORTS BY TIME OF DAY, 1991-2021
Damaging winds associated with thunderstorms peaked in occurrence between 3:00 pm and 7:00 pm local standard time and became more uncommon during the overnight hours. This mirrored the afternoon and early evening peak in thunderstorm occurrence driven by solar heating and subsequent destabilization of the atmosphere.
|
Total number of damaging wind reports across the NWS Wilmington forecast area, binned by time of day |
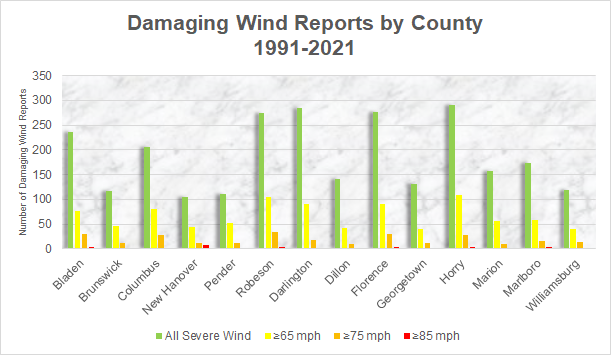
DAMAGING WIND REPORTS BY COUNTY, 1991-2021
Severe thunderstorms have produced damaging winds across all portions of the eastern Carolinas.
|
Damaging Wind Reports by County between 1991 and 2021 across the NWS Wilmington forecast area |
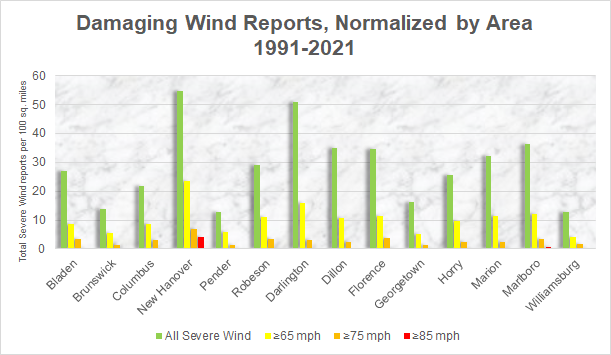
DAMAGING WIND REPORTS BY COUNTY, NORMALIZED BY AREA
Since counties vary greatly in size, a better metric to gauge damaging wind frequency may be the number of reports per unit area. The chart and table below shows county damaging wind totals normalized to the number of events reported per 100 square miles over the period 1991 to 2021.
|
Damaging Wind Reports from 1991 to 2021 for the NWS Wilmington forecast area by county, normalized by the number of reports per 100 square miles |
| All Wind Damage | Wind ≥ 65 mph | Wind ≥ 75 mph | Wind ≥ 85 mph | |
| Bladen County, NC | 27.1 | 8.7 | 3.4 | 0.3 |
| Brunswick County, NC | 13.8 | 5.4 | 1.4 | 0.2 |
| Columbus County, NC | 22.0 | 8.6 | 3.0 | 0.2 |
| New Hanover County, NC | 54.6 | 23.4 | 6.8 | 4.2 |
| Pender County, NC | 12.9 | 6.0 | 1.4 | 0.1 |
| Robeson County, NC | 28.9 | 11.1 | 3.6 | 0.3 |
| Darlington County, SC | 50.8 | 16.1 | 3.2 | 0.4 |
| Dillon County, SC | 34.8 | 10.6 | 2.5 | 0.0 |
| Florence County, SC | 34.6 | 11.4 | 3.9 | 0.5 |
| Georgetown County, SC | 16.1 | 5.0 | 1.5 | 0.2 |
| Horry County, SC | 25.7 | 9.7 | 2.6 | 0.3 |
| Marion County, SC | 32.3 | 11.4 | 2.2 | 0.2 |
| Marlboro County, SC | 36.3 | 12.1 | 3.3 | 0.6 |
| Williamsburg County, SC | 12.7 | 4.3 | 1.6 | 0.2 |
| TOTALS | 25.5 | 9.1 | 2.6 | 0.3 |
The relatively large normalized frequency of damaging winds observed in New Hanover County, NC could reflect the high population density of the county and an assumed high reporting efficiency for wind damage.
Reporting efficiency is a hypothetical ratio of reported damaging wind events to the number of damaging wind events that actually occurred -- a value that realistically cannot be known. Damaging wind causing little or no property damage across a rural area has a relatively low chance to be observed and reported; however, a similar event occurring within a densely populated area has a considerably higher chance of being reported.
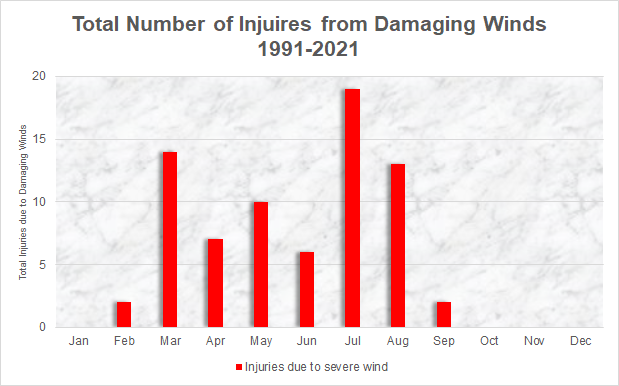
DAMAGING WIND INJURIES, 1991-2021
Winds from severe thunderstorms have caused 73 reported injuries across the NWS Wilmington, NC forecast area between 1991 and 2021. With the exception of two reported injuries in February and two more in September, all thunderstorm wind-related injuries have occurred during the spring and summer months of March through August.
During the period covered by this study, no fatalities were reported due to thunderstorm winds.
|
Total number of reported injuries due to severe thunderstorm winds across the NWS Wilmington, NC forecast area between 1991 and 2021, binned by month |
| Total Injuries Due to Thunderstorm Winds | Percent of Total | |
| January | 0 | 0.0% |
| February | 2 | 2.7% |
| March | 14 | 19.2% |
| April | 7 | 9.6% |
| May | 10 | 13.7% |
| June | 6 | 8.2% |
| July | 19 | 26.0% |
| August | 13 | 17.8% |
| September | 2 | 2.7% |
| October | 0 | 0.0% |
| November | 0 | 0.0% |
| December | 0 | 0.0% |
| TOTALS | 73 | 100.0% |
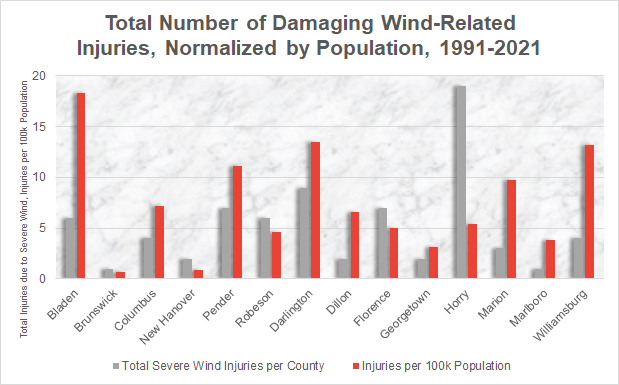
DAMAGING WIND INJURIES BY COUNTY, NORMALIZED BY POPULATION
The largest number of injuries due to thunderstorm winds over the study period occurred in Horry County with 19 reported during the study period. This was followed by Darlington County with nine wind-related injuries.
But when normalized by county population, Bladen County, NC was shown to have the highest per capita number of injuries due to thunderstorm winds at 18.3 injuries per 100,000 people. This is over three times the average of 5.2 injuries per 100,000 population across the NWS Wilmington, NC forecast area during the period 1991 to 2021
|
Injuries due to severe thunderstorm winds across the NWS Wilmington, NC forecast area between 1991 and 2021, and normalized by county population |
| North Carolina | Severe Thunderstorm Wind Injuries | Injuries per 100,000 population |
| Bladen | 6 | 18.3 |
| Brunswick | 1 | 0.7 |
| Columbus | 4 | 7.2 |
| New Hanover | 2 | 0.9 |
| Pender | 7 | 11.1 |
| Robeson | 6 | 4.6 |
| South Carolina | Severe Thunderstorm Wind Injuries | Injuries per 100,000 population |
| Darlington | 9 | 13.5 |
| Dillon | 2 | 6.6 |
| Florence | 7 | 5.1 |
| Georgetown | 2 | 3.2 |
| Horry | 19 | 5.4 |
| Marion | 3 | 9.8 |
| Marlboro | 1 | 3.8 |
| Williamsburg | 4 | 13.2 |
| TOTALS | 73 | 5.2 |
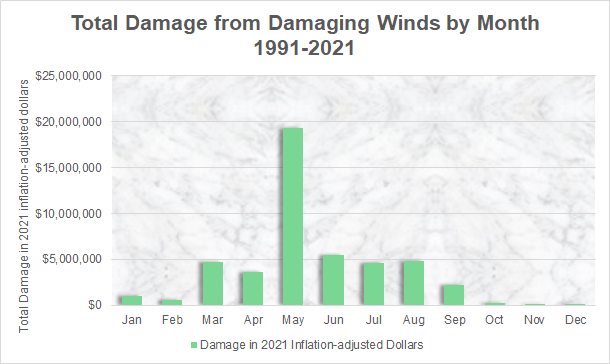
TOTAL WIND DAMAGE BY MONTH, 1991-2021
Across the NWS Wilmington, NC forecast area, property damage due to severe thunderstorm winds has occurred in all months of the year. The $19 million damage total for May is over 41 percent of total reported wind damage across the entire 1991 to 2021 period. Thunderstorm wind damage during the cool season (October through February) has relatively small cumulative damage totals.
|
Total Wind Damage in 2021-inflation adjusted dollars between 1991 and 2021 across the NWS Wilmington, NC forecast area |
| Total Wind Damage in Inflation-adjusted 2021 Dollars | Percent of Total | |
| January | $1,050,434 | 2.2% |
| February | $569,790 | 1.2% |
| March | $4,748,720 | 10.1% |
| April | $3,593,915 | 7.7% |
| May | $19,273,470 | 41.1% |
| June | $5,487,865 | 11.7% |
| July | $4,628,157 | 9.9% |
| August | $4,850,730 | 10.3% |
| September | $2,275,380 | 4.8% |
| October | $227,890 | 0.5% |
| November | $139,780 | 0.3% |
| December | $104,250 | 0.2% |
| TOTALS | $46,950,381 | 100.0% |
FLOODS (1996-2021)
Number of reported flood events: 766 (15% of all severe weather reports)
Total damage in inflation-adjusted 2021 dollars: $184,578,370 (48% of all severe weather damage)
Injuries: 4 (1% of all severe weather injuries)
Fatalities: 15 (43% of all severe weather fatalities)
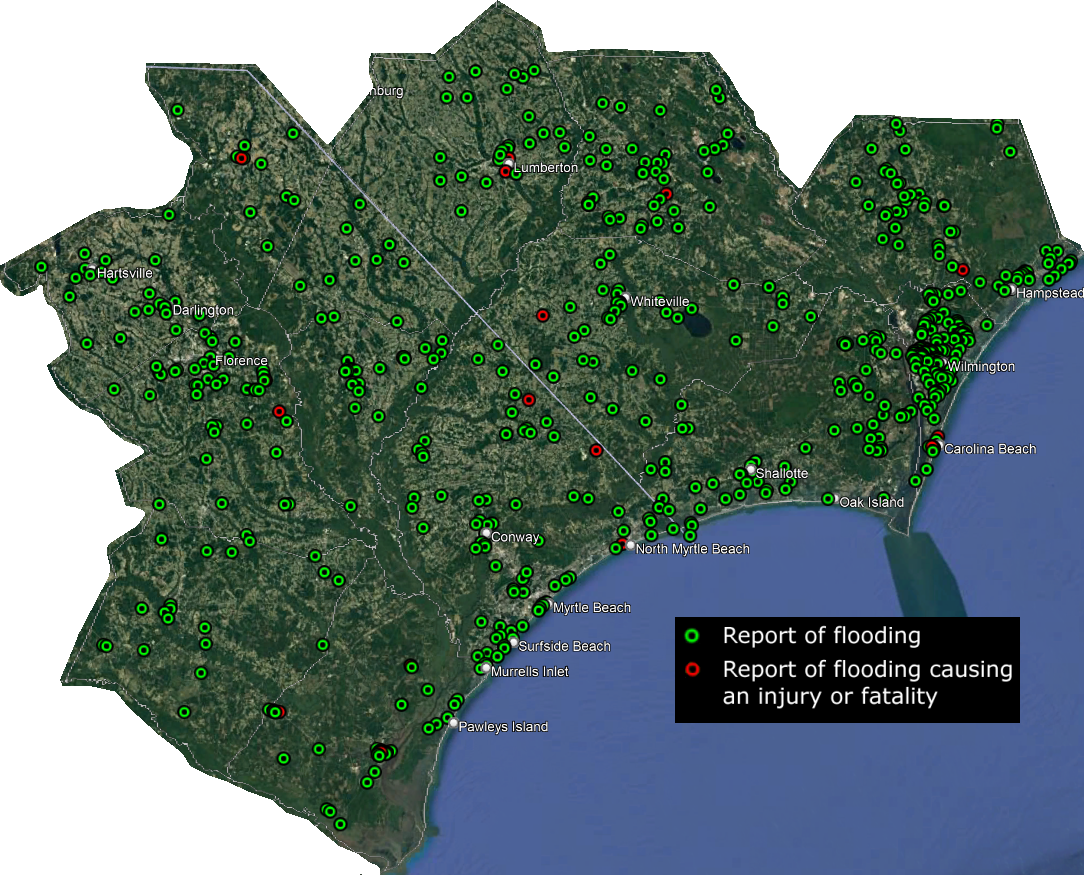
|
Map of all reports of flooding across the area covered by NWS Wilmington, NC between 1996 and 2021. Red circles indicate flooding that caused an injury or fatality. |
TOTAL NUMBER OF FLOOD EVENTS BY COUNTY, 1996-2021
| North Carolina | Non-tropical Floods | Tropical Floods |
| Bladen | 13 | 40 |
| Brunswick | 77 | 21 |
| Columbus | 24 | 21 |
| New Hanover | 133 | 27 |
| Pender | 66 | 19 |
| Robeson | 15 | 17 |
| South Carolina | Non-tropical Floods | Tropical Floods |
| Darlington | 20 | 9 |
| Dillon | 2 | 8 |
| Florence | 37 | 10 |
| Georgetown | 40 | 8 |
| Horry | 64 | 30 |
| Marion | 20 | 10 |
| Marlboro | 6 | 7 |
| Williamsburg | 19 | 3 |
| TOTALS | 536 | 230 |
Freshwater flooding across the eastern Carolinas comes from three primary sources:
Flash flooding is generally described as significant flooding that occurs rapidly due to ongoing heavy rainfall. Operationally and for record keeping purposes, "flash flooding" versus "flooding" has been classified differently over the years this study covers. For this reason, this study considered both types of flooding together rather than separately, with events sorted by the causative event: tropical cyclone vs. all others.
Systematic cataloging of flood events in NCEI's Storm Data publication did not begin until 1996.
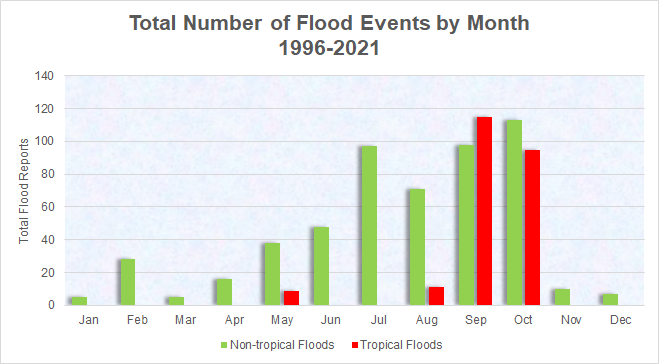
TOTAL NUMBER OF FLOOD EVENTS BY MONTH, 1996-2021
|
Number of reports of flooding across the NWS Wilmington, NC forecast area between 1996 and 2021, binned by causative event |
| Non-tropical Flood Reports | Tropical Flood Reports | |
| January | 5 | 0 |
| February | 28 | 0 |
| March | 5 | 0 |
| April | 16 | 0 |
| May | 38 | 9 |
| June | 48 | 0 |
| July | 97 | 0 |
| August | 71 | 11 |
| September | 98 | 115 |
| October | 113 | 95 |
| November | 10 | 0 |
| December | 7 | 0 |
| TOTALS | 536 | 230 |
Flooding has affected all portions of the eastern Carolinas and in every month of the year. Flooding is least likely to occur in winter and is most likely to occur during the summer and through the first half of the fall due to thunderstorms and tropical cyclones.
Some of the most significant flooding events in local history include:
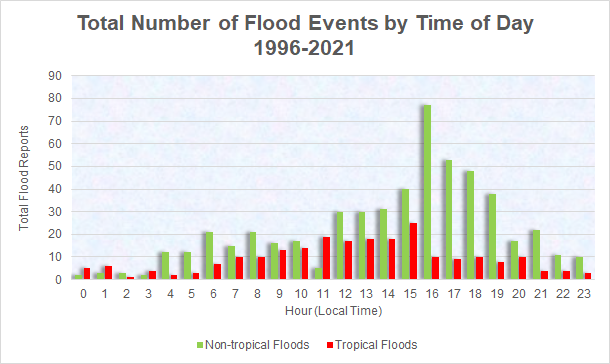
FLOODING EVENTS BY TIME OF DAY, 1996-2021
Flooding not associated with tropical cyclones shows a daily peak in occurrence between 3:00 pm and 7:00 pm, mirroring the late afternoon and early evening peak in summer thunderstorms. Flooding is least likely to occur during the early morning hours before 6:00 am.
Flooding associated with tropical cyclones shows less dependence on time of day but still occurs most often during the daylight hours between 9:00 am and 3:00 pm.
|
Flooding reports received across the NWS Wilmington, NC forecast area between 1996 and 2021 binned by cause and by time of day. |
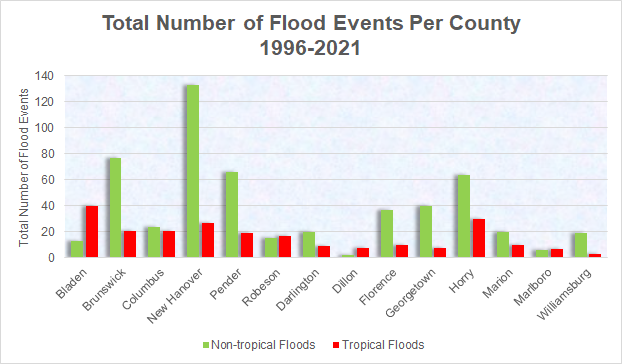
FLOOD EVENTS BY COUNTY, 1996-2021
Flooding from both tropical and non-tropical causes has affected every county in the NWS Wilmington, NC forecast area. The largest number of individual flood events has been reported from New Hanover County, NC, followed by Brunswick and Pender counties. The coastal Cape Fear counties of southeastern North Carolina have the highest average annual precipitation totals of the NWS Wilmington, NC forecast area, and also contain the populous Wilmington metro area.
Across northeastern South Carolina, the largest number of flood reports has come from Horry County, followed by Georgetown and Florence counties.
|
Total number of flood events across the NWS Wilmington NC forecast area between 1996 and 2021, binned by cause and by county. |
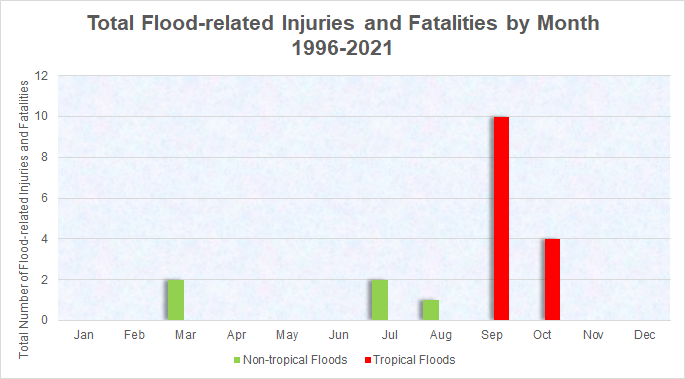
FLOODING INJURIES AND FATALITIES, 1996-2021
Tropical cyclone-related flooding made up 30 percent of all flooding reports across the NWS Wilmington, NC forecast area between 1996 and 2021, but was responsible for the majority of injuries and fatalities that occurred.
|
Total number of injuries and fatalities due to flooding across the NWS Wilmington, NC forecast area between 1996 and 2021, binned by cause and by month. |
| Non-tropical Flood Injuries + Fatalities | Tropical Flood Injuries + Fatalities | |
| January | 0 | 0 |
| February | 0 | 0 |
| March | 2 | 0 |
| April | 0 | 0 |
| May | 0 | 0 |
| June | 0 | 0 |
| July | 2 | 0 |
| August | 1 | 0 |
| September | 0 | 10 |
| October | 0 | 4 |
| November | 0 | 0 |
| December | 0 | 0 |
| TOTALS | 5 | 14 |
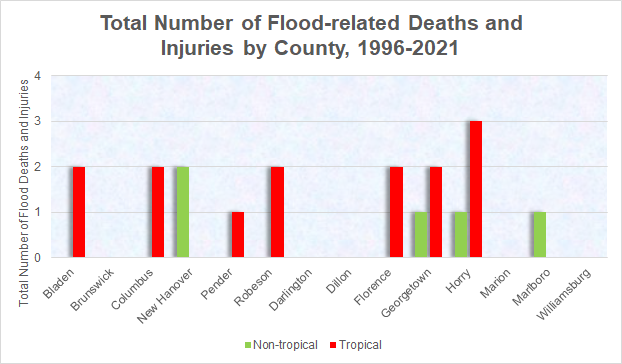
FLOODING INJURIES AND FATALITIES BY COUNTY, 1996-2021
|
Flood related deaths and injuries across the NWS Wilmington forecast area between 1996 and 2021, binned by cause and by county. |
| North Carolina | Non-tropical Flood Injuries + Fatalities | Tropical Flood Injuries + Fatalities |
| Bladen | 0 | 2 |
| Brunswick | 0 | 0 |
| Columbus | 0 | 2 |
| New Hanover | 2 | 0 |
| Pender | 0 | 1 |
| Robeson | 0 | 2 |
| South Carolina | Non-tropical Flood Injuries + Fatalities | Tropical Flood Injuries + Fatalities |
| Darlington | 0 | 0 |
| Dillon | 0 | 0 |
| Florence | 0 | 2 |
| Georgetown | 1 | 2 |
| Horry | 1 | 3 |
| Marion | 0 | 0 |
| Marlboro | 1 | 0 |
| Williamsburg | 0 | 0 |
| TOTALS | 5 | 14 |
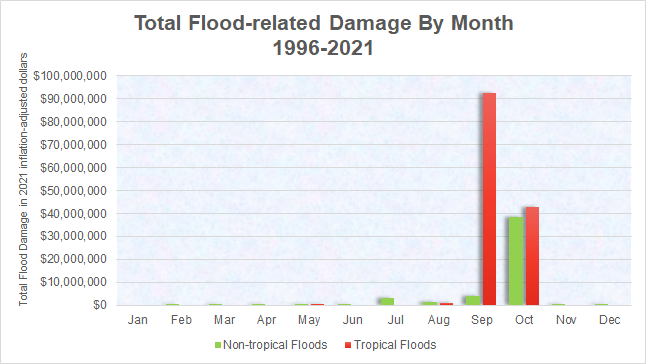
FLOOD DAMAGE, 1996-2021
The vast majority of reported flood damage within the NWS Wilmington, NC forecast area has occurred during hurricanes in September and October. Hurricanes Florence (2018), Matthew (2016), and Floyd (1999) produced widespread and exceptional flood damage across many portions of the Carolinas.
When considered together with the October 2015 floods, these four events make up the vast majority of the flood impacts this area received over the period 1996 to 2021.
|
Total flood damage across the NWS Wilmington, NC forecast area between 1996 and 2021, binned by cause and by month. Damage is reported in inflation-adjusted 2021 dollars. |
| Month | Non-tropical Flood Damage | Tropical Flood Damage | Total Flood Damage |
| January | 0 | 0 | 0 |
| February | $135,600 | 0 | $135,600 |
| March | $191,250 | 0 | $191,250 |
| April | $105,450 | 0 | $105,450 |
| May | $37,240 | $4,200 | $41,440 |
| June | $246,850 | 0 | $246,850 |
| July | $3,269,160 | 0 | $3,269,160 |
| August | $1,633,420 | $1,001,000 | $2,634,420 |
| September | $4,246,200 | $92,496,400 | $96,742,600 |
| October | $38,389,500 | $42,804,400 | $81,193,900 |
| November | $6,300 | 0 | $6,300 |
| December | $11,400 | 0 | $11,400 |
| Totals | $48,272,370 | $136,306,000 | $184,578,370 |


 Coastal Flood