News:
Resources:
|
Current Drought Situation: The maps below are from the U.S. Drought Monitor. They show the latest drought conditions
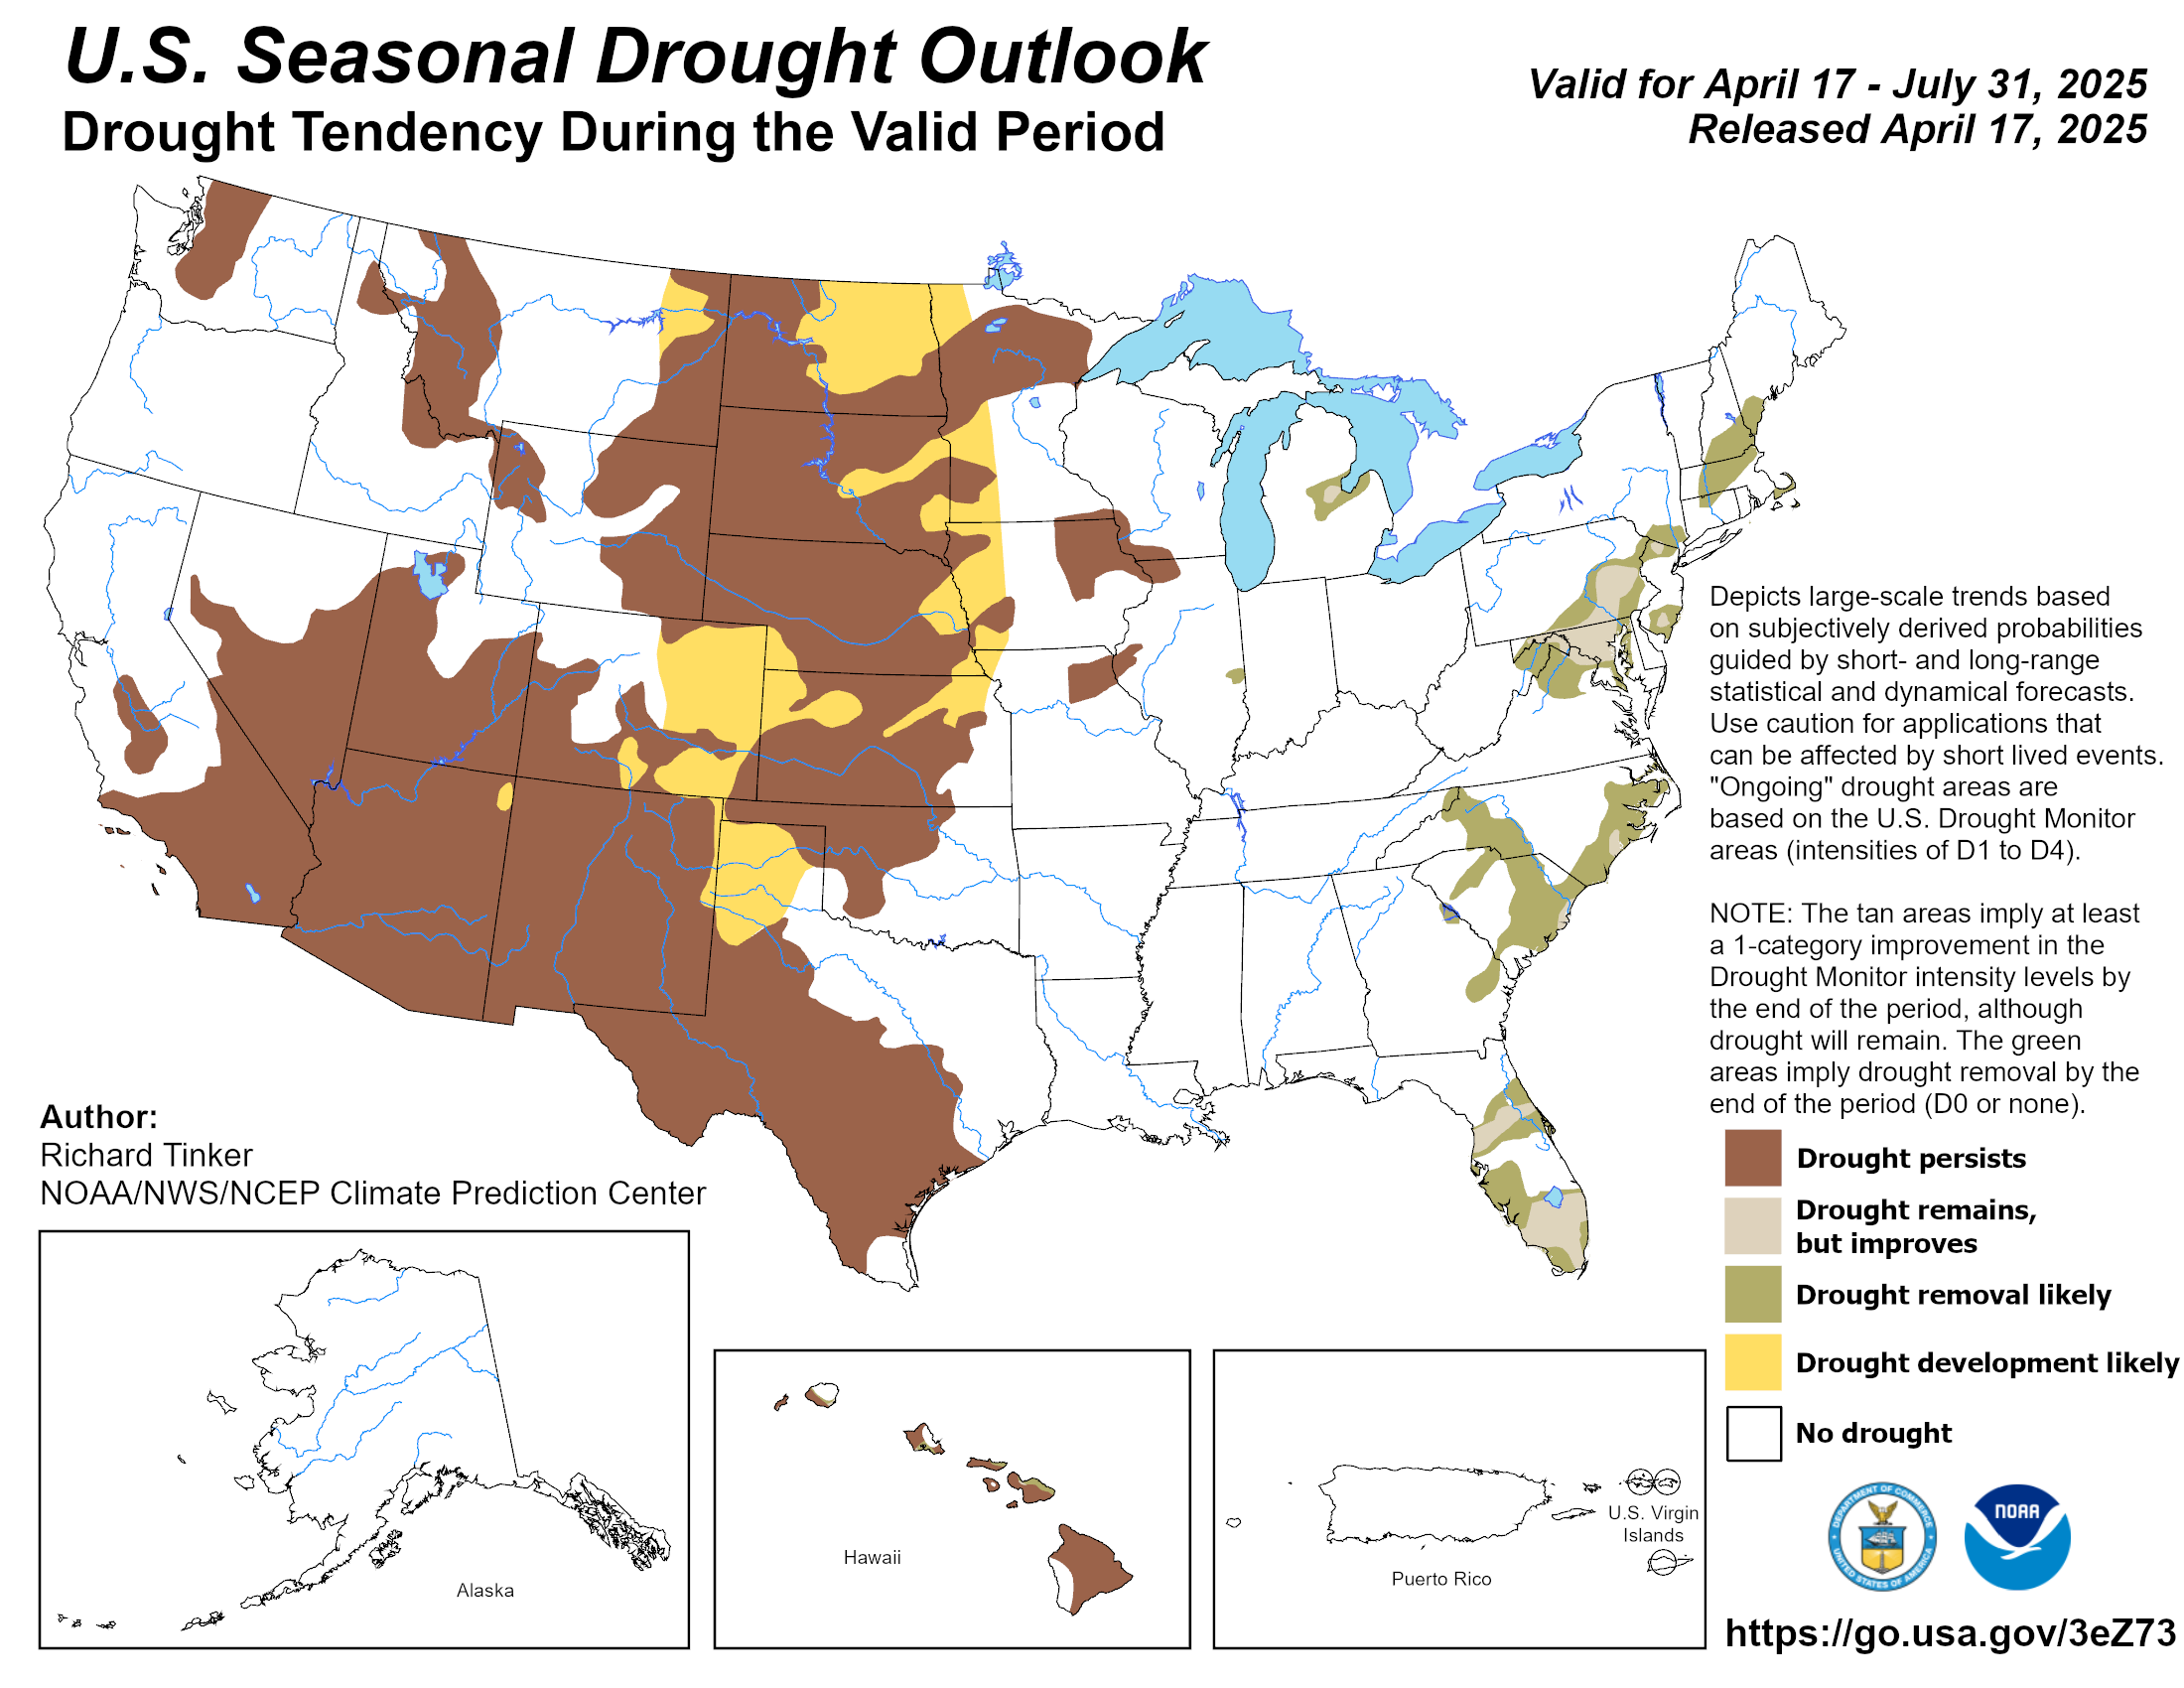
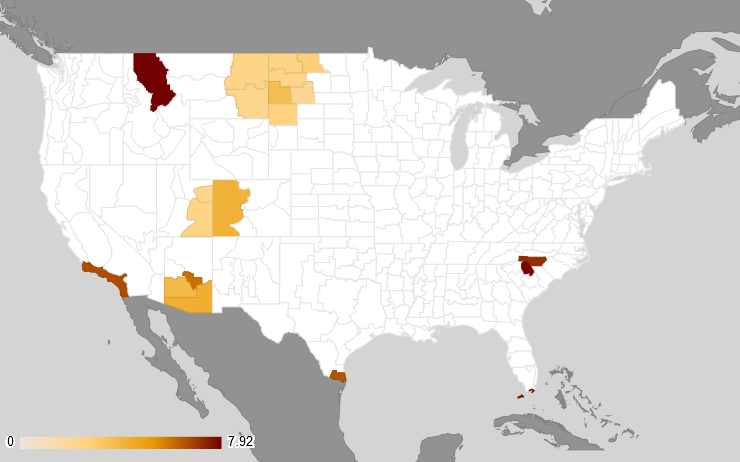
The maps below are from the Climate Prediction center Seasonal Drought Outlook and the National Centers for Environmental Information Drought Termination and Amelioration index. Click the images to see the latest data.
The U.S. Drought Monitor is a weekly collaborative effort between a number of federal agencies including NOAA/NWS, U.S. Department of Agriculture and the National Drought Mitigation Center. The product is updated weekly on Thursdays at 8:30 AM Eastern Time. For those needing to look at past U.S. Drought Monitors an archive is available back to January 4, 2000. This information can be found at the following link. |
The categories of drought are defined as follows: Moderate Drought (D1) - Some damage to crops, pastures; fire risk high; streams, reservoirs, or wells low, some water shortages developing or imminent, voluntary water use restrictions requested. Severe Drought (D2) - Crop or pasture losses likely; fire risk very high; water shortages common; water restrictions imposed. Extreme Drought (D3) - Major crop/pasture losses; extreme fire danger; widespread water shortages or restrictions. Exceptional Drought (D4) - Exceptional and widespread crop/pasture losses; exceptional fire risk; shortages of water in reservoirs, streams, and wells, creating water emergencies. |
| River and Streamflow Conditions: |
|
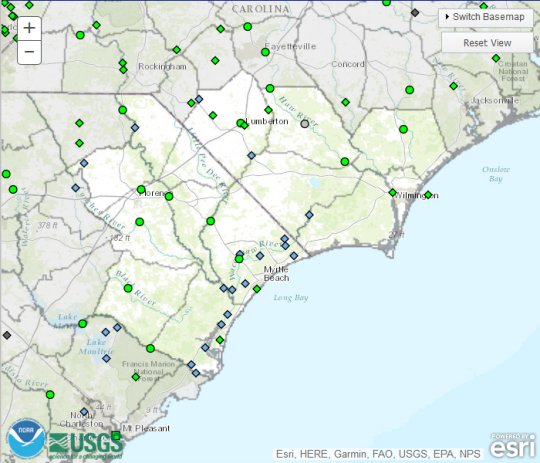
Click the image below to see the latest river readings and forecasts in the NWS Wilmington Hydrologic Service Area (HSA).
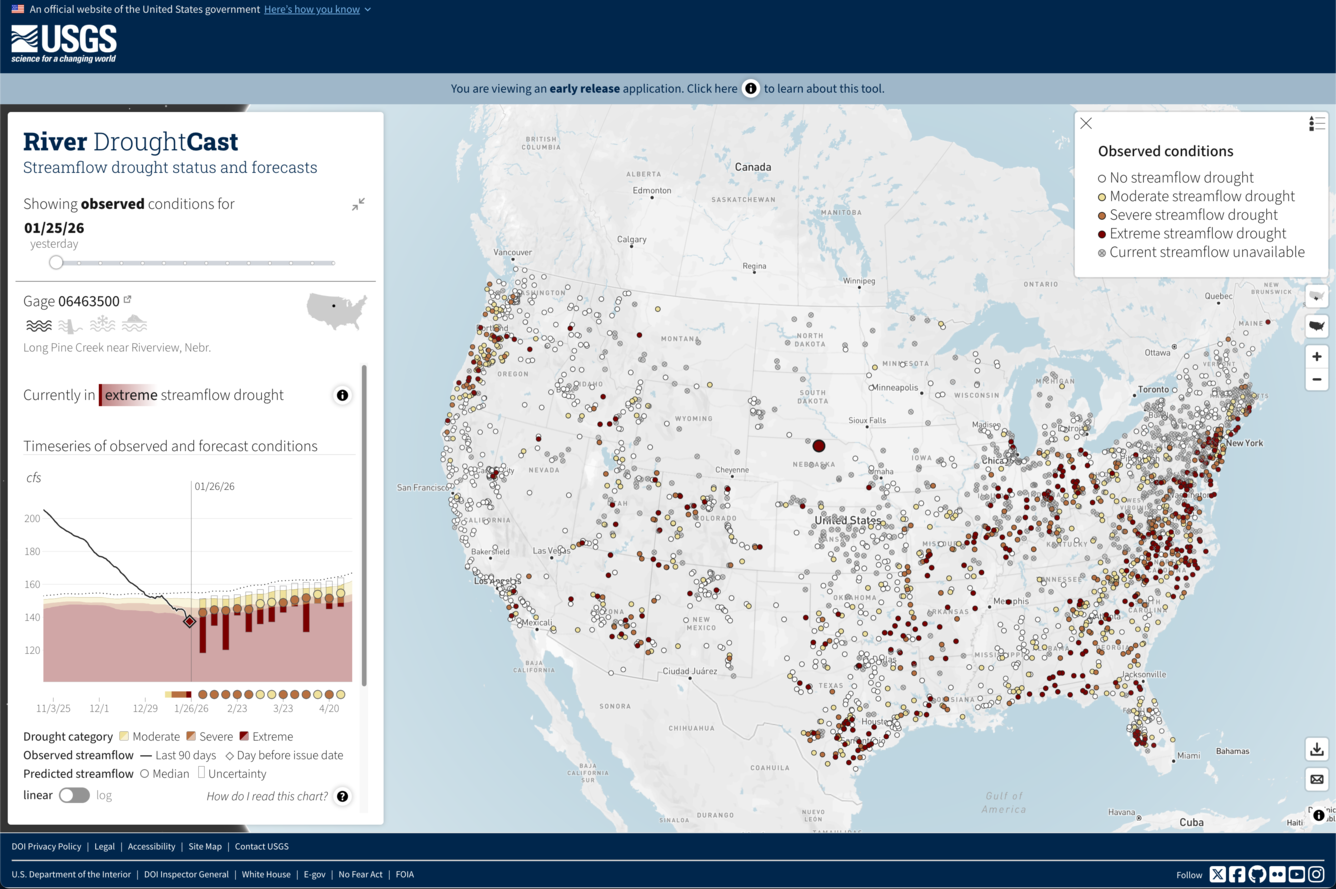
The image below depicts the latest USGS River DroughtCast map for the United States. Click the image to view data fpr Southeast North Carolina and Northeast South Carolina.
|
Hourly and forecast river stages out to 90 days can be found at the National Weather Service's (NWS) National Water Prediction Service (NW PS) web page: Additional Current stream and river stages may be viewed at the following USGS Web Site: |
||
| Precipitation/Temperature Outlooks: |
This section contains the 8-14 day, monthly, and 3-month temperature and precipitation outlooks.
8-14 Day Outlook:
 |
 |
|
Temperature
|
Precipitation
|
| A narrative is also available at the following link. | |
Monthly Outlook: (These are updated on the third Thursday of each month)
 |
 |
|
Temperature
|
Precipitation
|
| A narrative is also available at the following link. | |
3-Month (Seasonal)Outlook: (These are updated on the third Thursday of each month)
 |
 |
|
Temperature
|
Precipitation
|
|
A narrative is also available at the following link. |
|
| Ground Water Impacts: |
|
The USGS maintains a network of wells to monitor the effects of droughts and other climate variability on ground-water levels. The network consists of a national network of about 140 wells monitored as part of the Ground-Water Resources Program, supplemented by wells in some States monitored as part of the Cooperative Water Program. For a list of network wells, click on a State on the image below. USGS GroundWater Level Networks
|
| Ground Water Impacts: |
|
The USGS maintains a network of wells to monitor the effects of droughts and other climate variability on ground-water levels. The network consists of a national network of about 140 wells monitored as part of the Ground-Water Resources Program, supplemented by wells in some States monitored as part of the Cooperative Water Program. For a list of network wells, click on a State on the image below.
|
Additional information about ground levels can be found either at the USGS Ground-Water Climate Response Network at: |
| Fire Danger Hazards: |
|
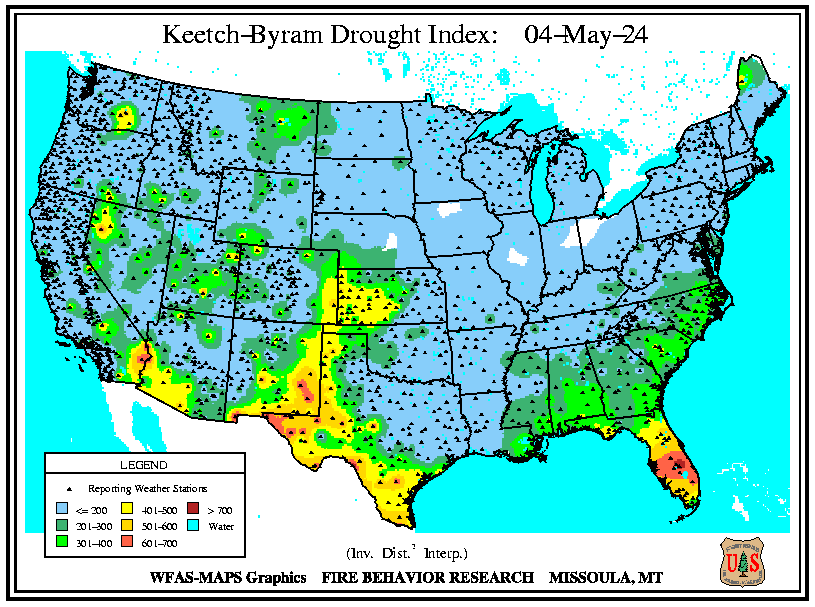
Keetch-Byram Drought Index (KBDI): This is a drought index that is specifically related to fire potential. The KBDI is broken into four categories which indicate the susceptibility of ground fuels to fire danger. The table in the right hand column indicates what the categories mean.
Dead Fuel Moisture: Dead fuel moisture responds solely to ambient environmental conditions and is critical in determining fire potential. Dead fuel moistures are classed by timelag. A fuel's timelag is proportional to its diameter and is loosely defined as the time it takes a fuel particle to reach 2/3's of its way to equilibrium with its local environment. Dead fuels in NFDRS fall into four classes (1-hour, 10-hour, 100-hour, and 1000-hour); however, when looking at droughts usually only the 100-hour and 1000-hour fuel moisture are watched. WFAS Products can be viewed here. |
For updated DNR Fire Conditions consult the following Web Sites: In North Carolina: In South Carolina: The Keetch-Byram Drought Index (KBDI) is a drought index that is specifically related to fire potential. The KBDI is broken into four categories which indicate the susceptibility of ground fuels to fire danger. Below are the four categories and a brief description of each.
KBDI and Dead Fuel Moisture data can be found on the Wildland Fire Assessment System (WFAS) web site at: |
||||||||||||
| Agriculture Impacts: |
|
For additional information on agriculture impacts may be viewed at the United States Department of Agriculture (USDA) National Agricultural Statistics Service NASS Web Site. |


 Coastal Flood