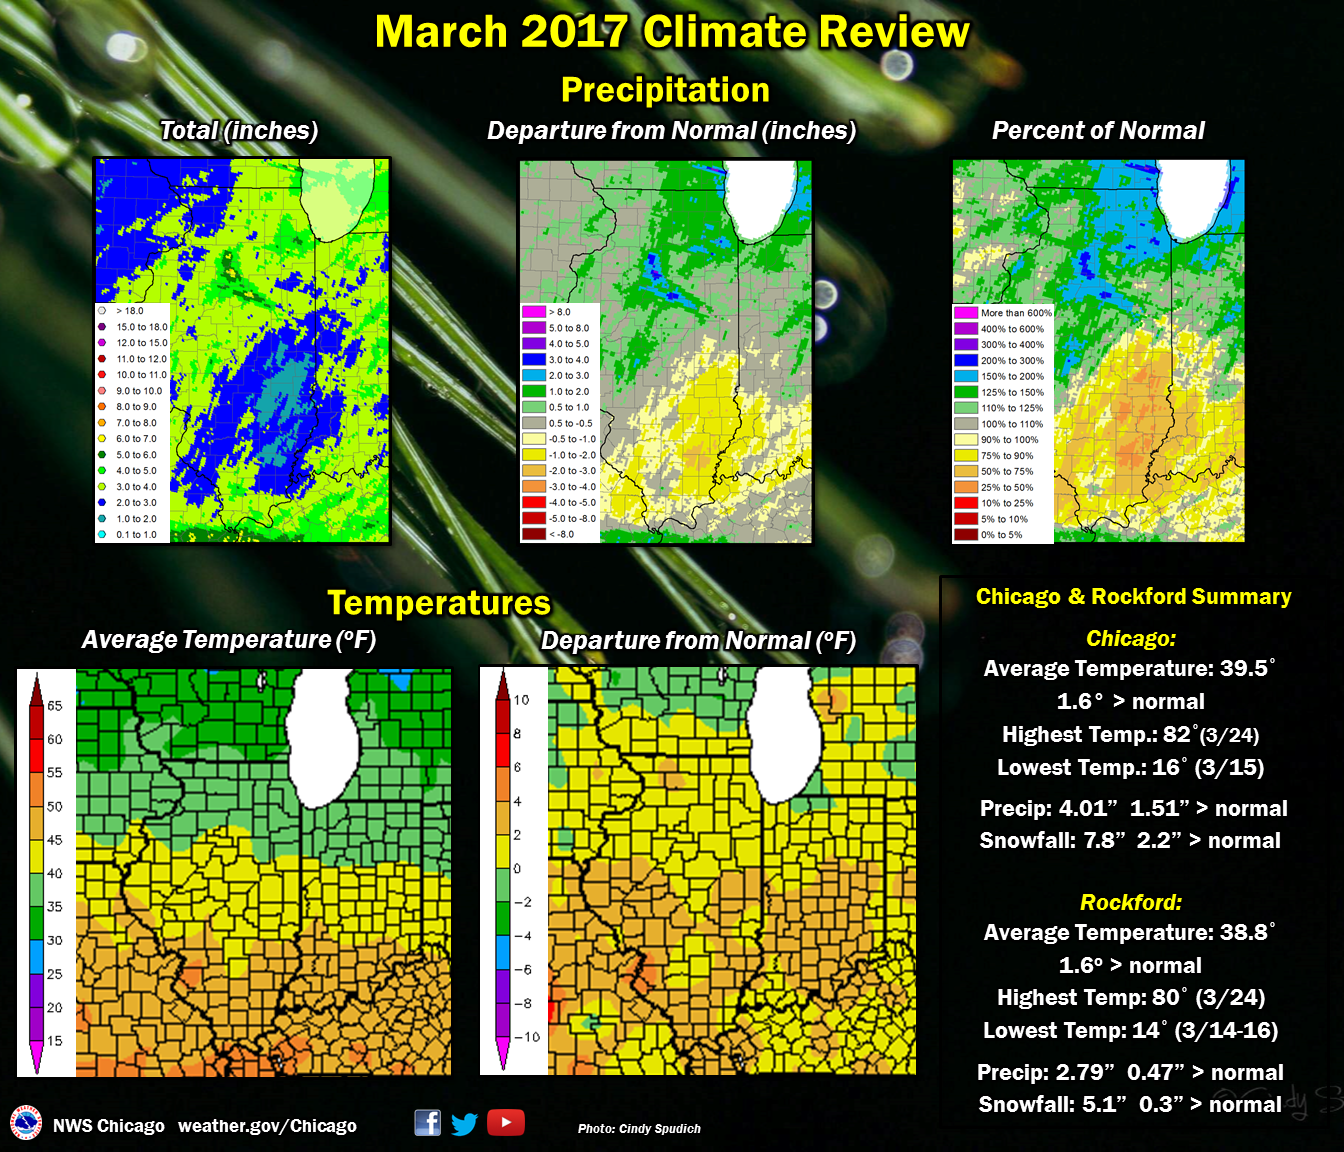
March 2017 featured above normal temperatures on average and above normal precipitation for most of the area.
| March 2017 Review: Precipitation and Temperatures |
 |
| March 2017 Review: Snowfall |
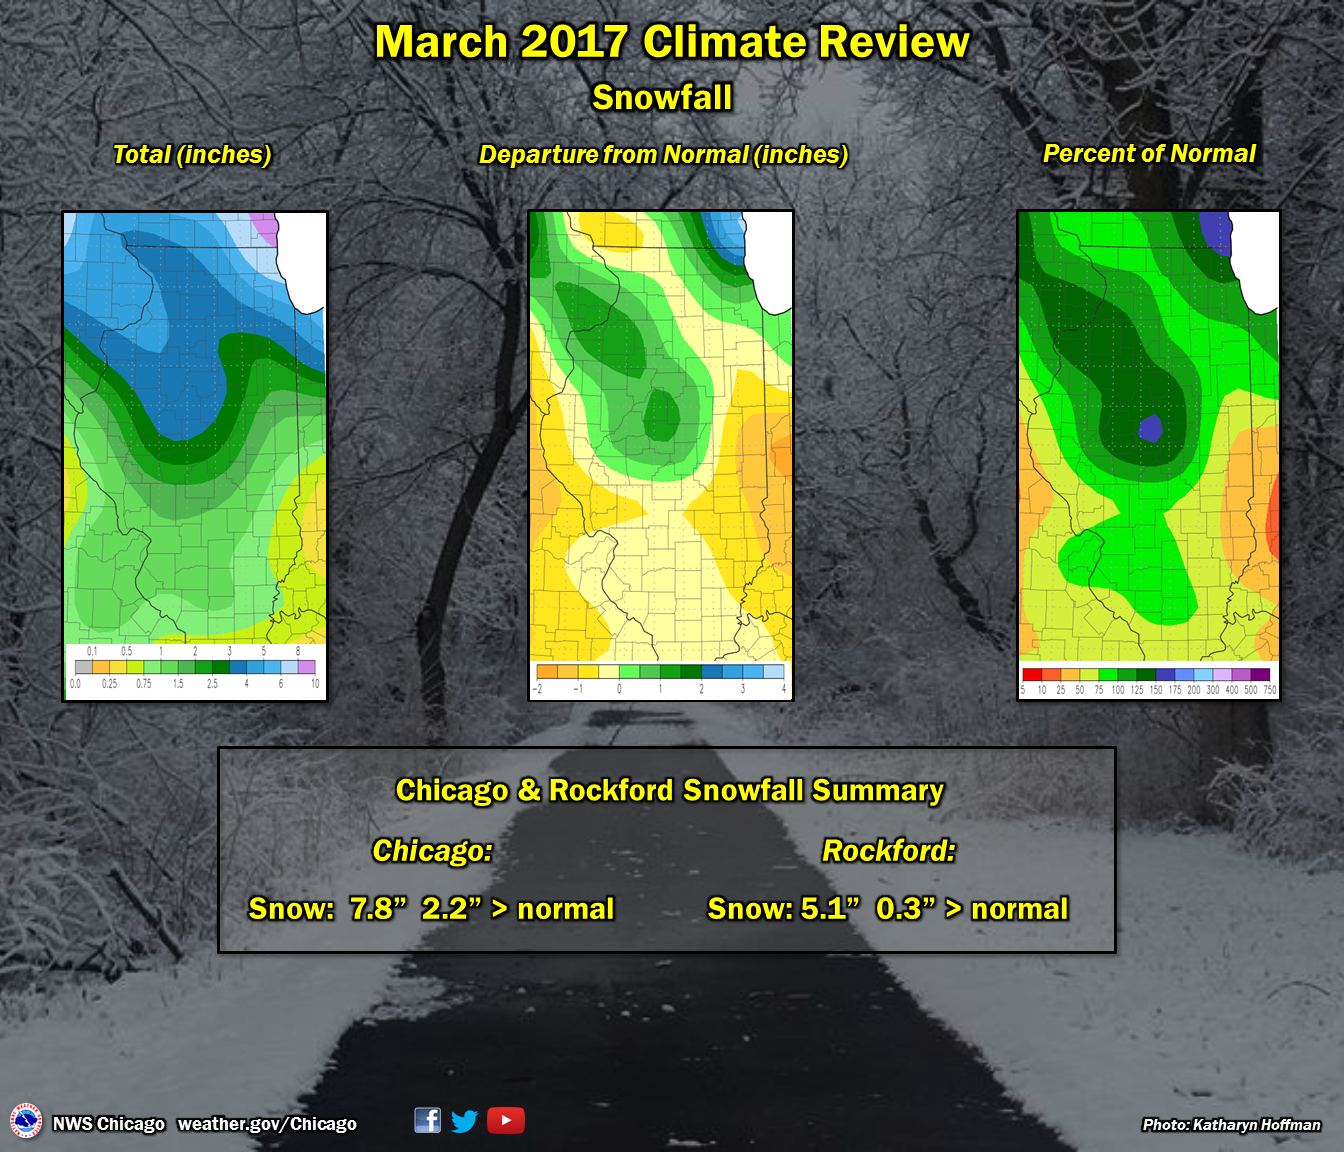 |
| Climate Maps are from the Midwest and Northeast Regional Climate Centers and Illinois State Water Survey |
Public Information Statement
National Weather Service Chicago IL
852 AM CDT Sat Apr 1 2017 /952 AM EDT Sat Apr 1 2017/

...A Look Back at the Climate for the Month of March 2017 for
Chicago and Rockford...

At Chicago, the average high temperature was 47.1 degrees, which
is 0.5 degrees above normal. The average low temperature was 31.8
degrees, which is 2.6 degrees above normal. The average
temperature for the month was 39.5 degrees which is 1.6 degrees
above normal. During the month of March, 4.01 inches of
precipitation were recorded, which is 1.51 inches above normal.
7.8 inches of snow were recorded, which is 2.2 inches above
normal.

Two records were set for Chicago for the month of March 2017:
* Record daily maximum temperature of 82 degrees on the 24th.
* Record daily precipitation of 1.84 inches on the 30th.

At Rockford, the average high temperature was 47.8 degrees, which
is 0.9 degrees above normal. The average low temperature was 29.8
degrees, which is 2.3 degrees above normal. The average
temperature for the month was 38.8 degrees, which is 1.6 degrees
above normal. During the month of March, 2.79 inches of
precipitation were recorded, which is 0.47 inches above normal.
5.1 inches of snow were recorded, which is 0.3 inches above
normal.

Two records were set for Rockford for the month of March 2017:
* Tied record daily maximum temperature of 80 degrees on the
  24th.
* Record daily precipitation of 1.47 inches on the 30th.


$$

