| Around the fifth century, the European Celts believed that animals had certain supernatural powers on special days that were half-way between the Winter Solstice and Spring Equinox. Folklore from Germany and France indicated that when marmots and bears came out of their winter dens too early, they were frightened by their shadow and retreated back inside for four to six weeks. This was adopted by the Romans as Hedgehog Day. When Christianity came into being, the formerly pagan observance also came to be called Candlemas.
The earliest known American reference to Groundhog Day can be found at the Historical Society of Berks County in Reading, Pa. The reference was made Feb. 4, 1841 in Morgantown, Berks County (Pennsylvania) storekeeper James Morris’ diary: Last Tuesday, the 2nd, was Candlemas day, the day on which, according to the Germans, the Groundhog peeps out of his winter quarters and if he sees his shadow he pops back for another six weeks nap, but if the day be cloudy he remains out, as the weather is to be moderate.
|
 |
|
In the U.S. the tradition derives from a Scottish poem: As the light grows longer, The cold grows stronger. If Candlemas be fair and bright, Winter will have another flight. |
In western countries in the Northern Hemisphere the official first day of Spring is about six weeks after Groundhog Day, on March 20 or 21. About 1,000 years ago, before the adoption of the Gregorian calendar when the date of the equinox drifted in the Julian calendar, the spring equinox fell on March 16 instead. This was exactly six weeks after February 2. Assuming that the equinox marked the first day of spring in certain medieval cultures, as it does now in western countries, Groundhog Day occurred exactly six weeks before spring. Therefore, if the groundhog saw his shadow on Groundhog Day there would be six more weeks of winter. If he didn’t, there would be 42 more days of winter. In other words, the Groundhog Day tradition may have begun as a bit of folk humor.
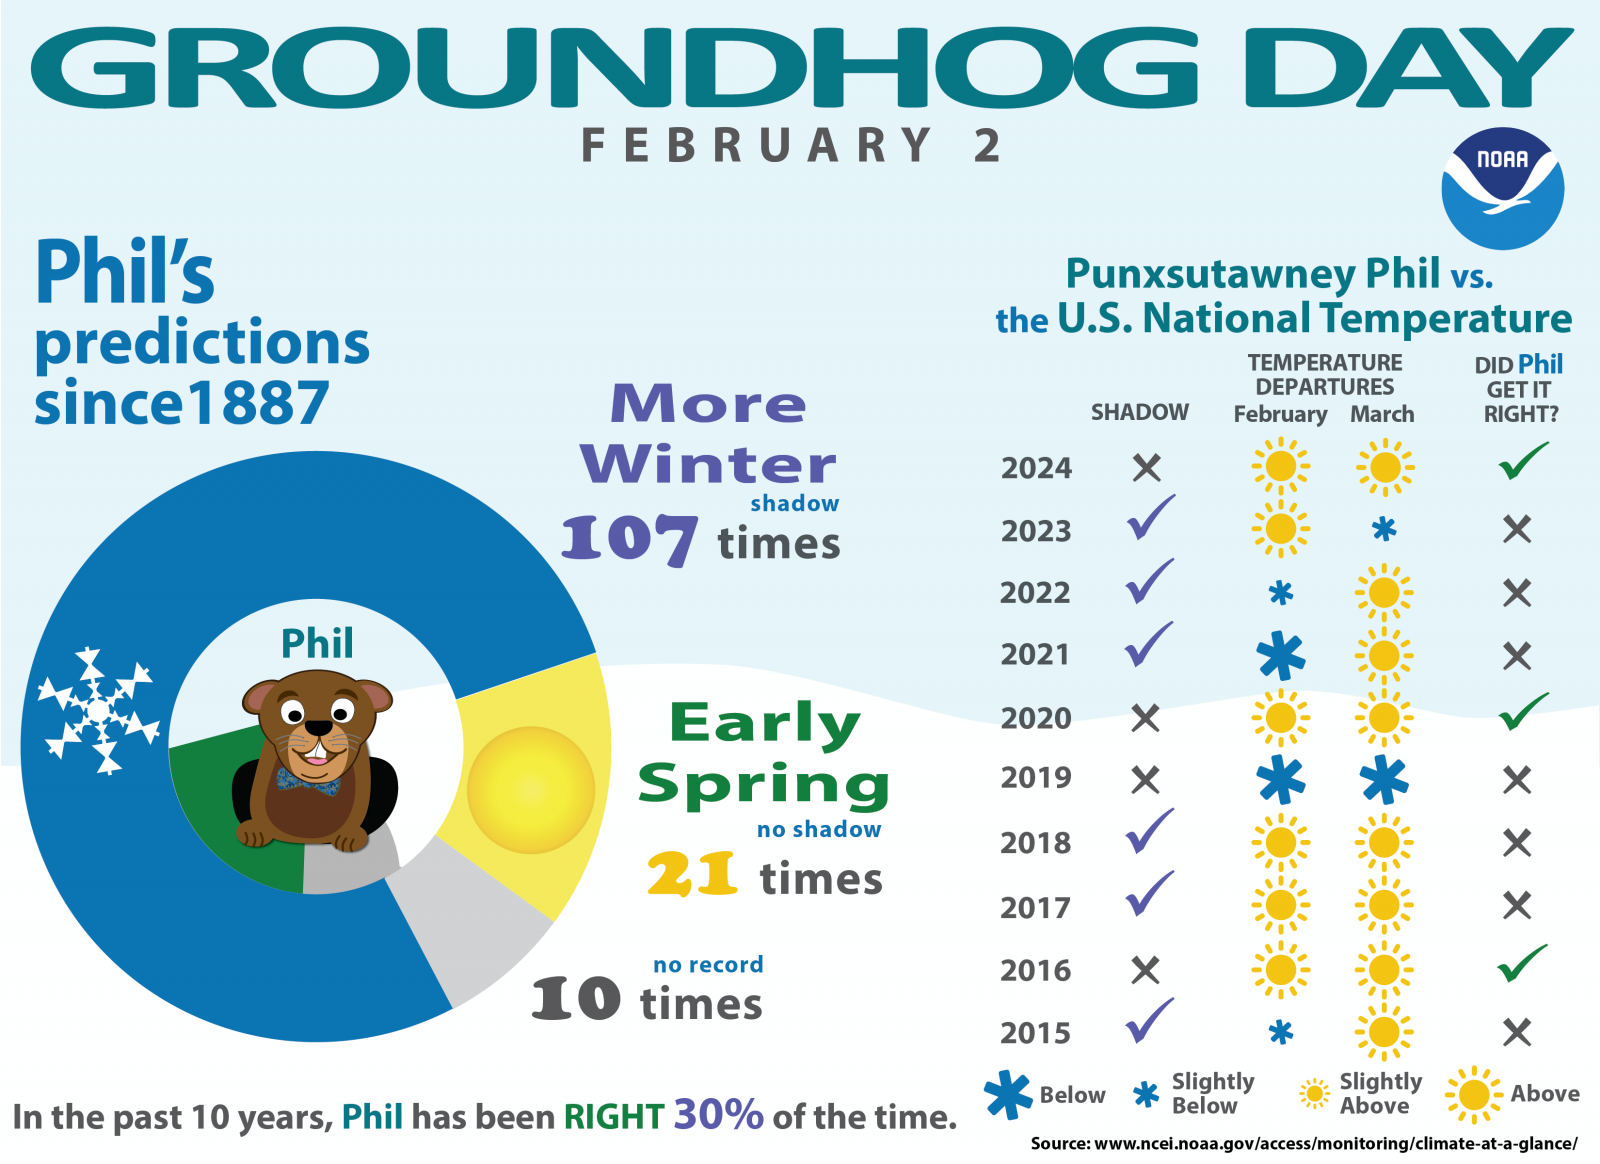
Regardless, the annual prognostication occurs in Punxsutawney, Pennsylvania. According to the Punxsutawney Groundhog Club, 1886 was the first year that Groundhog Day in the city's newspaper. The first official prediction occurred the following year, with Phil seeing his shadow and predicting 6 more weeks of winter. He has been making forecasts ever since.
Below are some Groundhog Day weather statistics for Pittsburgh, PA, Morgantown, WV and Zanesville, OH.
Pittsburgh, PA:
The following statistics comprises 153 years of data. From 1871 through June 1945, the data came from various locations in downtown Pittsburgh. From July 1945 through mid-September 1952, the data came from the Allegheny County Airport. Since then, the data has been gathered at the Pittsburgh International Airport.
| Groundhog Day in Pittsburgh, PA (Period of Record 1871-2024) |
||||
|
1991-2020 Normals
|
Records
|
|||
| Maximum Temperature |
37°F
|
Warmest High Temperature |
62°F
|
February 2, 1903
|
| Coldest High Temperature |
10°F
|
February 2, 1971
|
||
| Minimum Temperature |
21°F
|
Warmest Low Temperature |
46°F
|
February 2, 1903
|
| Coldest Low Temperature |
-7°F
|
February 2, 1961
|
||
| Average Temperature |
29°F
|
Warmest Average Temperature |
51.5°F
|
February 2, 1877
|
| Coldest Average Temperature |
1.0°F
|
February 2, 1971
|
||
| Precipitation |
0.09"
|
Wettest |
1.04"
|
February 2, 1988
|
| Snowfall |
0.5"
|
Snowiest |
2.5"
|
February 2, 2007
|
| Snow Depth at 7 AM |
2"
|
Most Snow of Ground at 7 AM *record since 1948* |
11"
|
February 2, 1966
|
The odds of having any precipitation at all on Groundhog Day is 76.5% (117 out of 153). There has been measurable (0.01" or greater) precipitation on 74 Groundhog Days (48.4%) and trace amounts (less than 0.01") of precipitation on 43 Groundhog Days (28.1%).
Since 1880, it has snowed on 80 out of 144 (55.6%) Groundhog Days. Measurable snow (0.1" or greater) has fallen on 42 Groundhog Days (29.2%) and trace of snow (a dusting) has fallen on another 38 Groundhog Days (26.4%)
Since 1948, residents have woken up with measurable snow (1/2" or greater) on the ground 35 out of 77 times (45.5%), trace amounts (less than a 1/2" inch) 12 times (15.6%), and no snow 29 times (37.7%).
The odds of having a maximum temperature at or below freezing (32°F) on Groundhog Day is 35.3% (53 out of 150), and the odds of having a minimum temperature at or below freezing is 84.0% (126 out of 150). The odds of having a minimum temperature at or below 0°F on Groundhog Day is 4.0% (6 out of 150).
In 2025, the high temperature was 40°F and the low temperature was 22°F. A trace of precipitation fell, with no snow recorded. There was no snow on the ground at 7 AM. The average wind speed was 5.0 mph, with a maximum speed of 13 mph out of the north northwest.
Morgantown, WV:
The following statistics comprises 151 years of data. From 1873 through July 1946, the data came from a cooperative observer in the Morgantown area with occasional periods of missing data. Since then, the data has come from the Morgantown Municipal Airport-Walter L. Bill Hart Field.
| Groundhog Day in Morgantown, WV (Period of Record 1873-2024) |
||||
|
1991-2020 Normals
|
Records
|
|||
| Maximum Temperature |
41°F
|
Warmest High Temperature |
67°F
|
February 2, 1915
|
| Coldest High Temperature |
11°F
|
February 2, 1971
|
||
| Minimum Temperature |
24°F
|
Warmest Low Temperature |
47°F
|
February 2, 1990
|
| Coldest Low Temperature |
-6°F
|
February 2, 1971
|
||
| Average Temperature |
32°F
|
Warmest Average Temperature |
56°F
|
February 2, 1989
|
| Coldest Average Temperature |
2.3°F
|
February 2, 1971
|
||
| Precipitation |
0.10"
|
Wettest |
1.20"
|
February 2, 1925
|
The odds of having any precipitation at all on Groundhog Day is 60.3% (82 out of 136). There has been measurable (0.01" or greater) precipitation on 57 Groundhog Days (41.9%) and trace amounts (less than 0.01") of precipitation on 25 Groundhog Days (18.4%).
The odds of having a maximum temperature at or below freezing (32°F) on Groundhog Day is 28.3% (39 out of 138), and the odds of having a minimum temperature at or below freezing is 76.1% (105 out of 138). The odds of having a minimum temperature at or below 0°F on Groundhog Day is 3.6% (5 out of 138).
In 2025, the high temperature was 52°F and the low temperature was 25°F. There was no precipitation recorded. The average wind speed was 5.9 mph, with a maximum speed of 13 mph from the southwest.
Zanesville, OH:
The following statistics comprises 128 years of data. From 1896 through July 1946, the data came from a cooperative observer in the Zanesville area with occasional periods of missing data. Since then, the data has come from the Zanesville Municipal Airport.
| Groundhog Day in Zanesville, OH (Period of Record 1887-2024) |
||||
|
1991-2020 Normals
|
Records
|
|||
| Maximum Temperature |
39°F
|
Warmest High Temperature |
65°F
|
February 2, 1903
|
| Coldest High Temperature |
8°F
|
February 2, 1951
|
||
| Minimum Temperature |
21°F
|
Warmest Low Temperature |
41°F
|
February 2, 1983
|
| Coldest Low Temperature |
-13°F
|
February 2, 1951
|
||
| Average Temperature |
30°F
|
Warmest Average Temperature |
49.3°F
|
February 2, 1988
|
| Coldest Average Temperature |
4.0°F
|
February 2, 1971
|
||
| Precipitation |
0.08"
|
Wettest |
1.22"
|
February 2, 1988
|
The odds of having any precipitation at all on Groundhog Day is 61.7% (79 out of 128). There has been measurable (0.01" or greater) precipitation on 56 Groundhog Days (43.8%) and trace amounts (less than 0.01") of precipitation on 23 Groundhog Days (18.0%).
The odds of having a maximum temperature at or below freezing (32°F) on Groundhog Day is 31.3% (40 out of 128), and the odds of having a minimum temperature at or below freezing is 79.7% (102 out of 128). The odds of having a minimum temperature at or below 0°F on Groundhog Day is 7.8% (10 out of 128).
In 2025, the high temperature was 46°F and the low temperature was 24°F. There was no precipitation recorded. The average wind speed was 4.7 mph, with a maximum wind speed of 13 mph out of the south.
Below are some weather events that took place on this day:

