
A slow moving front will be the focus area for heavy to excessive rainfall and a threat for flash/urban flooding across the northern Gulf Coast and Southeast U.S. through this weekend. Abnormally hot, potentially record-breaking, temperatures will impact southern California and stretch north toward the Bay Area and Central Valley into next week. Read More >
Climate data on this page is PRELIMINARY (unofficial). CERTIFIED (official) climate data is available from the National Climatic Data Center (NCDC).
Use the menus below to search based on year and location.
Click on the images below to enlarge.
|
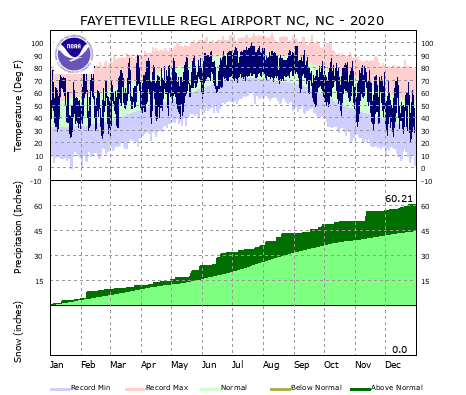
Year 2020 |
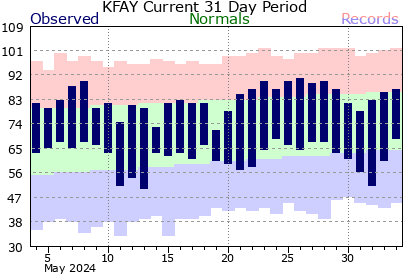
One year data to current |
 |
|
 |
||
 |
 |
 |
 |
 |
 |
 |
 |
 |
 |
 |
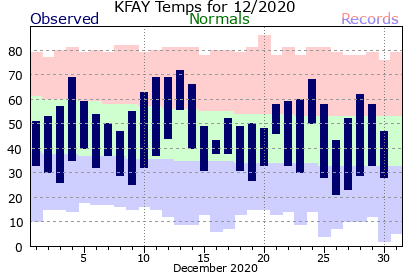 |
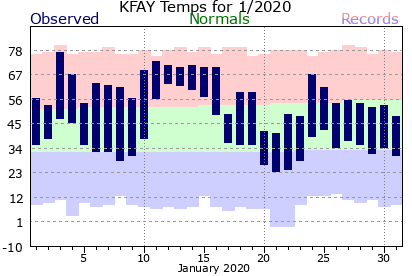
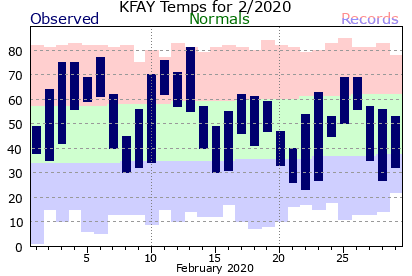
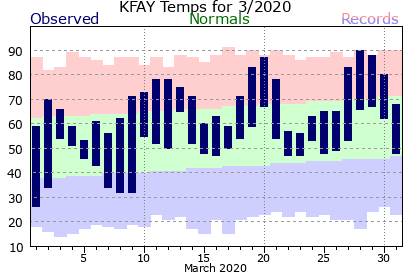
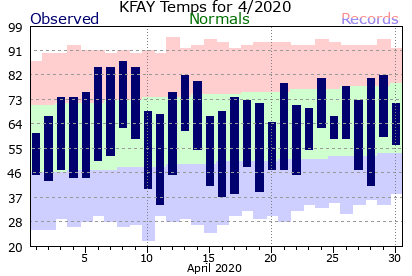
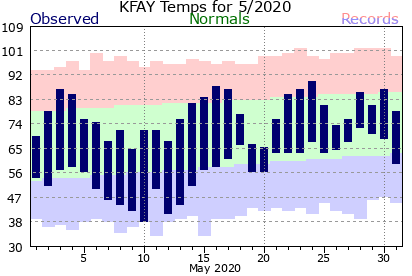
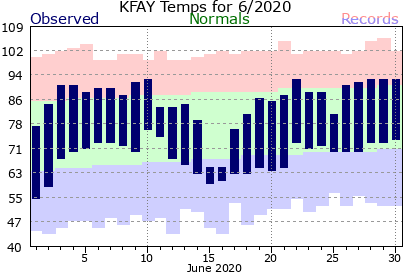
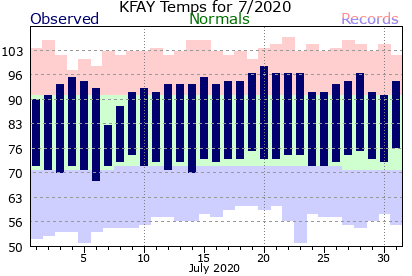
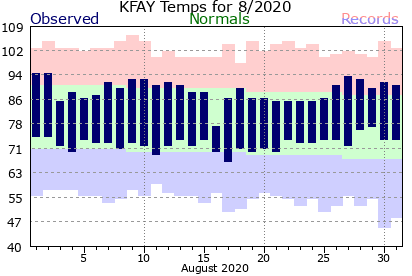
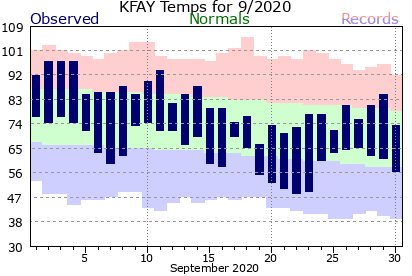
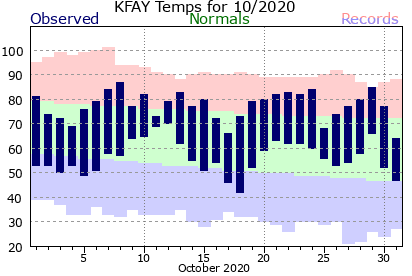
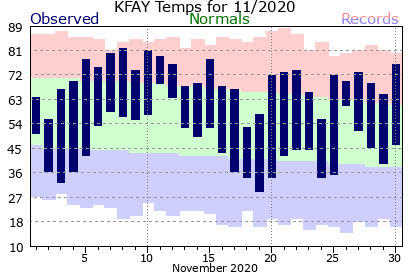
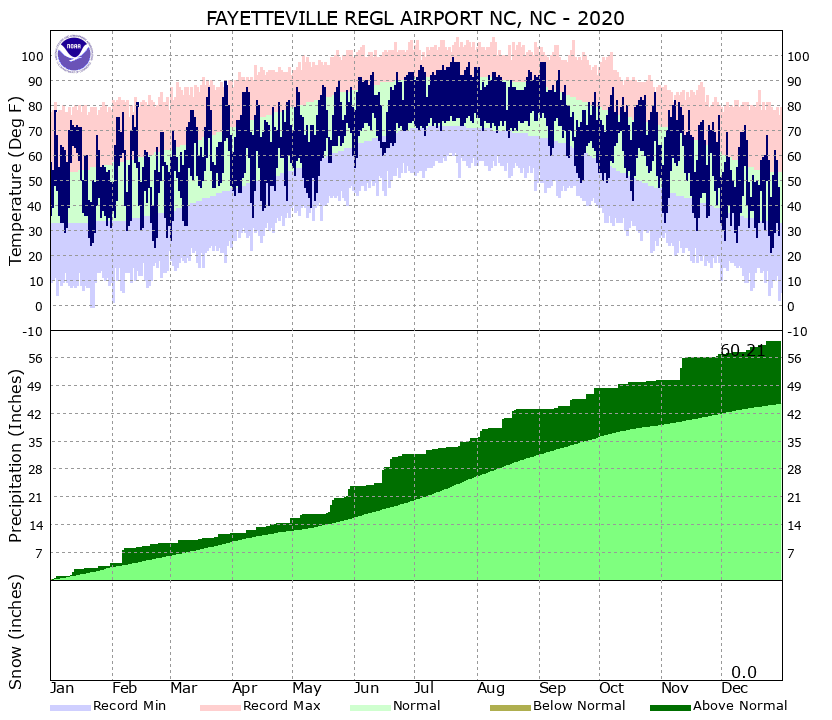
How to Read the Plots:This is an example of the monthly climate plot. The observed high and low temperatures are indicated by the tops and bottoms of the vertical blue bars, respectively. The normal temperature ranges are indicated by the green band. Record highs are shown on the top of the light pink band, and record lows are indicated along the bottom of the light blue band. |




 Radar
Radar Current Weather
 Rivers & Lakes
 Satellite
 Forecast Maps
 Hour by Hour Forecast
 Tropical Weather
 Graphical Hazards
 Climate Plots
 Fire Weather
 Heat Safety
 Drought Information
 Weather Hazard Briefing
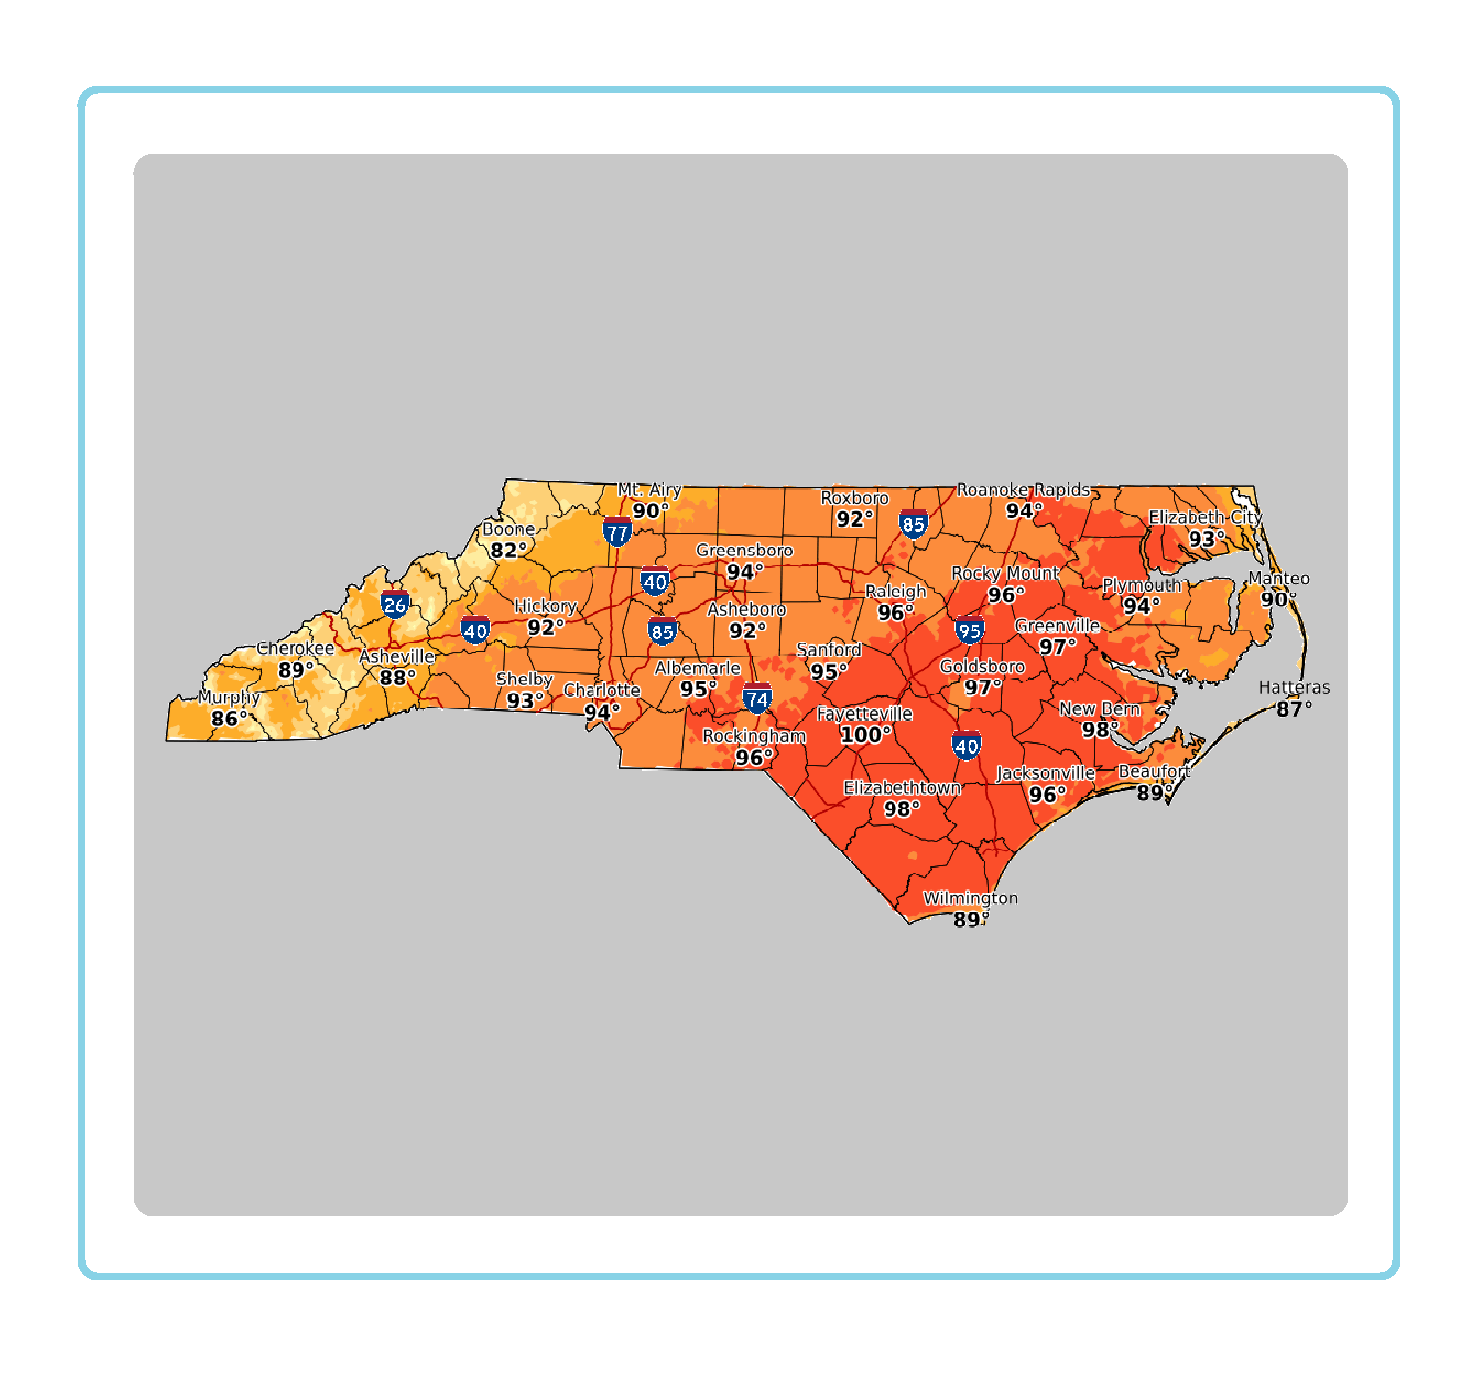 Statewide Maps
 Forecaster Discussion
 Text Bulletins
 SKYWARN
 Follow us on X
 Follow us on Facebook
 Follow us on YouTube
 RAH RSS Feed