Raleigh, NC
Weather Forecast Office
| Snow Amount Potential
Experimental - Leave feedback
|
|
| Expected Snowfall - Official NWS Forecast
What's this? |
High End Amount 1 in 10 Chance (10%) of Higher Snowfall What's this? |
| Low End Amount 9 in 10 Chance (90%) of Higher Snowfall What's this? |
|
Low End Amount – 9 in 10 Chance (90%) of Higher SnowfallThis map depicts a reasonable lower-end snowfall amount for the time period shown on the graphic, based on many computer model simulations of possible snowfall totals. This lower amount is an unlikely scenario with a 9 in 10, or 90% chance that more snow will fall, and only a 1 in 10, or 10% chance that less snow will fall. This number can help serve as a lower-end scenario for planning purposes. Expected Snowfall - Official NWS ForecastThis map is the official NWS snowfall forecast in inches during the time period shown on the graphic. This snowfall amount is determined by NWS forecasters to be the most likely outcome based on evaluation of data from computer models, satellite, radar, and other observations. High End Amount – Only a 1 in 10 Chance (10%) of Higher SnowfallThis map depicts a reasonable upper-end snowfall amount for the time period shown on the graphic, based on many computer model simulations of possible snowfall totals. This higher amount is an unlikely scenario, with only a 1 in 10, or 10% chance that more snow will fall, and a 9 in 10, or 90% chance that less snow will fall. This number can help serve as an upper-end scenario for planning purposes. |
|
| Percent Chance That Snow Amounts Will Be Greater Than...
Experimental - Leave feedback
What's this?
Percent Chance That Snow Amounts Will Be Greater ThanThis series of maps shows the probability (that is, the likelihood) that snowfall will equal or exceed specific amounts during the time period shown on the graphic. These forecasts are based on many computer model simulations of possible snowfall totals. |
||||||||||||||||
|
||||||||||||||||
| Snowfall Totals by Location
Experimental - Leave feedback
What's this?
Snowfall Totals by LocationThese tables show the snowfall forecast for individual locations, and provide the same information as the graphics on this web page, just shown in a different way. All of these values are valid for the same time period as depicted on the graphics. |
||||||||||||||
|
|
||||||||||||||
| Snow Amount Potential
Experimental - Leave feedback
|
|
| Expected Snowfall - Official NWS Forecast
What's this? |
High End Amount 1 in 10 Chance (10%) of Higher Snowfall What's this? |
| Low End Amount 9 in 10 Chance (90%) of Higher Snowfall What's this? |
|
Low End Amount – 9 in 10 Chance (90%) of Higher SnowfallThis map depicts a reasonable lower-end snowfall amount for the time period shown on the graphic, based on many computer model simulations of possible snowfall totals. This lower amount is an unlikely scenario with a 9 in 10, or 90% chance that more snow will fall, and only a 1 in 10, or 10% chance that less snow will fall. This number can help serve as a lower-end scenario for planning purposes. Expected Snowfall - Official NWS ForecastThis map is the official NWS snowfall forecast in inches during the time period shown on the graphic. This snowfall amount is determined by NWS forecasters to be the most likely outcome based on evaluation of data from computer models, satellite, radar, and other observations. High End Amount – Only a 1 in 10 Chance (10%) of Higher SnowfallThis map depicts a reasonable upper-end snowfall amount for the time period shown on the graphic, based on many computer model simulations of possible snowfall totals. This higher amount is an unlikely scenario, with only a 1 in 10, or 10% chance that more snow will fall, and a 9 in 10, or 90% chance that less snow will fall. This number can help serve as an upper-end scenario for planning purposes. |
|
| Percent Chance That Snow Amounts Will Be Greater Than...
Experimental - Leave feedback
What's this?
Percent Chance That Snow Amounts Will Be Greater ThanThis series of maps shows the probability (that is, the likelihood) that snowfall will equal or exceed specific amounts during the time period shown on the graphic. These forecasts are based on many computer model simulations of possible snowfall totals. |
||||||||||||||||
|
||||||||||||||||
| Ice Accumulation Potential
Experimental - Leave feedback
|
|
| Expected Ice Accumulation - Official NWS Forecast
What's this? This is the elevated flat surface ice accumulation. It is not radial/line ice. Radial/line ice is typically 39% of the elevated flat surface ice. For more information on this, see this module. |
High End Amount 1 in 10 Chance (10%) of Higher Ice Accumulation What's this? |
| Low End Amount 9 in 10 Chance (90%) of Higher Ice Accumulation What's this? |
|
Low End Amount – 9 in 10 Chance (90%) of Higher Ice AccumulationThis map depicts a reasonable lower-end ice accumulation amount for the time period shown on the graphic, based on many computer model simulations of possible ice accumulation totals. This lower amount is an unlikely scenario with a 9 in 10, or 90% chance that more snow will fall, and only a 1 in 10, or 10% chance that less snow will fall. This number can help serve as a lower-end scenario for planning purposes. Expected Ice Accumulation - Official NWS ForecastThis map is the official NWS ice accumulation forecast in inches during the time period shown on the graphic. This ice accumulation amount is determined by NWS forecasters to be the most likely outcome based on evaluation of data from computer models, satellite, radar, and other observations. High End Amount – Only a 1 in 10 Chance (10%) of Higher Ice AccumulationThis map depicts a reasonable upper-end ice accumulation amount for the time period shown on the graphic, based on many computer model simulations of possible ice accumulation totals. This higher amount is an unlikely scenario, with only a 1 in 10, or 10% chance that more snow will fall, and a 9 in 10, or 90% chance that less snow will fall. This number can help serve as an upper-end scenario for planning purposes. |
|
| Percent Chance That Ice Accumulation Will Be Greater Than...
Experimental - Leave feedback
What's this?
Percent Chance That Ice Accumulation Will Be Greater ThanThis series of maps shows the probability (that is, the likelihood) that ice accumulation will equal or exceed specific amounts during the time period shown on the graphic. These forecasts are based on many computer model simulations of possible snowfall totals. |
||||||||||||||||
|
||||||||||||||||
| Ice Accumulation by Location
Experimental - Leave feedback
What's this?
Ice Accumulation Totals by LocationThese tables show the ice accumulation forecast for individual locations, and provide the same information as the graphics on this web page, just shown in a different way. All of these values are valid for the same time period as depicted on the graphics. |
||||||||||||||
|
|
||||||||||||||
| Ice Accumulation Potential
Experimental - Leave feedback
|
|
| Expected Ice Accumulation - Official NWS Forecast
What's this? This is the elevated flat surface ice accumulation. It is not radial/line ice. Radial/line ice is typically 39% of the elevated flat surface ice. For more information on this, see this module. |
High End Amount 1 in 10 Chance (10%) of Higher Ice Accumulation What's this? |
| Low End Amount 9 in 10 Chance (90%) of Higher Ice Accumulation What's this? |
|
Low End Amount – 9 in 10 Chance (90%) of Higher Ice AccumulationThis map depicts a reasonable lower-end ice accumulation amount for the time period shown on the graphic, based on many computer model simulations of possible ice accumulation totals. This lower amount is an unlikely scenario with a 9 in 10, or 90% chance that more snow will fall, and only a 1 in 10, or 10% chance that less snow will fall. This number can help serve as a lower-end scenario for planning purposes. Expected Ice Accumulation - Official NWS ForecastThis map is the official NWS ice accumulation forecast in inches during the time period shown on the graphic. This ice accumulation amount is determined by NWS forecasters to be the most likely outcome based on evaluation of data from computer models, satellite, radar, and other observations. High End Amount – Only a 1 in 10 Chance (10%) of Higher Ice AccumulationThis map depicts a reasonable upper-end ice accumulation amount for the time period shown on the graphic, based on many computer model simulations of possible ice accumulation totals. This higher amount is an unlikely scenario, with only a 1 in 10, or 10% chance that more snow will fall, and a 9 in 10, or 90% chance that less snow will fall. This number can help serve as an upper-end scenario for planning purposes. |
|
| Percent Chance That Ice Accumulations Will Be Greater Than...
Experimental - Leave feedback
What's this?
Percent Chance That Ice Accumulations Will Be Greater ThanThis series of maps shows the probability (that is, the likelihood) that ice accumulation will equal or exceed specific amounts during the time period shown on the graphic. These forecasts are based on many computer model simulations of possible ice accumulation totals. |
||||||||||||||||
|
||||||||||||||||
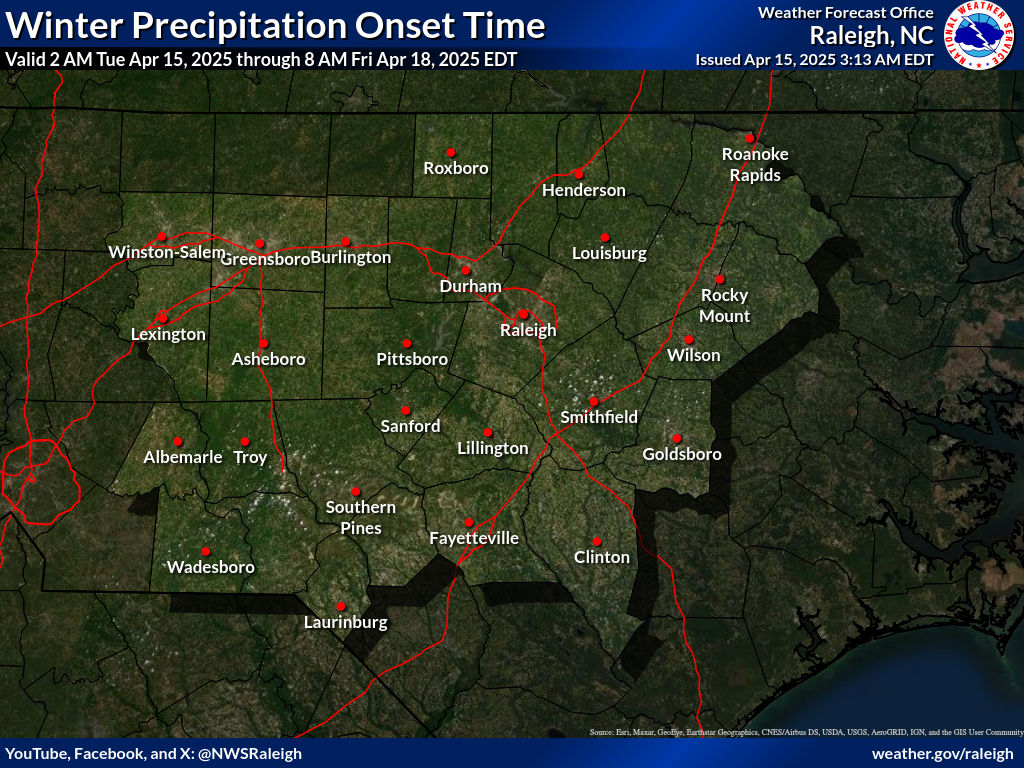
| Precipitation Onset/End Timing | ||
| Onset of Wintry Precipitation | End Timing of Wintry Precipitation | |
|---|---|---|
 |
 |
|
| What's this? | What's this? | |
Precipitation OnsetMost likely time of winter precipitation onset (snow, sleet, freezing rain). Rain is not included here. This information is provided when we issue a Warning or Advisory for expected snow or ice accumulation; typically six to 24 hours in advance. Times are only given for places that are under a Warning or Advisory. They will be blank in areas outside Warnings or Advisories. Precipitation End TimeMost likely time of winter precipitation ending (snow, sleet, freezing rain). Rain is not included here. This information is provided when we issue a Warning or Advisory for expected snow or ice accumulation; typically six to 24 hours in advance. Times are only given for places that are under a Warning or Advisory. They will be blank in areas outside Warnings or Advisories. |
||
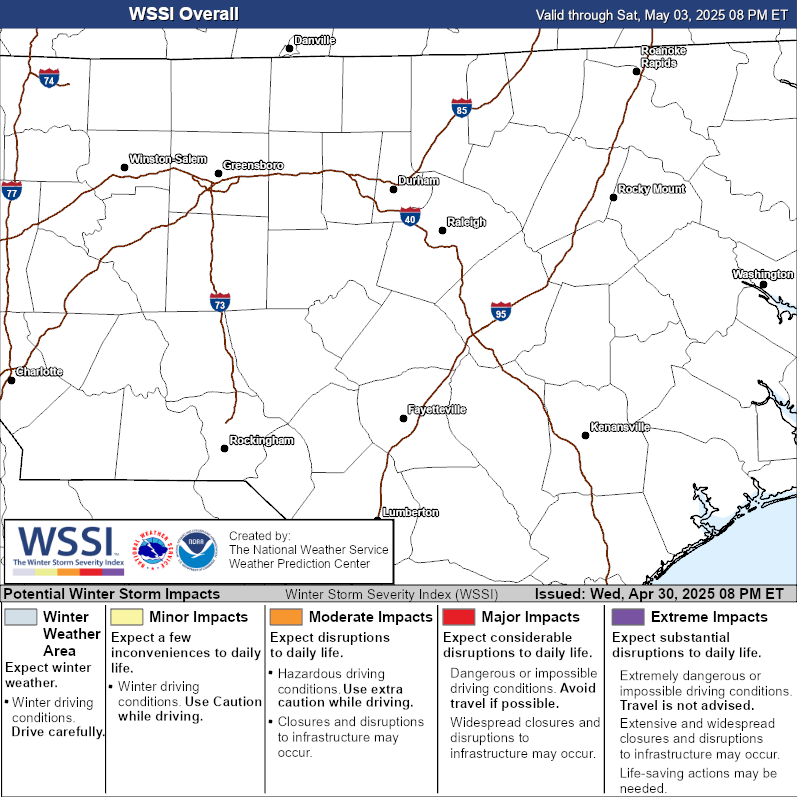
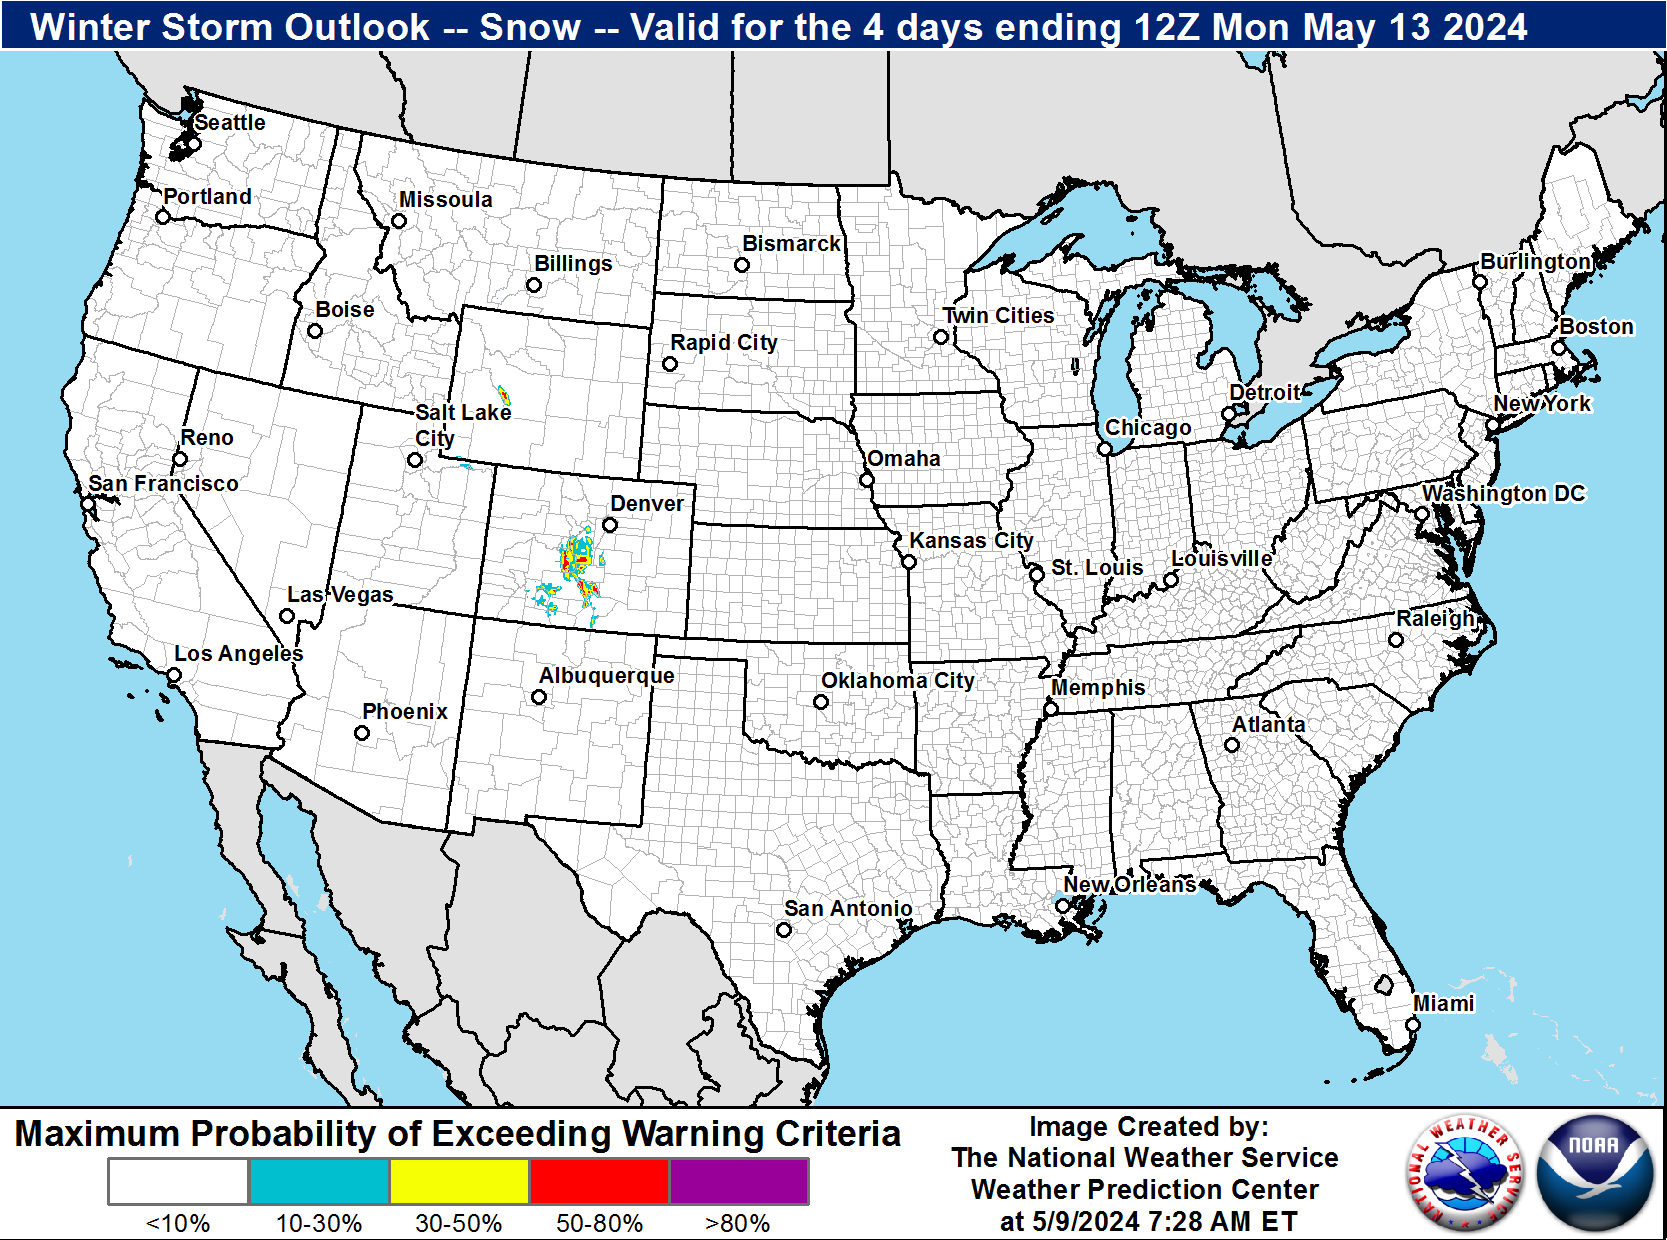
| Winter Storm Severity Index (WSSI) | Winter Storm Outlook (WSO) |
|---|---|
 |
 |
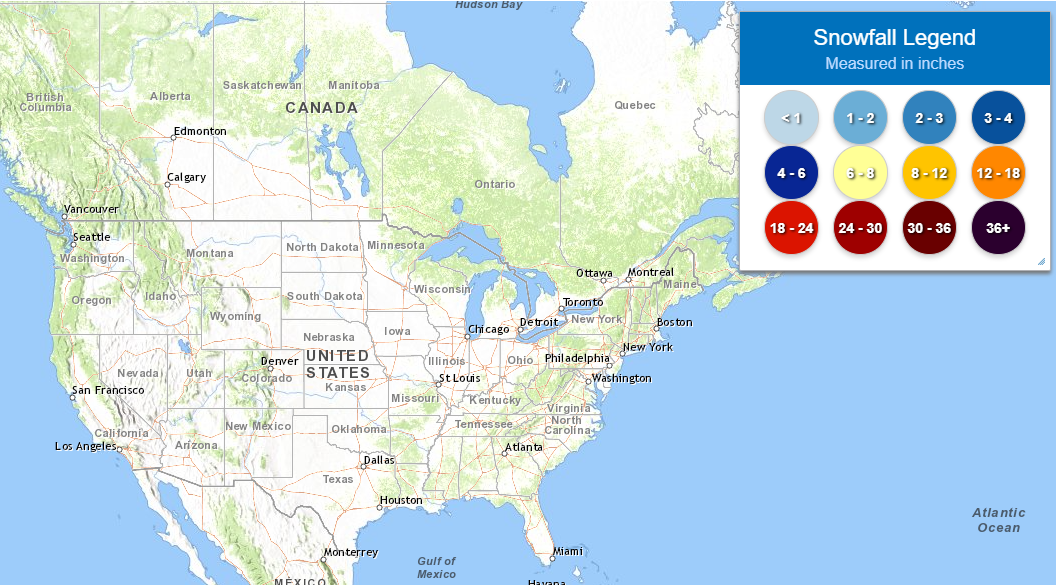
| Local Snow Reports | National Snowfall Analysis |
|---|---|
 |
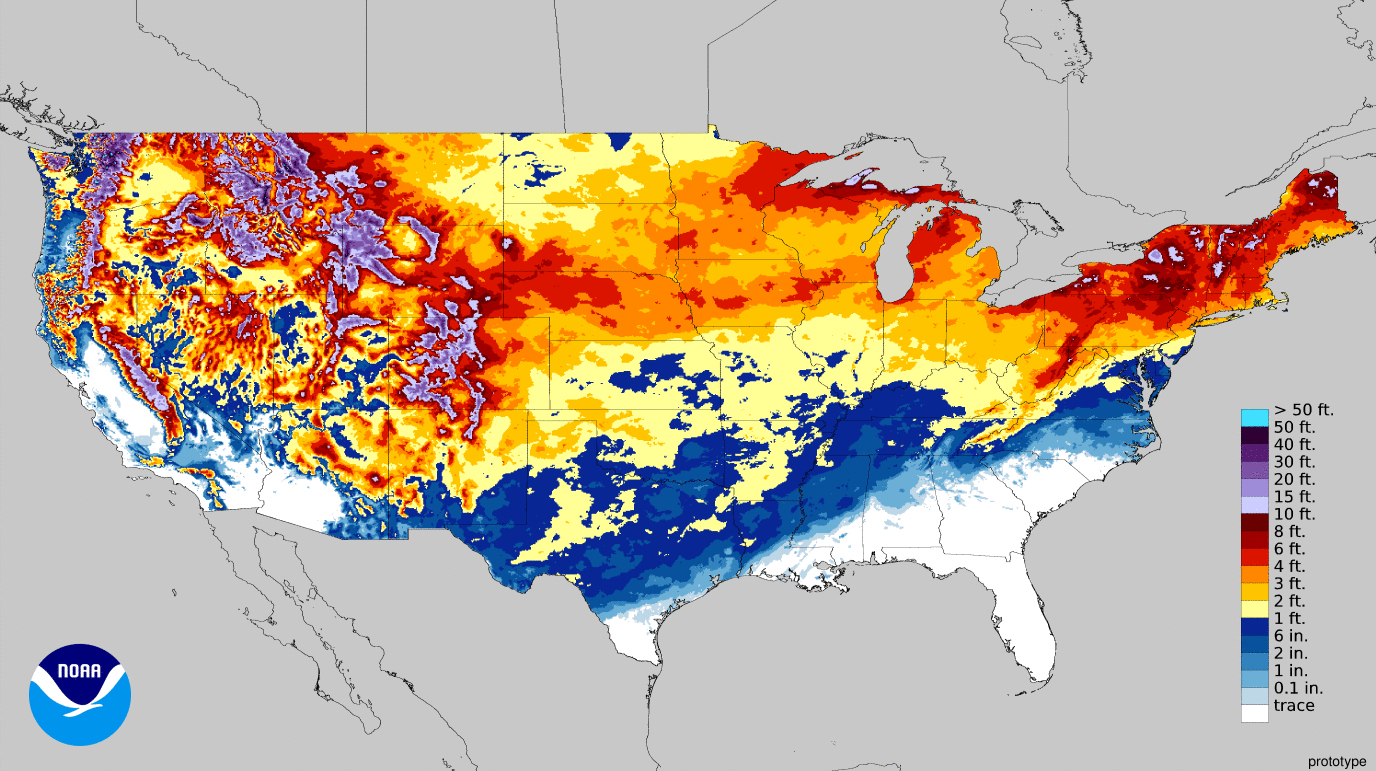 |
| Days 4-7 Winter Weather Outlook | |
| Day 4 Winter Weather Outlook | Day 5 Winter Weather Outlook |
 |
 |
| Day 6 Winter Weather Outlook | Day 7 Winter Weather Outlook |
 |
 |
|
|
|
| CPC Week-2 Experimental Heavy Snow Risk | |
 |
|
| CPC Temperature & Precipitation Maps | |
|
Days 6-10 |
|
| Temperature | Precipitation |
 |
 |
|
Days 8-14 |
|
| TEMPERATURE | PRECIPITATION |
 |
 |
|
Week 3-4 |
|
|
TEMPERATURE |
PRECIPITATION |
 |
 |
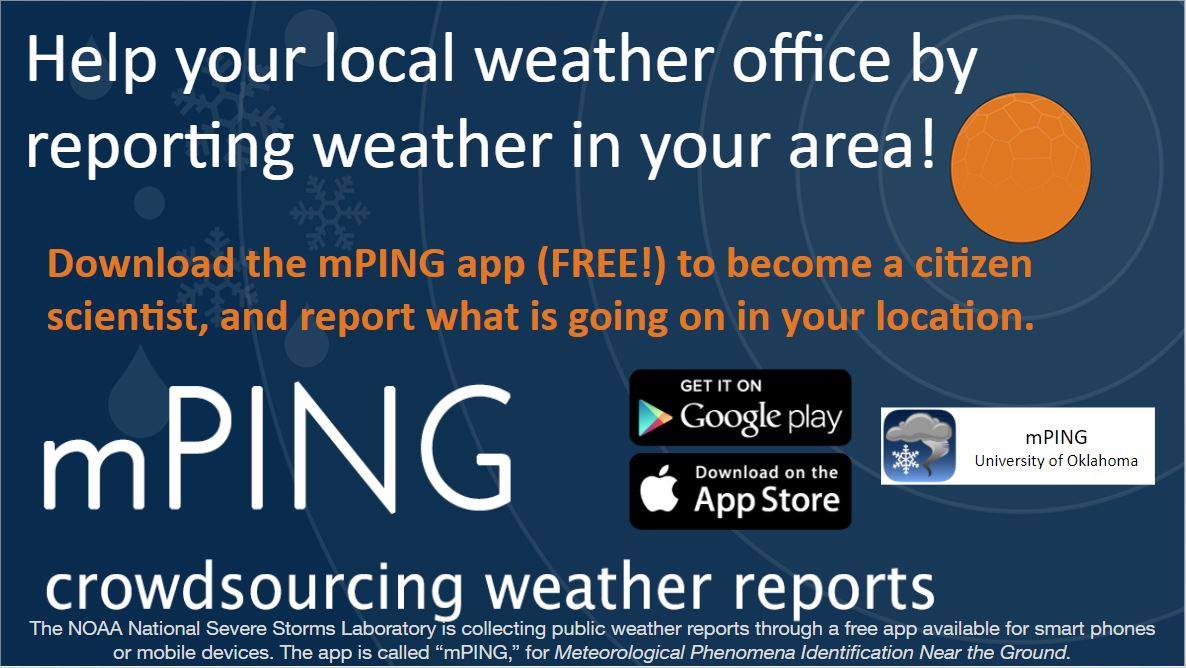
| Report Snow/Ice to the National Weather Service |
| REPORT SNOW/ICE AMOUNTS TO US | REPORT SNOW/ICE IMPACTS TO US |
|---|---|
 |
 |
|
What to include in your report: |
Send an email to: nws.raleigh@noaa.gov |
Use Social Media: We are always monitoring!
|
NOAA Weather Radio
More Info/ Outages
Local NWR Information
Past Weather Info
Tropical Cyclone Reports
Past Event Case Studies
Monthly Climate Summaries
Model Data
NCEP Models
Reflectivity Forecasts
MOS Data
TRENDs Nomogram
Bufkit Data
Weather Models Info (pdf)
US Dept of Commerce
National Oceanic and Atmospheric Administration
National Weather Service
Raleigh, NC
1005 Capability Drive, Suite 300
Centennial Campus
Raleigh, NC 27606-5226
(919) 326-1042
Comments? Questions? Please Contact Us.


 Heat Safety
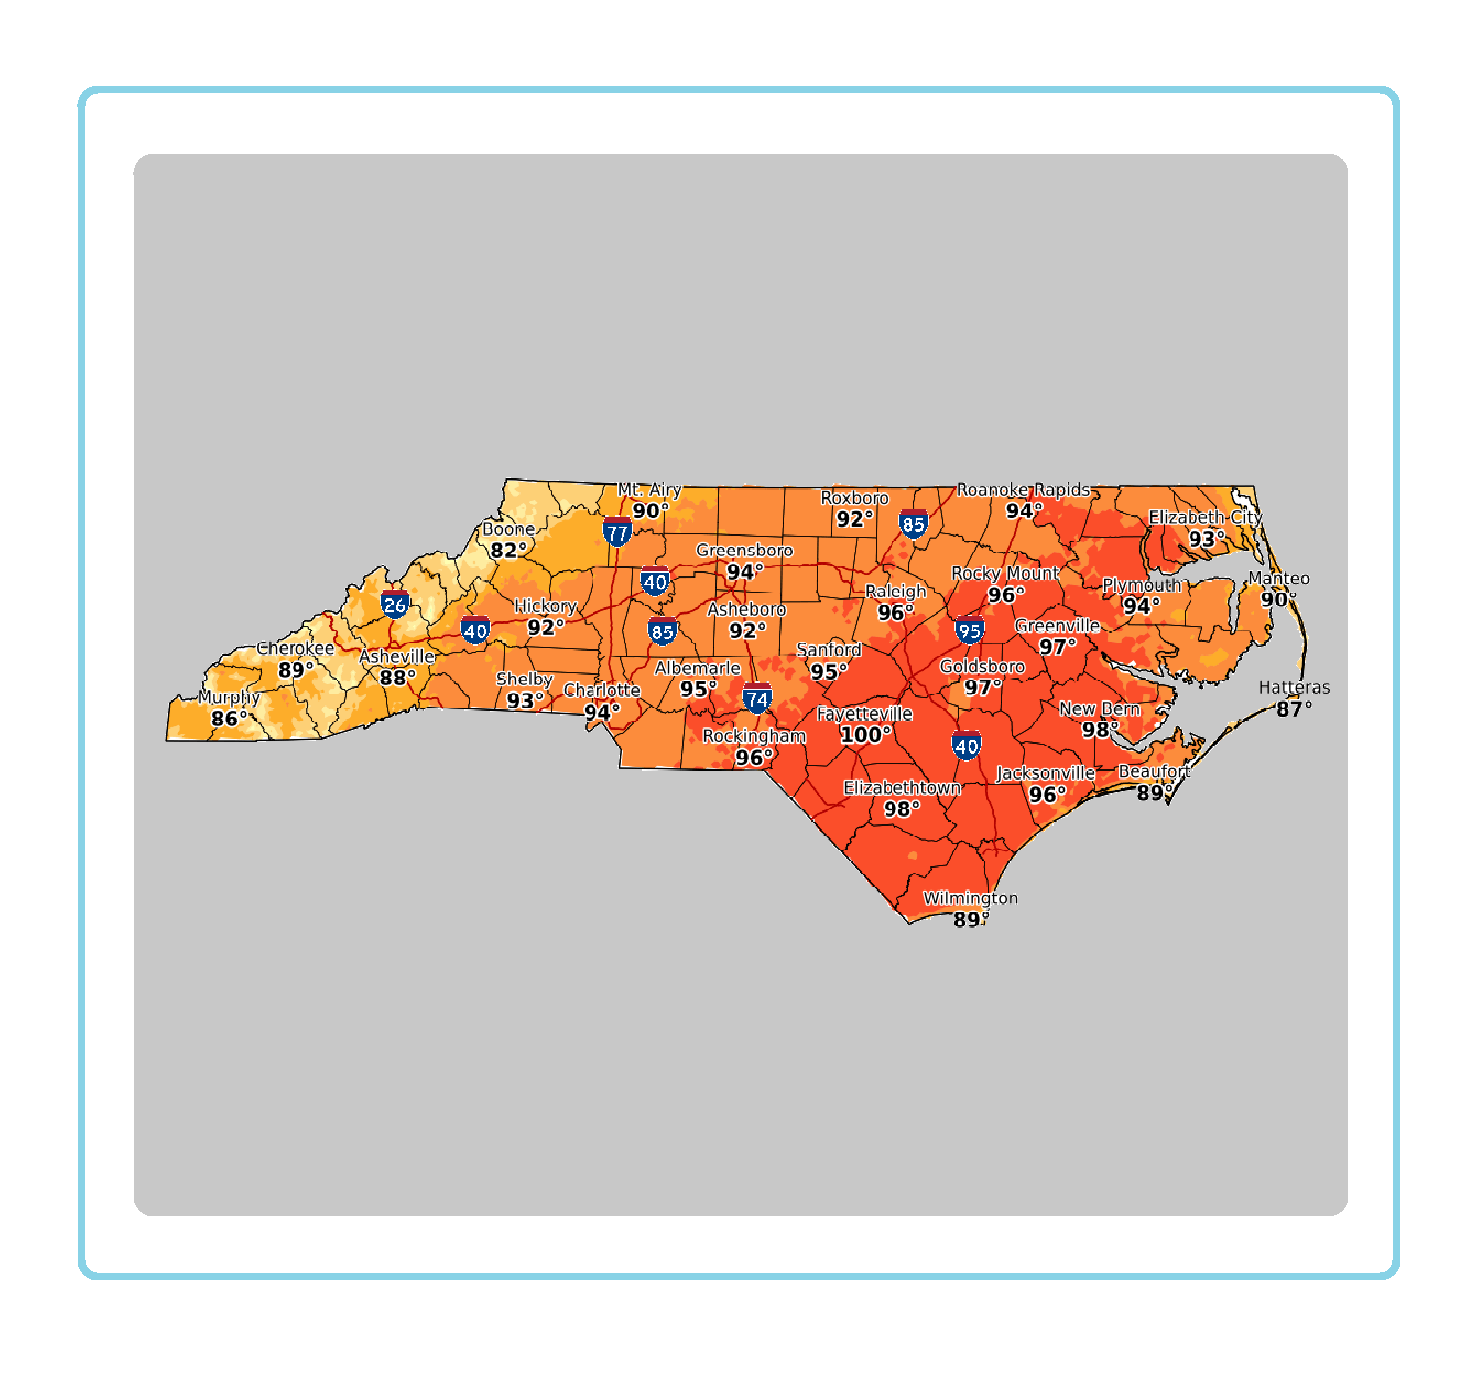 Statewide Maps
 Forecaster Discussion