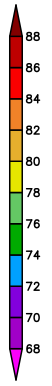
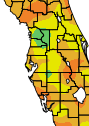
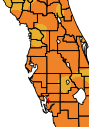
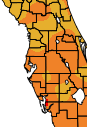
| Summer 2018 Temperature (°F) |
|
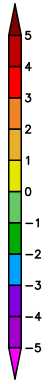
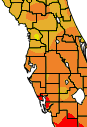
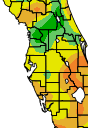
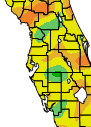
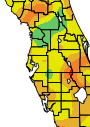
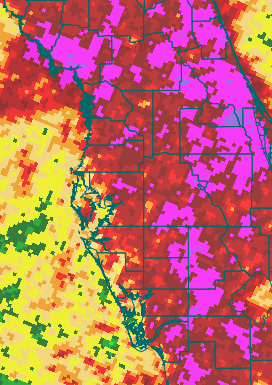
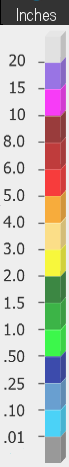
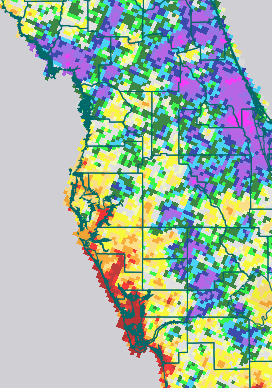
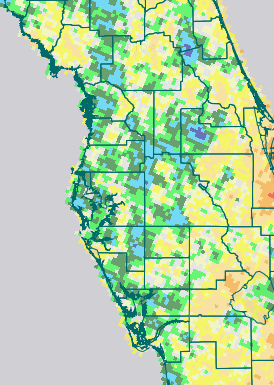
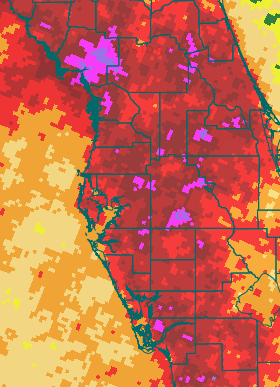
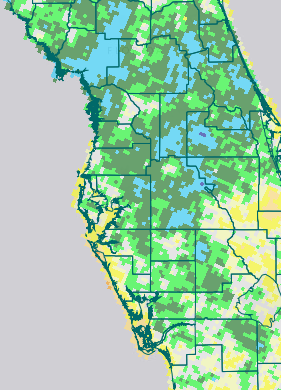
Summer 2018 Rainfall (inches) |
| Site |
Average |
Normal |
DFN |
Ranking |
|
Site |
Total |
Normal |
DFN |
Ranking |
| Arcadia |
81.5 |
81.2 |
+0.3 |
Tied 26th Warmest / 72nd Coolest |
|
Arcadia |
24.27 |
24.80 |
-0.53 |
54th Wettest / 53rd Driest |
| Archbold |
81.6 |
80.3 |
+1.3 |
Tied 7th Warmest |
|
Archbold |
25.33 |
24.71 |
+0.62 |
19th Wettest |
| Bartow |
82.4 |
82.6 |
-0.2 |
Tied 28th Warmest / 88th Coolest |
|
Bartow |
26.97 |
24.24 |
+2.73 |
19th Wettest |
| Brooksville |
81.5 |
80.6 |
+0.9 |
Tied 22nd Warmest |
|
Brooksville |
24.46 |
23.41 |
+1.05 |
65th Wettest / 60th Driest |
| Chiefland 5 ESE |
82.0 |
79.7 |
+2.3 |
4th Warmest |
|
Chiefland 5 ESE |
34.90 |
25.75 |
+9.15 |
4th Wettest |
| Fort Myers |
*83.0 |
83.0 |
0.0 |
Tied 26th Warmest |
|
Fort Myers |
26.59 |
29.27 |
-2.68 |
59th Wettest / 56th Driest |
| Inverness 3 SE |
80.1 |
81.1 |
-1.0 |
6th Coolest |
|
Inverness 3 SE |
24.07 |
23.59 |
+0.48 |
28th Wettest / 38th Driest |
| Lakeland |
83.3 |
81.7 |
+1.6 |
Tied 10th Warmest |
|
Lakeland |
30.85 |
24.01 |
+6.84 |
12th Wettest |
| Myakka Rvr St Pk |
83.2 |
81.8 |
+1.4 |
Tied 6th Warmest |
|
Myakka Rvr St Pk |
33.33 |
28.96 |
+4.37 |
19th Wettest |
| Plant City |
84.1 |
81.4 |
+2.7 |
2nd Warmest |
|
Plant City |
30.56 |
24.54 |
+6.02 |
25th Wettest |
| Punta Gorda |
84.0 |
82.5 |
+1.5 |
Warmest |
|
Punta Gorda |
28.42 |
25.03 |
+3.39 |
22nd Wettest |
| Sarasota-Bradenton |
82.6 |
81.8 |
+0.8 |
12th Warmest |
|
Sarasota-Bradenton |
16.86 |
24.63 |
-7.77 |
21st Driest |
| St. Leo |
81.1 |
82.3 |
-1.2 |
Tied 66th Warmest / 52nd Coolest |
|
St. Leo |
28.98 |
23.52 |
+5.46 |
28th Wettest / 97th Driest |
| St. Petersburg |
84.0 |
83.5 |
+0.5 |
Tied 16th Warmest |
|
St. Petersburg |
20.33 |
22.10 |
-1.77 |
61st Wettest / 43rd Driest |
| Tampa |
83.9 |
82.8 |
+1.1 |
Tied 4th Warmest |
|
Tampa |
23.59 |
21.52 |
+2.07 |
46th Wettest / 84th Driest |
| Tarpon Springs |
83.5 |
81.7 |
+1.8 |
Tied 9th Warmest |
|
Tarpon Springs |
25.28 |
23.10 |
+2.18 |
43rd Wettest / 83rd Driest |
| Venice |
83.2 |
82.0 |
+1.2 |
9th Warmest |
|
Venice |
15.19 |
22.60 |
-7.41 |
17th Driest |
| Wauchula 2 N |
82.0 |
83.0 |
-1.0 |
Tied 20th Warmest |
|
Wauchula 2 N |
16.30 |
23.81 |
-7.51 |
9th Driest |
| Winter Haven |
83.3 |
82.7 |
+0.6 |
Tied 5th Warmest |
|
Winter Haven |
24.48 |
23.07 |
+1.41 |
19th Wettest |
| |
|
|
|
|
|
|
|
|
|
|