|
2017 was one of the warmest years in history across the eastern Carolinas with temperatures averaging two degrees above normal. There was no extreme summer heat; instead far-above normal temperatures in January, February and April, supplemented by near to above-normal temperatures the remainder of the year, was enough to push 2017's average annual temperature to the second warmest on record in Wilmington, and the eighth warmest in Florence. Aside from a single late-season storm in March that dropped an inch of snow in spots, no significant winter weather occurred in 2017. There were no direct strikes from tropical systems, but the area was affected in September by strong winds and coastal flooding as Hurricane Irma's circulation over Florida and Georgia butted up against high pressure off the East Coast. |
|
Combined snow and sleet accumulations from the winter storm of January 7, 2017. Only small accumulations occurred across our portion of the Carolinas. |
JANUARY: The new year began mild, but a strong cold front January 6th brought an arctic airmass into the Carolinas. Low pressure developed along the front offshore and produced rain which mixed with ice and snow as the precipitation ended on January 7th. Officially only a trace of snow was recorded in Wilmington, with traces of snow, sleet, and freezing rain reported across Lumberton, Elizabethtown, Florence, and Darlington. As much as 2 inches of snow was reported from near Greenville in Pitt County, NC, with snowfall totals reaching over eight inches in southern Virginia and northwestern North Carolina.
The coldest temperatures of the entire year occurred on the mornings of January 8th and 9th when most locations fell into the upper teens. Some of the coldest readings included 16 degrees in both Lumberton and Wilmington, 18 in Florence, and 19 at North Myrtle Beach. This cold, arctic air also was significant for its extremely high barometric pressure; the sea level pressure reached 1044.5 millibars (30.84 in. Hg) in Wilmington, the highest pressure reading in nearly 10 years.
Most of the remainder of January featured well-above normal temperatures which pushed January's temperatures 5 to 7 degrees above normal. Florence, SC recorded 11 days in January with temperatures 70 degrees or warmer.
FEBRUARY: Unusually warm temperatures continued through February. By the end of the month, observed temperatures were 6 to 9 degrees above normal, making this the warmest February since 1990 in Wilmington, and since 1976 in Florence. February was consistently dry with only two rainfall events all month: the 8th-9th and the 15th. Thunderstorms on February 15th became severe and produced an EF1 tornado near Adrian, South Carolina. A second EF1 tornado touched down just west of Longwood, NC in the Scippio Swamp cutting a 3-mile long path through the trees and damaging several structures. No injuries were reported with either tornado.
|
Severe damage to a home near Adrian, SC from the EF1 tornado of February 15, 2017. Damage from this tornado totaled nearly $1 million. |
Debris and damaged trees from the Adrian, SC tornado of February 15, 2017. A storm survey revealed a damage path almost 5 miles long. |
 Due to unusually warm temperatures observed throughout January and February, trees and plants began to come out of their winter dormancy well ahead of schedule. Data from the U.S. National Phenology Network (displayed at left) showed plants were leafing out up to 20 days earlier than normal across parts of the southern United States. This early start turned out to be very bad news for farmers in the Carolinas and Georgia less than one month later...
This was the seventh warmest February in history in Wilmington, and the second warmest in history in Florence, SC and Lumberton, NC. Temperatures in Florence reached 80 degrees three times this month, and in Lumberton reached 80 four times!
MARCH: The first day of March featured highs in the upper 70s and lower 80s -- a continuation of the unseasonable warmth experienced throughout February. However a cold front early on March 2nd brought below normal temperatures and several nights with freezing temperatures March 3rd through 6th. Temperatures cooled further behind another cold front on March 11th. Rain developed behind this front on the 12th, and precipitation changed over to snow across most of North Carolina with 1.5 inches measured in Lumberton, NC; 1.2 inches in Latta, SC, 1.0 inch in Whiteville, NC; and 0.4" in Carolina Beach, NC. Officially at the Wilmington airport 1.1 inches of snow fell, the first time measurable snow had fallen in the Port City in March since 1983.
|
A Ruby-throated Hummingbird was still able to feed on this snow-covered feeder in Wilmington on March 12, 2017. Some hummingbirds routinely spend the winter along the Carolina coast, but rarely deal with snow. |
Winter was juxtaposed with spring in this photo from Wilmington of daffodils covered in snow on March 12, 2017. |
Snowfall totals across North and South Carolina from March 12, 2017. Data is from NWS cooperative observers, airports, and CoCoRaHS volunteer observers. |
Several days after the snow event, an even-colder arctic front moved through. Nighttime low temperatures fell deep into the 20s from March 15th through 17th, ultimately reaching 27 degrees in North Myrtle Beach, SC; 25 in Wilmington, NC; 23 in Lumberton, NC; and 20 in Florence and Hartsville, SC. A freeze in mid-March isn't all that unusual in itself, however given the warmth experienced throughout January and February this freeze had significant agricultural impacts to blueberries and peaches. Damage was worst across South Carolina where some estimates placed losses to the state's peach crop near 90 percent. The last freeze of the 2016-2017 winter occurred on March 17th in Florence, SC.
A cold front and strong upper level disturbance moved through the area during the evening of March 18th. Showers and thunderstorms developed, including one well-defined supercell thunderstorm which produced a 54 mph wind gust in Lumberton, damage to a mobile home near Maxton, and 1" diameter hail in Elizabethtown, NC. This supercell (shown in a radar and satellite animation at left) persisted for several hours as it moved across Southeastern North Carolina.
The final freeze of the season occurred on March 20th in North Myrtle Beach, SC; and Wilmington and Lumberton, NC. The net effect of all these cold fronts was that temperatures in March actually averaged cooler than temperatures in February. This is actually quite rare and hadn't happened in Wilmington since 1962 and in Florence since 1960.
APRIL: Except for a single cool spell April 7th-10th, temperatures rebounded back to much above normal levels in April, resuming the weather pattern experienced during January and February. Temperatures ran 4.0 to 5.5 degrees above normal during the month. This was the warmest April ever recorded in Wilmington, the second warmest on record in Lumberton, and the third warmest in Florence, SC's climate record. There were only a handful of widespread precipitation events in April; the first occurred on April 5th when several waves of thunderstorms ahead of a cold front brought severe weather to the area. Large hail occurred across coastal Brunswick County, NC including 1" diameter hail in Ocean Isle Beach, 1.5" hail near Holden Beach, 1.75" hail in Saint James, and 2" hail near Sunset Harbor. Lightning also struck and damaged a home in Calabash, NC. Behind the cold front on April 6th wind gusts were reported as high as 50 mph in Kure Beach, NC; 51 mph in Surfside Beach, SC; and 53 mph at Lumberton, NC.
The middle of April was particularly warm with inland temperatures reaching 80 degrees almost every day from the 11th through the 22nd. A front stalled across the area on April 23rd and 24th leading to widespread heavy rainfall and flash flooding. Flood reports began arriving during the morning of April 24th from Andrews, SC. Heavy rain then led to flash flooding in Wilmington and Hampstead, NC during the afternoon hours. Daily rainfall totals reached 3.67" at the Wilmington, NC airport, 6.90" in the Cross Creek neighborhood near Hampstead, NC, and an amazing 8.04" in Rocky Point, NC.
|
Damage to a mobile home and a shed in Parkton, NC from an EF1 tornado on May 23, 2017. Photo credit: Robeson County Emergency Management |
MAY: Above-normal temperatures continued into May, bringing the first 90-degree readings of the year in Lumberton on May 10th, Wilmington and North Myrtle Beach on May 11th, and Florence on May 15th. For the month temperatures averaged one to three degrees above normal, making this the 12th warmest May in history in Wilmington.
May is often one of our most active months for severe weather, and this one was no exception. Strong wind shear created by low pressure to our northwest helped develop severe thunderstorms on May 4th, including a pair of EF1 tornadoes that struck Oates and Hartsville, SC. A long period of uneventful weather occurred during mid-May, but on May 23rd waves of low pressure developed along a front stalled near the eastern Carolinas. This caused widespread thunderstorms to develop and become severe near Parkton, NC where an EF1 tornado occurred with 75 mph wind speeds. More severe thunderstorms on May 25th produced multiple reports of large hail and damaging winds. Wind gusts were recorded at 53 mph in Southport and 59 mph at Kure Beach. More severe thunderstorms on May 28 knocked trees down near Tabor City, NC and Garden City, SC, and on May 29th large hail fell in Lake City, SC.
JUNE: There were two periods of unusually cool temperatures this month. The first of these cool periods occurred June 7th through the 10th and featured the coolest June temperatures in over 12 years; the high temperature on June 8th in Wilmington was only 68 degrees, 18 degrees below normal! After more-typical June heat developed during the middle of the month, temperatures again plunged well below normal from June 28th into early July. In Wilmington and Florence highs only reached the 90s four and eight times, respectively, this month, about half of the normal tally. North Myrtle Beach only had a single day in the 90s this month, the fewest in June since 2001.
Severe thunderstorms developed during the afternoon of June 3rd causing significant roof damage to two structures in Hemingway, SC. Several waves of severe thunderstorms developed on June 15th, producing damaging wind gusts and dropping hail up to 1.25" in diameter in Georgetown, SC.
As a weak warm front traversed the area on June 30th, slow-moving thunderstorms continuously redeveloped across Wilmington for several hours from late morning through mid-afternoon. Rainfall totals included 3.07" in Belville, NC; 4.56" in Castle Hayne, NC; and 6.62" at the Wilmington airport, the 15th wettest day in Wilmington's history dating back to 1874.
|
JULY: Typical summer heat occurred the first half of July with daily highs mainly in the 90s. The hottest temperatures of the year along the coast occurred July 7th when Wilmington and North Myrtle Beach both reached 97 degrees. This heat helped spawn strong to severe thunderstorms on a number of dates. On July 5th thunderstorm winds destroyed a shed and a barn west of Conway, SC, and several trees and a barn roof were damaged near Long Creek in Pender County, NC on July 8th. Flash Flooding developed on July 9th and affected Tabor City, NC and Green Sea, SC. At one point Green Sea Rd. was covered with 18 inches of running water.
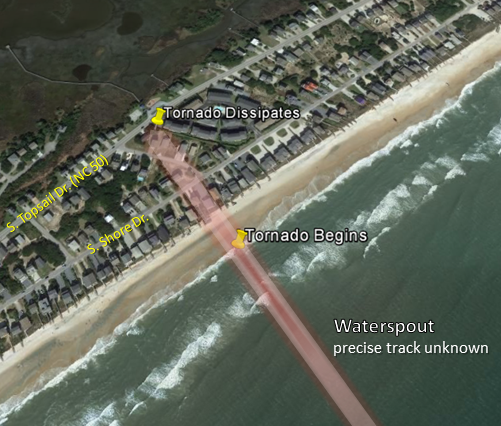
During the morning of July 19th, a waterspout developed within a cluster of thunderstorms off the Pender County, NC coast. This waterspout moved onshore in the town of Surf city at 11:23 AM, becoming a short-lived tornado. Three homes suffered damage to their roofs, a wooden fence was damaged, and outdoor patio furniture was scattered by the tornado's winds. A number of people captured pictures and video of the tornado, including video by Andrew Kirsch shared to the right.
An unusually strong cold front brought cool temperatures in for the last few days of July. Low temperatures in both Lumberton and Moore's Creek, NC reached 57 degrees on July 31st. In North Myrtle Beach the morning low on July 31st was 59 degrees, the first time since 1952 that temperatures in July had fallen below 60 degrees along South Carolina's Grand Strand.
This cool weather capped off a rather cool month overall. In fact, 2017 was the first year since 2003 that no weather station across our portion of the eastern Carolinas reached 100 degrees at any point in the year.
AUGUST: A front stalled across the area on August 8th leading to the development of slow-moving thunderstorms. Rainfall amounts became excessive in spots with 3.21 inches reported at North Myrtle Beach, SC; 4.67 inches at Monkey Junction in Wilmington, NC; and 6.04 inches near Belville, NC. However the biggest weather and nature event of the month was the long-awaited "Great American Eclipse." This total solar eclipse occurred on August 21st and completely blotted out the sun in a stripe across the Carolinas extending from Cherokee, NC across Greenville, Columbia, and Charleston, SC. This was a 99 percent eclipse in Florence and Myrtle Beach, SC; and 96 to 97 percent in Wilmington and Lumberton, NC. Air temperatures fell during the eclipse as the sun's light and heat were blocked by the moon. Temperature drops averaged 4 to 7 degrees, but in some spots were as large as 11 degrees.
|
Full-disk GOES-16 weather satellite imagery showing the shadow of the August 21, 2017 eclipse passing across the United States. This loop runs from 12:30 PM EDT until 4:15 PM EDT. Courtesy of Colorado State University's Cooperative Institute for Research in the Atmosphere (CIRA) |
Minute-by-minute air temperature data collected from the Lumberton, NC airport shows a 7 degree dip during the Great American Eclipse of August 21, 2017. Temperature decreases up to 9 degrees Fahrenheit were measured in Greenville, SC, and 11 degrees in Newberry, SC. |
The hottest period of August actually occurred in the week around the eclipse. Temperatures reached the lower to middle 90s each day from August 15th through the 23rd. The 23rd was the hottest day inland and included temperatures of 96 degrees in Florence, SC; and 97 in Hartsville, SC and Elizabethtown, NC. Severe thunderstorms later that same day associated with a cold front blew down trees in Fairmont and Whiteville, NC, and in Mullins and Dillon, SC.
Severe t-storms loosely associated with the remnants of Tropical Storm Harvey overturned a mobile home in Hartsville, SC on August 31st, injuring two. As the same thunderstorm cell moved across the city of Darlington, an NWS employee estimated wind speeds reached 60 mph.
SEPTEMBER: Hurricane Irma was a category five hurricane that affected much of the northern Caribbean from the Leeward Islands to Puerto Rico and Cuba from September 4th through the 9th. At one point Irma's maximum sustained winds reached 185 mph. Irma made two U.S. landfalls in Florida as a major hurricane on September 10th, then weakened as it turned north along the Florida west coast and moved into southwestern Georgia. Although Irma's center remained over 350 miles away from the eastern Carolinas, a large area of strong easterly winds developed between Irma and high pressure off the East Coast. Wind gusts on September 11th reached 61 mph in Georgetown, SC; 54 mph at the Myrtle Beach airport; 47 mph in Kure Beach, NC; 45 mph in Florence, SC; and 40 mph in Wilmington, NC. Weather buoys measured 10 to 15 foot wave heights just offshore.
Coastal flooding produced by the strong onshore wind was generally minor across southeastern North Carolina, but was more significant along the South Carolina coast where sand dunes were still damaged from Hurricane Matthew the previous year. Officials in Pawley's Island, SC reported sand-covered roadways, significant beach erosion, and a few flooded homes after the storm. Many streets were flooded at high tide in Garden City Beach and in Georgetown, SC. Irma's storm total rainfall was 1.92" in Wilmington and 2.52" in Florence, but maximum rainfall totals of 4 to 5 inches were reported in a number of locations from Pawley's Island to Calabash and Southport, NC. The Myrtle Beach Sun-News has a good summary of Irma's impacts along the Grand Strand.
It's an hour from high tide and water is pouring in from Garden City Beach pic.twitter.com/MMOIMvP9Bf
— Madeline Montgomery (@MadelineWPDE) September 11, 2017
"It's an hour from high tide and water is pouring in from Garden City Beach." Posted on Twitter by WPDE reporter Madeline Montgomery
Hurricane Irma: September 11, 2017 Strong winds and large waves at Wrightsville Beach, NC on September 11, 2017 |
There was very little beach left on Wrightsville Beach, NC near high tide on September 11, 2017 |
Two more powerful hurricanes, Jose and Maria, moved through the western Atlantic in September. These storms remained far enough offshore for no direct weather impacts locally, but large ocean swells created excellent surfing conditions as well as dangerous rip currents. The Frying Pan Shoals buoy reported 9.6 foot waves every 14 seconds on September 17th-18th associated with Hurricane Jose. Maria brought more large waves to the beaches September 26th-28th. Sinking air around the periphery of Maria produced some of the last 90 degree temperatures of the year including 94 degrees in Wilmington, 93 in Florence, and 96 in Whiteville.
OCTOBER: In contrast to September, October was relatively dry and uneventful. Temperatures averaged 2 to 3 degrees above normal, including a period of heat during the second week of October that produced widespread highs in the upper 80s. Temperatures even touched 90 degrees on October 11th in Hartsville and Cades, SC. A strong cold front on October 23rd brought thunderstorms which produced a brief tornado in a rural area east of Conway, SC, damaging trees and an outbuilding near the Waccamaw River. Heavy rainfall also occurred including 1.70 inches measured at North Myrtle Beach and 2.24 inches in Loris, SC.
NOVEMBER: November was a very dry month with rainfall amounts only one-quarter to one-half of normal. Temperatures averaged slightly below normal as Canadian air covered the Carolinas for all but the first week of the month. The first freezing temperatures of the season occurred during the middle of November as several waves of cold air pushed in from the north. A widespread freeze on November 20th ended the growing season for virtually all of eastern North and South Carolina.
| 2017 Last Spring Freeze | 2017 First Fall Freeze | 2017 Growing Season Length | Anomaly | |
| Wilmington | March 20 | November 20 | 235 days | -7 |
| Lumberton | March 20 | November 11 | 235 days | +23 |
| Florence | March 17 | November 20 | 247 days | +15 |
| Myrtle Beach | March 20 | November 20 | 244 days | +0 |
DECEMBER: This month began mild, but a front stalled off the coast on December 5th leading to four straight days of clouds, chilly temperatures, and rain. Rain was only heavy on one day (December 8th) when as much as 2.62 inches fell in Florence and 2.66 inches in Lumberton. For the western Carolinas this became a snowstorm with 10 inches measured in Asheville, NC and 2 inches in Greenville, SC. Ten days of dry weather during the middle of December ended with a soaking rain from December 20th through 22nd that measured nearly two inches in Yaupon Beach and Southport, NC.
Arctic air built across the eastern U.S. after Christmas. A weak wave of low pressure off the coast produced a very light freezing rain event on December 29th along the coast of South Carolina up through the tip of Cape Fear. Emergency Management in Georgetown County, SC reported several vehicle accidents due to ice on the Wacamaw River bridge. A little moisture drifted back onshore during the evening of December 31st and produced a brief period of sleet across coastal North Carolina, measuring a trace in spots around Wilmington.
2017 City Climate Reports and Graphics
WILMINGTON NC

    Avg Hi/Dep  Avg Lo/Dep  Avg T/Dep  Warmest   Coolest   Precip/Dep
JAN  61.3/+4.9   41.4/+5.8  51.3/+5.3  77/13th   16/9th    4.22/+0.46
FEB  67.9/+8.0   42.9/+5.0  55.4/+6.5  79/25th   29/10th   1.33/-2.29
MAR  65.9/-0.5   41.0/-2.8  53.5/-1.6  85/21st   25/17th   2.71/-1.50
APR  78.0/+3.8   57.9/+6.3  68.0/+5.1  88/21st   37/8th    7.05/+4.23
MAY  82.9/+2.2   63.1/+3.1  73.0/+2.6  91/29th   48/8th    5.19/+0.70
JUN  86.2/-0.7   68.9/+0.2  77.6/-0.2  93/24th   54/9th   10.11/+4.93
JUL  90.2/+0.5   73.7/+1.1  82.0/+0.9  97/7th    60/31st   6.59/-0.89
AUG  87.0/-1.1   71.9/+0.6  79.5/-0.2  95/18th   60/1st   10.18/+2.77
SEP  85.2/+1.5   67.2/+1.6  76.2/+1.6  94/28th   57/30th   3.82/-4.02
OCT  78.4/+2.7   58.2/+3.6  68.3/+3.1  89/12th   40/30th   6.51/+2.62
NOV  68.5/+0.5   44.4/-1.0  56.5/-0.2  82/6th    32/20th   1.07/-2.22
DEC  58.2/-1.1   39.1/+1.3  48.6/+0.0  75/19th   25/28th   3.86/+0.24
---------------------------------------------------------------------
ANN  75.8/+1.7   55.8/+2.0  65.8/+1.8  97        16       62.64/+5.03

Number of days with Temperatures...
 90 degrees of higher: 41 (1 more than normal)
 32 degrees or lower:  31 (4 fewer than normal)

Heating degree days: 1955 (457 fewer than normal)
Cooling degree days: 2355 (311 more than normal)

Number of days with precipitation...
 0.01" or greater: 121 (14 fewer than normal)
 0.10" or greater: 76  (2 fewer than normal)
 0.50" or greater: 37  (2 more than normal)
 1.00" or greater: 20  (3 more than normal)

Thunderstorms occurred on 74 days.
Snow or sleet fell on 3 days.
Measurable snow or sleet: 1.1 inches.

Average wind speed: 7.5 MPH
Maximum 2-minute wind speed: 37 mph on April 6th
Maximum 5-second wind gust: 50 mph on April 6th
FLORENCE SC

    Avg Hi/Dep  Avg Lo/Dep  Avg T/Dep  Warmest   Coolest   Precip/Dep
JAN  62.7/+7.4   41.6/+7.0  52.2/+7.3  79/18th   18/9th    3.26/+0.03
FEB  69.6/+10.0  43.0/+5.5  56.3/+7.8  80/28th   29/5th    1.61/-1.31
MAR  68.7/+1.1   42.1/-1.5  55.4/-0.2  87/21st   20/16th   1.60/-1.73
APR  79.4/+3.6   56.0/+5.3  67.7/+4.4  90/29th   35/8th    4.55/+1.93
MAY  83.3/+0.6   61.0/+1.6  72.1/+1.0  92/16th   46/8th    3.69/+0.43
JUN  87.1/-1.3   67.9/-0.1  77.5/-0.7  95/15th   56/9th    4.24/-0.38
JUL  90.9/-0.1   71.8/+0.4  81.4/+0.2  96/15th   61/31st   9.08/+3.82
AUG  88.5/-0.9   71.2/+0.7  79.8/-0.1  96/23rd   60/1st    3.55/-1.69
SEP  85.2/+1.0   64.8/+0.5  75.0/+0.8  93/28th   55/8th    4.12/+0.45
OCT  77.6/+2.1   55.5/+2.4  66.6/+2.3  87/12th   36/30th   1.57/-1.51
NOV  67.2/+0.1   41.2/-2.5  53.9/-1.5  83/3rd    29/28th   0.70/-1.97
DEC  57.1/-0.7   38.2/+1.7  47.7/+0.6  75/23rd   25/29th   4.66/+1.65
---------------------------------------------------------------------
ANN  76.5/+1.9   54.5/+1.7  65.5/+1.8  96        18       42.63/-0.28

Number of days with Temperatures...
 90 degrees of higher: 57 (1 more than normal)
 32 degrees or lower:  31 (9 fewer than normal)

Heating degree days: 1964 (560 fewer than normal)
Cooling degree days: 2248 (186 more than normal)

Number of days with precipitation...
 0.01" or greater: 105 (1 fewer than normal)
 0.10" or greater: 72  (2 more than normal)
 0.50" or greater: 27  (2 fewer than normal)
 1.00" or greater: 9   (3 fewer than normal)

Thunderstorms occurred on 65 days.
Snow fell on 1 day.

Average wind speed: 6.8 MPH
Maximum 2-minute wind speed: 45 mph on July 23rd
Maximum 5-second wind gust: 57 mph on July 23rd
NORTH MYRTLE BEACH SC

    Avg Hi/Dep  Avg Lo/Dep  Avg T/Dep  Warmest   Coolest   Precip/Dep
JAN  61.2/+6.1   43.2/+7.0  52.2/+6.5  78/18th   19/9th    2.03/-1.66
FEB  65.6/+8.2   44.4/+5.8  55.0/+7.0  75/24th   31/4th    1.50/-1.92
MAR  64.4/+0.3   43.7/-0.6  54.0/-0.2  76/29th   27/17th   1.94/-1.98
APR  74.8/+3.5   58.4/+6.5  66.6/+5.0  81/30th   37/8th    3.44/+0.48
MAY  81.2/+2.6   63.6/+2.8  72.4/+2.7  90/15th   49/8th    4.30/+0.89
JUN  83.5/-1.0   69.5/+0.2  76.5/-0.4  90/24th   54/9th    3.70/-0.94
JUL  88.1/+0.5   73.6/+0.5  80.8/+0.5  97/7th    59/31st   2.22/-3.68
AUG  85.4/-0.7   72.9/+1.2  79.1/+0.2  92/16th   61/1st   16.48/+9.07
SEP  84.3/+0.9   68.5/+1.6  76.4/+1.3  91/27th   59/8th    4.28/-2.00
OCT  77.1/+2.0   59.0/+3.3  68.1/+2.7  84/16th   38/30th   4.27/+0.39
NOV  67.1/+0.5   45.0/-1.4  56.0/-0.5  81/3rd    32/20th   1.52/-1.52
DEC  57.4/-1.1   41.1/+2.1  49.3/+0.5  74/1st    27/30th   3.44/-0.02
---------------------------------------------------------------------
ANN  74.2/+1.8   56.9/+2.3  65.5/+2.0  97/7th    19/9th   49.12/-2.89

Number of days with Temperatures...
 90 degrees of higher: 14 (2 fewer than normal)
 32 degrees or lower:  20 (10 fewer than normal)

Heating degree days: 1892 (556 fewer than normal)
Cooling degree days: 2197 (294 more than normal)

Number of days with precipitation...
 0.01" or greater: 117
 0.10" or greater: 76
 0.50" or greater: 31
 1.00" or greater: 16

Thunderstorms occurred on 66 days.
Snow did not fall.

Average wind speed: 7.8 MPH
Maximum 2-minute wind speed: 39 mph on August 7th
Maximum 5-second wind gust: 56 mph on August 7th
LUMBERTON NC

    Avg Hi/Dep  Avg Lo/Dep  Avg T/Dep  Warmest   Coolest   Precip/Dep
JAN  60.4/+6.7   39.6/+6.4  50.0/+6.6  77/13th   16/9th    2.40/-0.57
FEB  69.0/+11.0  41.6/+6.0  55.3/+8.5  82/25th   27/10th   1.09/-1.81
MAR  67.2/+0.9   40.5/-1.5  53.8/-0.3  85/21st   23/16th   3.90/+1.18
APR  77.9/+3.4   56.3/+7.3  67.1/+5.4  89/28th   35/8th    6.07/+3.25
MAY  83.5/+1.4   60.9/+3.3  72.2/+2.4  93/20th   44/8th    3.86/+0.81
JUN  87.4/-1.1   67.5/+0.1  77.5/-0.5  95/14th   54/9th    3.73/-0.61
JUL  90.6/-0.4   71.1/-0.2  80.8/-0.3  96/23rd   57/31st   3.74/-1.74
AUG  88.4/+0.1   70.1/+0.4  79.2/+0.2  95/23rd   57/1st    7.02/+1.52
SEP  85.0/+1.3   62.9/+0.6  73.9/+0.9  94/28th   53/8th    4.94/+0.14
OCT  78.2/+2.7   53.1/+1.8  65.6/+2.2  87/12th   35/30th   2.26/-0.31
NOV  67.4/+0.2   38.7/-2.7  53.0/-1.3  83/3rd    25/28th   0.74/-2.13
DEC  56.1/-0.7   36.1/+0.5  46.1/-0.1  75/5th    22/13th   4.08/+1.19
---------------------------------------------------------------------
ANN  75.9/+2.0   53.2/+1.8  64.6/+2.0  96        16       43.83/+0.31

Number of days with Temperatures...
 90 degrees of higher: 60 (9 more than normal)
 32 degrees or lower:  45 (4 fewer than normal)

Heating degree days: 2203 (558 fewer than normal)
Cooling degree days: 2105 (195 more than normal)

Number of days with precipitation...
 0.01" or greater: 108
 0.10" or greater: 81
 0.50" or greater: 26
 1.00" or greater: 10

Snow fell on 1 day.

Average wind speed: 6.1 MPH
Maximum 2-minute wind speed: 43 mph on March 18th
Maximum 5-second wind gust: 55 mph on August 23rd

2017 Radar-estimated Rainfall Graphics
|
2017 Radar-estimated precipitation totals were generally 40 to 65 inches across the area. Radar beam blockage has artificially lowered these estimates near the South Carolina coast. |
|
2017 Radar-estimated precipitation departures from normal were as large as +8 to +12 inches across isolated spots of eastern North and South Carolina. Other areas ran slightly below normal. Radar beam blockage has artificially lowered these estimates near the South Carolina coast. |
Page Author: Tim Armstrong
Page Created: January 2, 2018
Last Updated: January 2, 2018


.JPG)


 Coastal Flood