National Weather Service United States Department of Commerce

Severe Weather Climatology Banner

This page is a work in progress! New maps are being generated, and additional content is being added as we have time to work on this project. 

This page provides an overview of severe weather statistics for Central PA since 1950.

  Tornadoes Severe Wind Large Hail Flooding  

Tornado Events by County
from 1950 through 2025


Most Recent and Strongest Tornadoes By County (1950-2025)

County Most Recent Magnitude (F/EF) Strongest Magnitude (F/EF)
ADAMS CO. 08-18-2021 EF0 06-07-1980 F3
ALLEGHENY CO. 11-20-2024 EF0 06-03-1980 F4
ARMSTRONG CO. 03-31-2022 EF2 06-03-1980 F4
BEAVER CO. 05-25-2024 EF0 05-31-1985 F3
BEDFORD CO. 06-17-2025 EF1 04-09-1991, 04-24-1992, 11-08-1996, 09-17-2004, 06-11-2014, 06-17-2025 F1, EF1
BERKS CO. 07-01-2025 EF0 11-04-1950, 05-31-1998 F3
BLAIR CO. 08-29-2024 EF1 11-05-1988, 07-19-1996, 06-02-1998, 08-29-2024 F1, EF1
BRADFORD CO. 05-28-2019 EF1 09-19-1954, 06-13-2018 F2, EF2
BUCKS CO. 04-01-2023 EF1 07-29-2021 EF3
BUTLER CO. 05-21-2025 EF0 05-31-1985 F3
CAMBRIA CO. 08-12-2023 EF0 06-09-1980, 07-19-1996 F2
CAMERON CO. 05-31-1998 F1 09-26-1994, 05-31-1998 F1
CARBON CO. 10-02-2018 EF1 04-29-1981 F2
CENTRE CO. 07-02-2023 EF1 05-31-1985 F4
CHESTER CO. 06-16-2023 EF1 03-22-1955, 07-27-1994 F3
CLARION CO. 06-09-2025 EF0 06-01-1954, 07-19-1996 F2
CLEARFIELD CO. 08-09-2009 EF1 05-31-1985 F4
CLINTON CO. 03-16-2025 EF1 05-31-1985 F4
COLUMBIA CO. 04-15-2019 EF2 04-17-1982, 04-15-2019 F2, EF2
CRAWFORD CO. 06-09-2025 EF0 05-31-1985 F4
CUMBERLAND CO. 05-27-2022 EF0 04-16-1961 F3
DAUPHIN CO. 08-09-2024 EF1 07-05-1950, 10-18-1967, 03-26-1970, 04-05-1977 F2
DELAWARE CO. 10-31-2019 EF2 06-29-1973, 10-31-2019 F2, EF2
ELK CO. 03-16-2025 EF1 05-31-1985 F4
ERIE CO. 06-09-2025 EF2 05-31-1985 F4
FAYETTE CO. 03-16-2025 EF0 11-16-1965, 07-13-1971, 07-14-1971, 10-01-1986, 06-02-1998, 08-25-2023 F2, EF2
FOREST CO. 05-01-2017 EF2 05-31-1985 F4
FRANKLIN CO. 05-27-2022 EF0 04-30-1994, 04-19-2019 F2, EF2
FULTON CO. 05-29-2019 EF1 09-17-2004, 08-04-2017, 04-19-2019, 05-29-2019 F1, EF1
GREENE CO. 08-01-2022 EF0 06-25-1968 F2
HUNTINGDON CO. 04-19-2019 EF1 11-20-1989, 09-18-1991 F2
INDIANA CO. 03-16-2025 EF1 05-30-1953, 06-03-1980, 07-26-1981, 05-22-1983, 07-19-1996, 04-28-2002 F2
JEFFERSON CO. 10-16-2021 EF1 07-11-1976, 07-19-1996, 10-02-2018 F2, EF2
JUNIATA CO. 04-19-2019 EF1 05-23-2011 EF2
LACKAWANNA CO. 07-02-2023 EF0 02-25-2017 EF2
LANCASTER CO. 09-04-2025 EF0 11-04-1950 F3
LAWRENCE CO. 05-03-2021 EF0 06-11-1954, 09-24-1977, 08-08-1992 F2
LEBANON CO. 07-29-2021 EF0 06-18-1970, 07-14-2004 F3
LEHIGH CO. 08-07-2023 EF1 07-05-1950, 07-05-1984 F2
LUZERNE CO. 08-12-2023 EF1 07-04-1960, 09-10-1968, 07-06-1984, 12-01-2006, 02-25-2017, 06-13-2018 F2, EF2
LYCOMING CO. 03-31-2022 EF1 07-29-1976, 05-31-1985 F3
MCKEAN CO. 07-21-2003 F1 05-31-1985 F4
MERCER CO. 08-06-2024 EFU 05-31-1985 F5
MIFFLIN CO. 04-19-2019 EF2 07-23-1952, 04-19-2019 F2, EF2
MONROE CO. 10-02-2018 EF1 03-21-1976 F3
MONTGOMERY CO. 09-01-2021 EF2 07-27-1994 F3
MONTOUR CO. 04-01-1998 F0 10-03-1979, 05-23-1983 F1
NORTHAMPTON CO. 05-06-2025 EF1 07-26-1981 F3
NORTHUMBERLAND CO. 07-24-2017 EF0 05-31-1985 F3
PERRY CO. 05-29-2019 EF1 09-21-1967, 06-20-1989 F2
PHILADELPHIA CO. 07-29-2021 EF0 07-29-2021 EF3
PIKE CO. 07-23-2010 EF1 05-31-1998 F3
POTTER CO. 07-27-2013 EF1 07-21-2003 F3
SCHUYLKILL CO. 05-27-2024 EF1 07-26-1981, 07-15-1992 F2
SNYDER CO. 09-08-2021 EF0 08-28-1978, 04-09-1980 F2
SOMERSET CO. 08-31-2024 EF0 05-31-1998, 06-02-1998 F3
SULLIVAN CO. 05-29-2019 EF0 09-19-1954, 04-14-1974, 07-08-2014 F2, EF2
SUSQUEHANNA CO. 08-07-2023 EF1 04-17-1954, 09-18-1991 F2
TIOGA CO. 05-29-2019 EF0 05-02-1983 F2
UNION CO. 07-02-2023 EF1 05-31-1985 F3
VENANGO CO. 07-29-2021 EF0 05-31-1985 F4
WARREN CO. 04-14-2019 EF2 05-31-1985 F4
WASHINGTON CO. 05-21-2025 EF1 06-30-1990, 10-21-2021, 08-01-2022, 05-11-2024 F2, EF2
WAYNE CO. 05-27-2024 EF1 09-18-1991, 07-23-2010 F2, EF2
WESTMORELAND CO. 03-16-2025 EF0 06-03-1980 F4
WYOMING CO. 05-28-2019 EF0 06-02-1998 F3
YORK CO. 08-07-2023 EF1 04-05-1952 F3

By Year (T3)


PA Tornado Magnitude and Frequency by Month


PA Tornadoes by Time of Day (Hour)
tornadoes by hour chart


Severe Weather Database

See All Tornado Events for a specific County:

Search for Past Tornado, Severe Wind Gust and Hail Events
(from NOAA NCEI Storm Data, 1/1/1950 through roughly 3 months ago)


  The Enhanced Fujita Scale
(EF Scale)

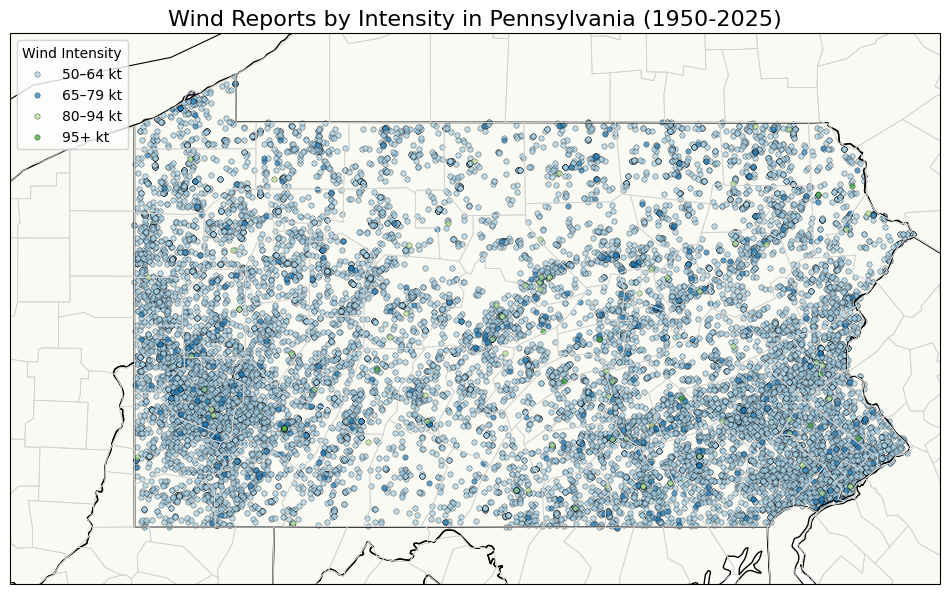
The EF Scale, which became operational on February 1, 2007, is used to assign a tornado a 'rating' based on estimated wind speeds and related damage. When tornado-related damage is surveyed, it is compared to a list of Damage Indicators (DIs) and Degrees of Damage (DoD) which help estimate better the range of wind speeds the tornado likely produced. From that, a rating (from EF0 to EF5) is assigned.

The EF Scale was revised from the original Fujita Scale to reflect better examinations of tornado damage surveys so as to align wind speeds more closely with associated storm damage. The new scale has to do with how most structures are designed.


EF SCALE
EF Rating 3 Second Gust (mph)
0 65-85
1 86-110
2 111-135
3 136-165
4 166-200
5 Over 200

*** IMPORTANT NOTE ABOUT EF SCALE WINDS: The EF scale still is a set of wind estimates (not measurements) based on damage. Its uses three-second gusts estimated at the point of damage based on a judgment of 8 levels of damage to the 28 indicators listed below. These estimates vary with height and exposure. Important: The 3 second gust is not the same wind as in standard surface observations. Standard measurements are taken by weather stations in open exposures, using a directly measured, "one minute mile" speed.


Assigning a Tornado Rating Using the EF Scale

The NWS is the only federal agency with authority to provide 'official' tornado EF Scale ratings. The goal is assign an EF Scale category based on the highest wind speed that occurred within the damage path. First, trained NWS personnel will identify the appropriate damage indicator (DI) [see list below] from more than one of the 28 used in rating the damage. The construction or description of a building should match the DI being considered, and the observed damage should match one of the 8 degrees of damage (DOD) used by the scale. The tornado evaluator will then make a judgment within the range of upper and lower bound wind speeds, as to whether the wind speed to cause the damage is higher or lower than the expected value for the particular DOD. This is done for several structures not just one, before a final EF rating is determined.


Enhanced F Scale Damage Indicators

NUMBER
(Details Linked)
DAMAGE INDICATOR ABBREVIATION
1 Small barns, farm outbuildings SBO
2 One- or two-family residences FR12
3 Single-wide mobile home (MHSW) MHSW
4 Double-wide mobile home MHDW
5 Apt, condo, townhouse (3 stories or less) ACT
6 Motel M
7 Masonry apt. or motel MAM
8 Small retail bldg. (fast food) SRB
9 Small professional (doctor office, branch bank) SPB
10 Strip mall SM
11 Large shopping mall LSM
12 Large, isolated ("big box") retail bldg. LIRB
13 Automobile showroom ASR
14 Automotive service building ASB
15 School - 1-story elementary (interior or exterior halls) ES
16 School - jr. or sr. high school JHSH
17 Low-rise (1-4 story) bldg. LRB
18 Mid-rise (5-20 story) bldg. MRB
19 High-rise (over 20 stories) HRB
20 Institutional bldg. (hospital, govt. or university) IB
21 Metal building system MBS
22 Service station canopy SSC
23 Warehouse (tilt-up walls or heavy timber) WHB
24 Transmission line tower TLT
25 Free-standing tower FST
26 Free standing pole (light, flag, luminary) FSP
27 Tree - hardwood TH
28 Tree - softwood TS

Other background information:


Wind Reports At Least 50 kts (58+ mph; severe weather criteria)


Wind Reports At Least 60 kts (69+ mph)

Wind Reports At Least 70 kts (80+ mph)

W5


W6


W7


Hail Reports At Least 1.5 Inches In Diameter (Bigger Than Ping Pong Balls)


Hail Reports At Least 2 Inches In Diameter (Bigger Than Hen Egg)


Hail Reports At Least 3 Inches In Diameter (Bigger Than Baseballs)


H6


H7


Flooding Events by County
(River Flooding and Flash Floods Combined)
from 1950 to 2025.

Floods By County Map  


F5


F6


F7