
Record setting heat is expected over the next several days from the Intermountain West through the northern Plains. Furthermore, fire weather concerns increase with dry and breezy conditions. Meanwhile, heavy rainfall and severe thunderstorm threats for the Ohio/Tennessee Valleys, central Appalachians and Southeast today. The threat shifts to central Gulf Coast and across central Texas this week. Read More >
| Snow Amount
Potential
Experimental - Leave feedback
|
|
| Expected
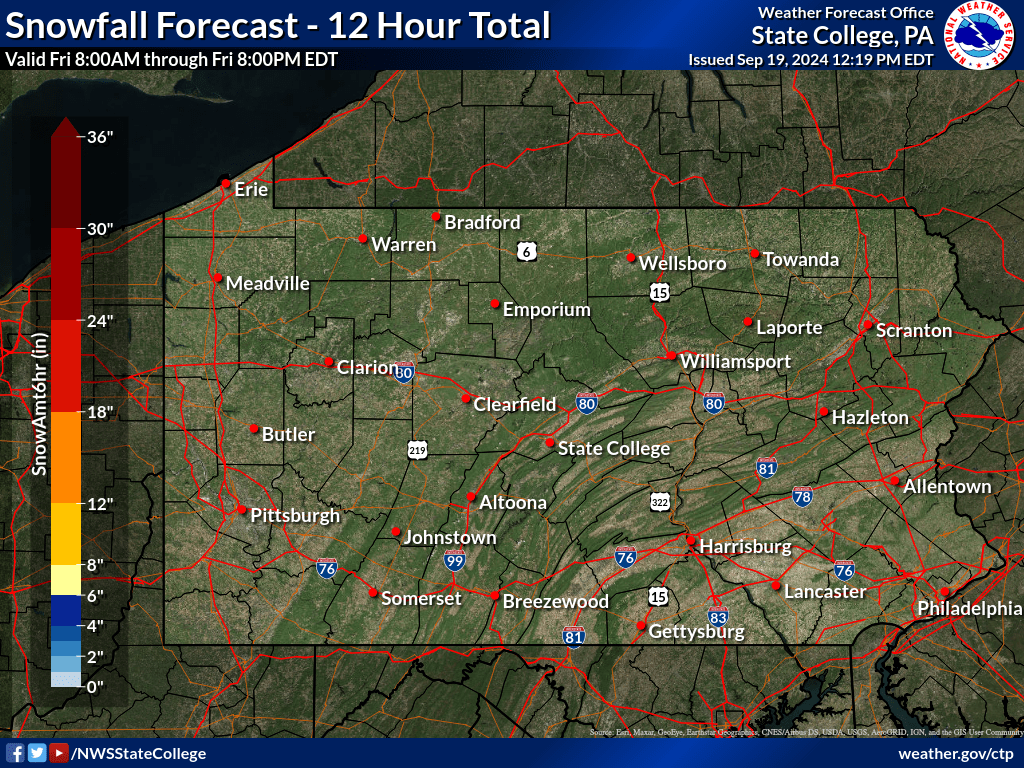
Snowfall - Official NWS Forecast
What's this? |
High End Amount 1 in 10 Chance (10%) of Higher Snowfall What's this? |
| Low End
Amount 9 in 10 Chance (90%) of Higher Snowfall What's this? |
|
| Percent Chance That Snow
Amounts Will Be Greater Than...
Experimental - Leave feedback
What's
this?
|
||||||||||||||||
|
||||||||||||||||
| Snowfall Totals by Location
Experimental - Leave feedback
What's
this?
|
|
|
|
Snow Amount Potential
Experimental -
Leave feedback
|
|
|
Expected Snowfall - Official NWS Forecast
What's this? |
High End Amount 1 in 10 Chance (10%) of Higher Snowfall What's this? |
|
Low End Amount 9 in 10 Chance (90%) of Higher Snowfall What's this? |
|
|
Percent Chance That Snow Amounts Will Be Greater Than...
Experimental -
Leave feedback
What's this?
|
||||||||||||||||
|
||||||||||||||||
| Ice Accumulation
Potential
Experimental - Leave feedback
|
|
| Expected
Ice Accumulation - Official NWS Forecast
What's this? This is the elevated flat surface ice accumulation. It is not radial/line ice. Radial/line ice is typically 39% of the elevated flat surface ice. For more information on this, see this module. |
High End Amount 1 in 10 Chance (10%) of Higher Ice Accumulation What's this? |
| Low End
Amount 9 in 10 Chance (90%) of Higher Ice Accumulation What's this? |
|
| Percent Chance That Ice
Accumulation Will Be Greater Than...
Experimental - Leave feedback
What's
this?
|
||||||||||||||||
|
||||||||||||||||
| Ice Accumulation by
Location
Experimental - Leave feedback
What's
this?
|
|
|
|
Ice Accumulation Potential
Experimental -
Leave
feedback
|
|
|
Expected Ice Accumulation - Official NWS Forecast
What's this? This is the elevated flat surface ice accumulation. It is not radial/line ice. Radial/line ice is typically 39% of the elevated flat surface ice. For more information on this, see this module. |
High End Amount 1 in 10 Chance (10%) of Higher Ice Accumulation What's this? |
|
Low End Amount 9 in 10 Chance (90%) of Higher Ice Accumulation What's this? |
|
|
Percent Chance That Ice Accumulations Will Be Greater Than...
Experimental -
Leave
feedback
What's this?
|
||||||||||||||||
|
||||||||||||||||
| Precipitation Onset/End Timing | ||
| Onset of Wintry Precipitation | End Timing of Wintry Precipitation | |
|---|---|---|
 |
 |
|
| What's this? | What's this? | |
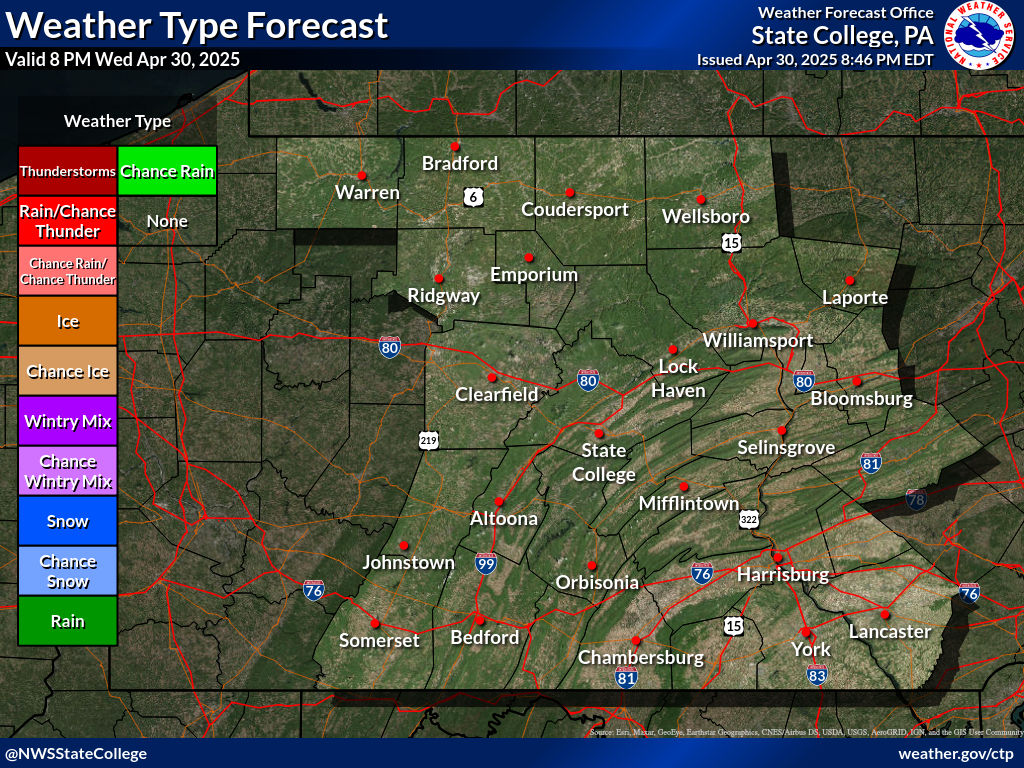
| Weather Type and Coverage Forecast |
**Prototype Under Development** **Not to be relied on for operational decision making**
|
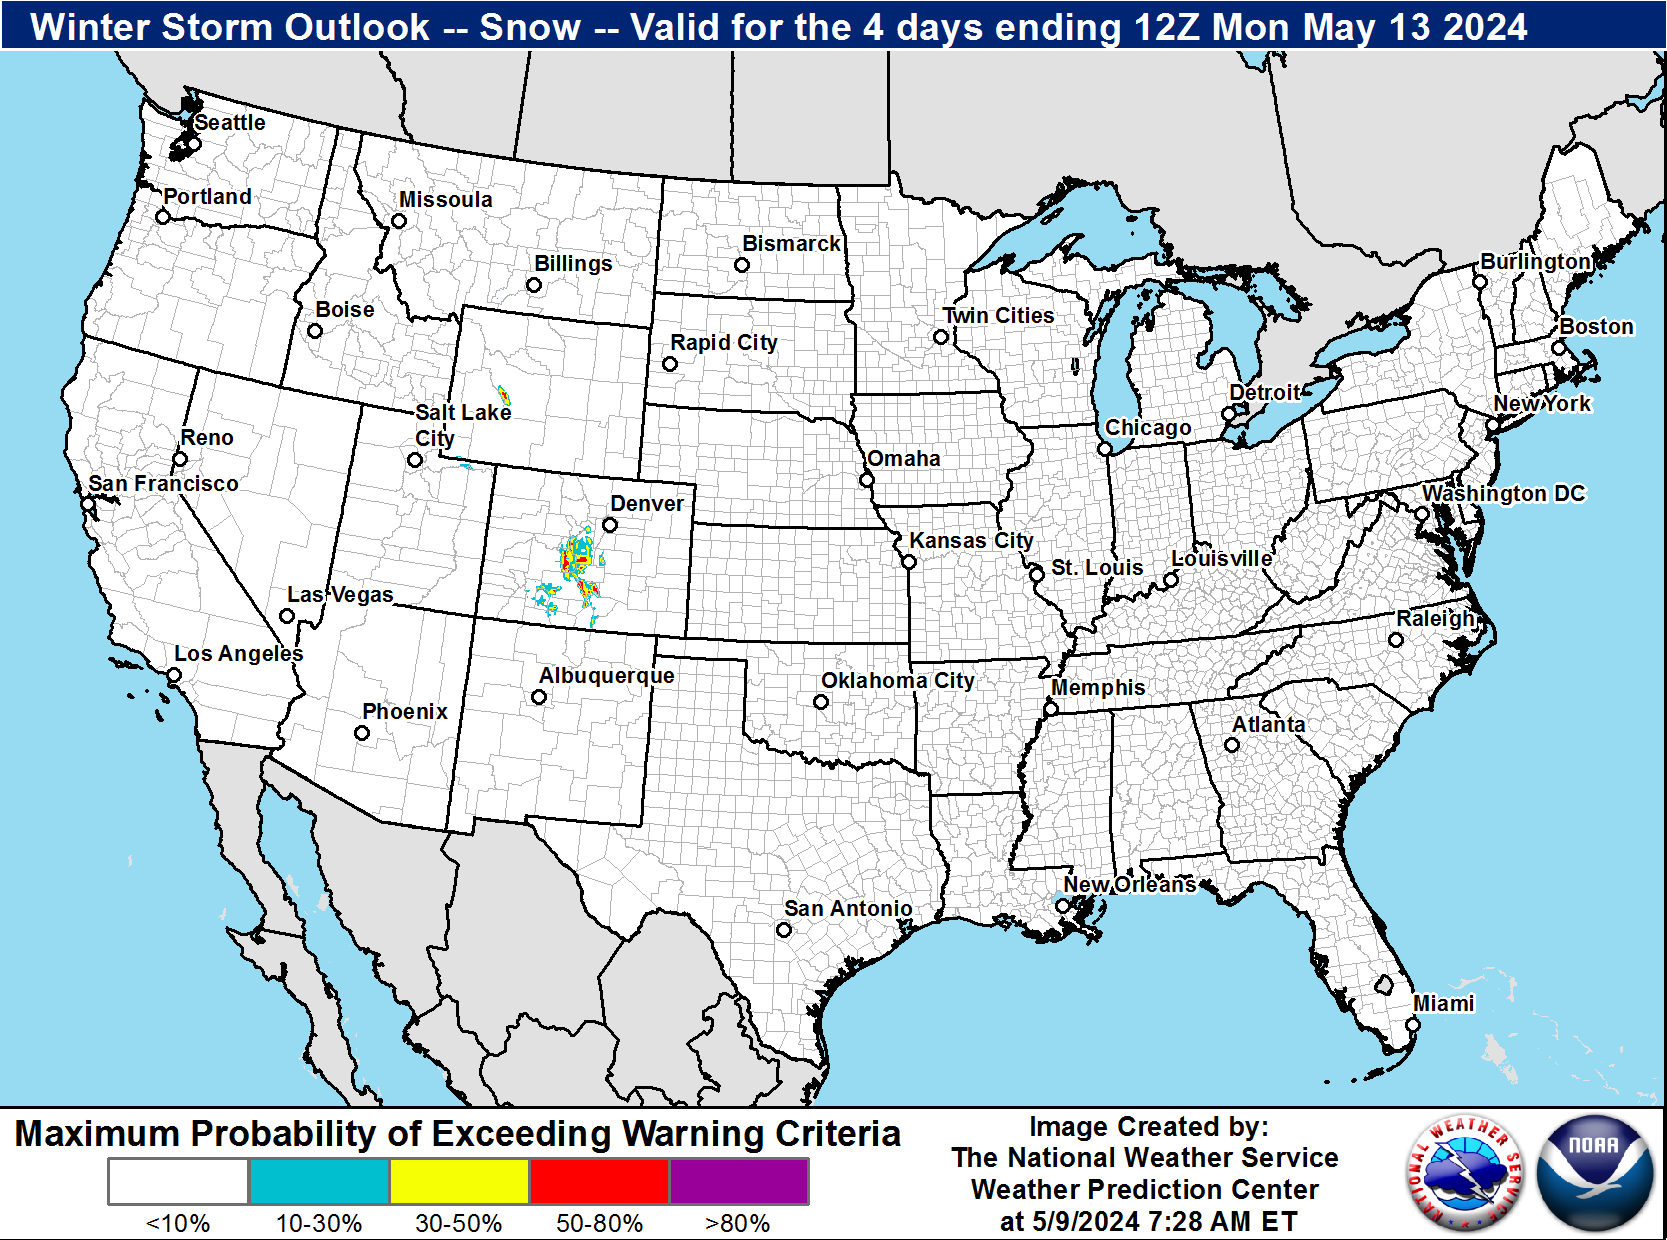
| Winter Storm Outlook (WSO) | |
|
|
|
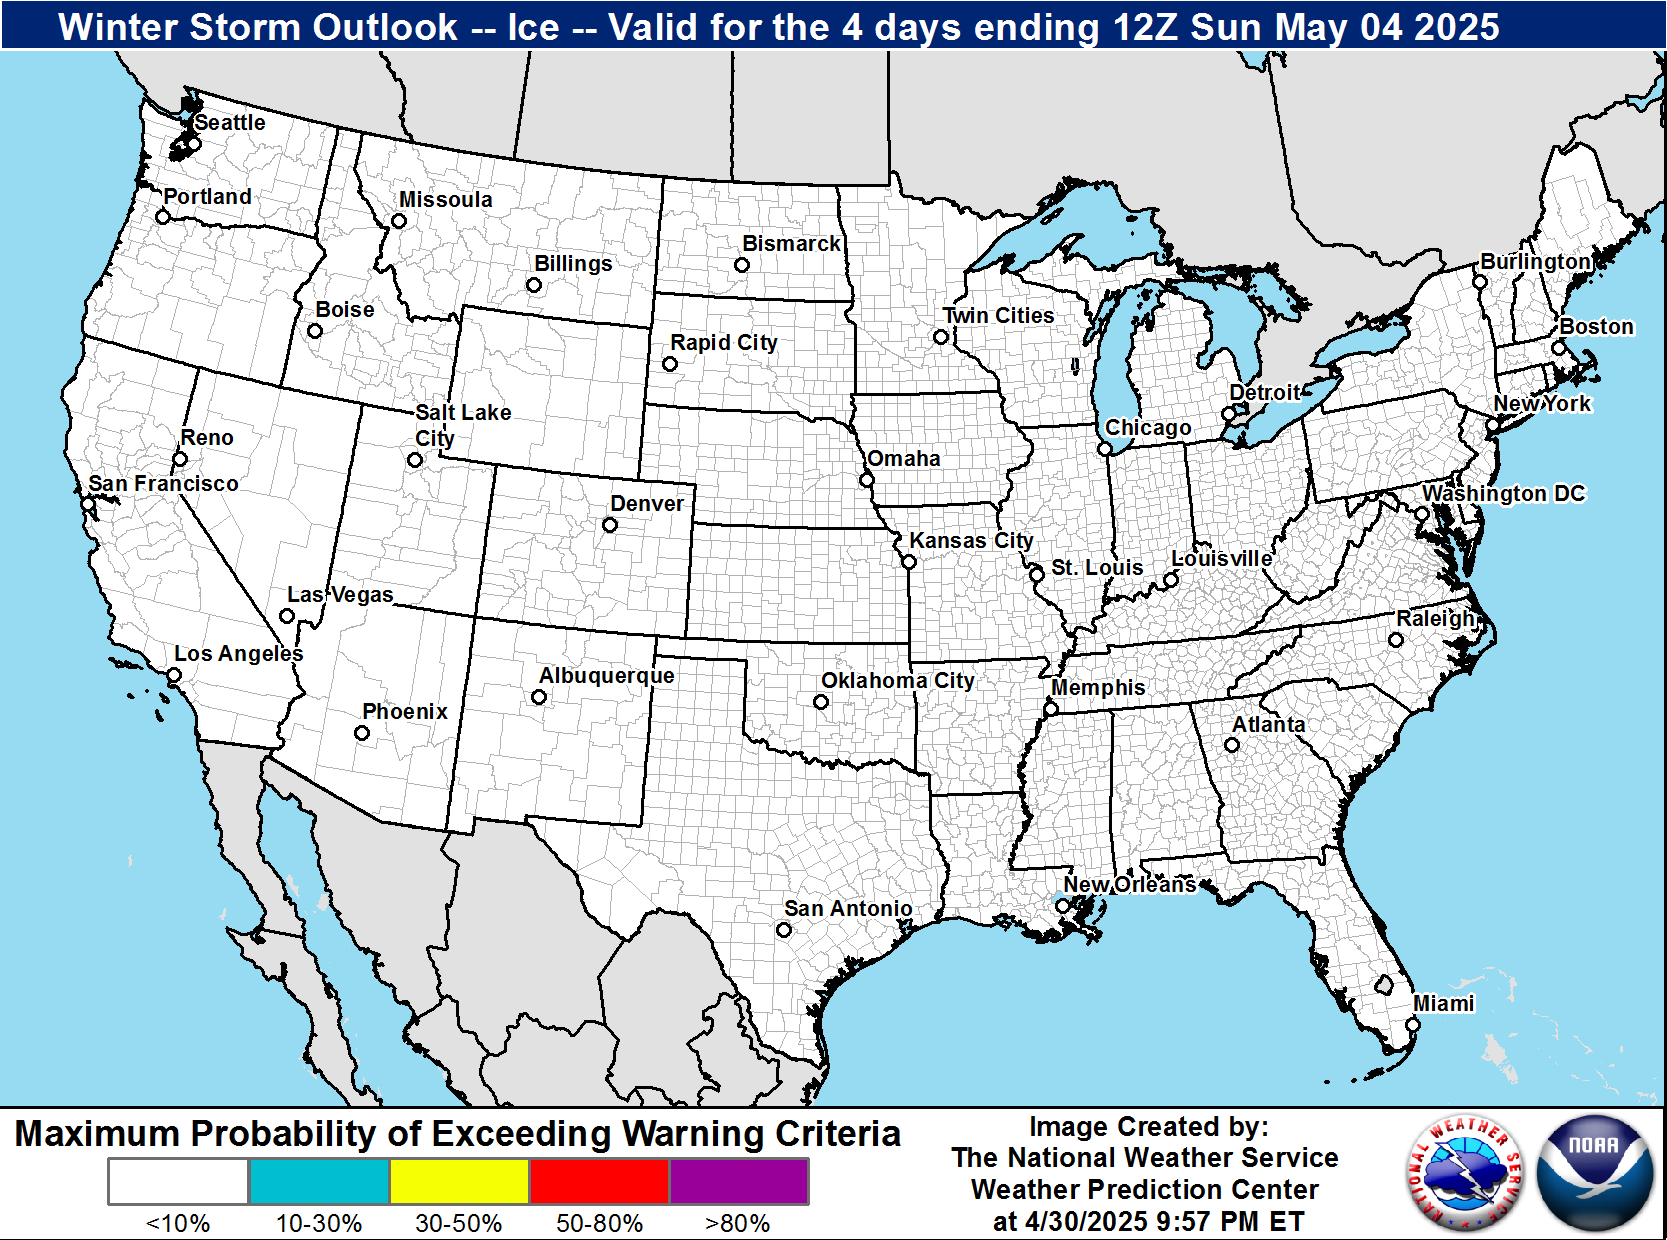
| Winter Storm Outlook (WSO) for Snow |
Winter Storm Outlook (WSO) for Ice |
|---|---|
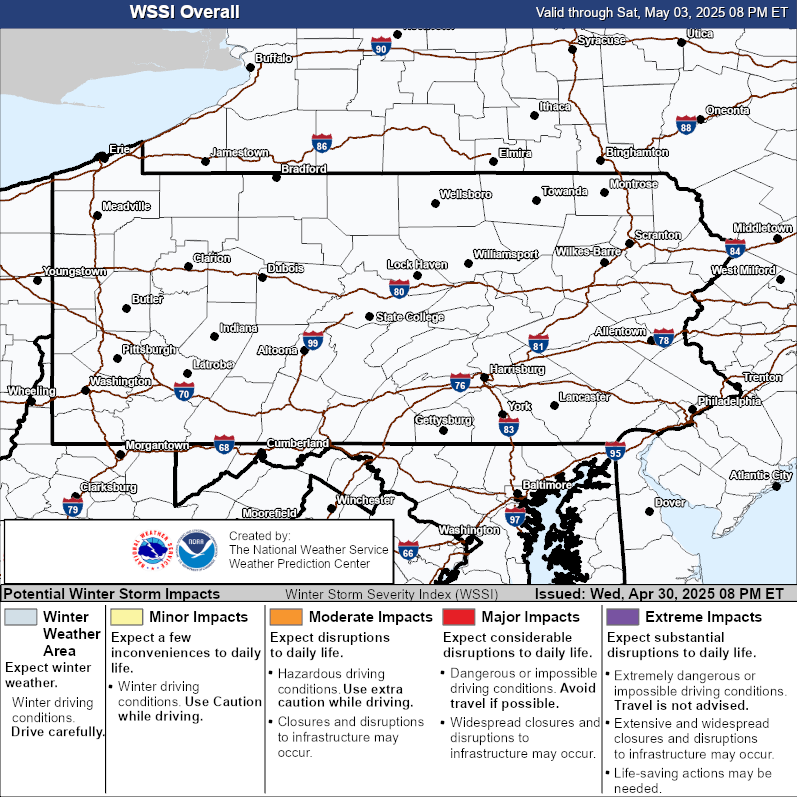
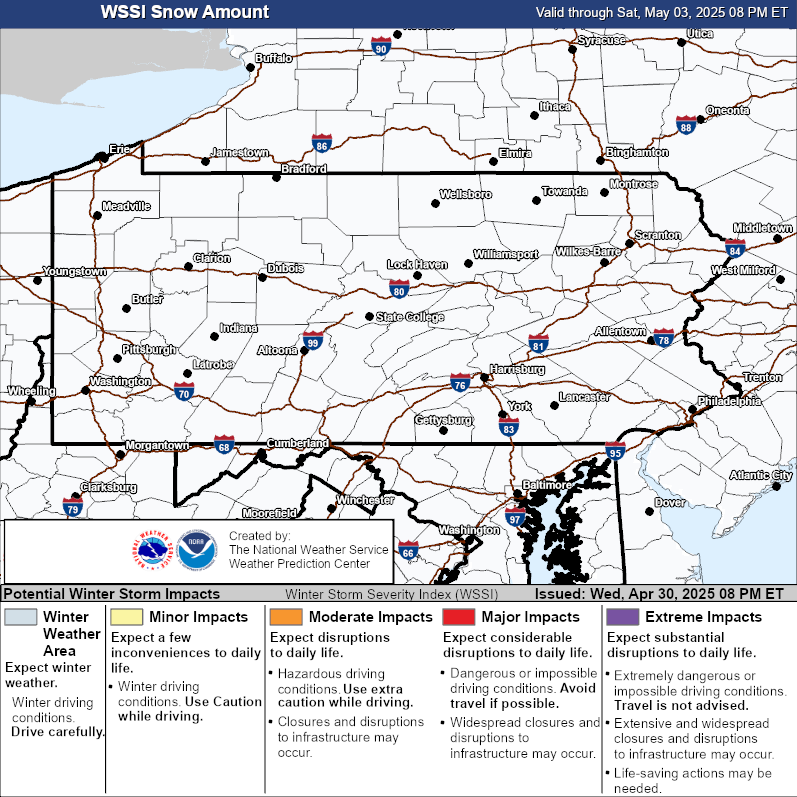
| Winter Storm Severity Index (WSSI) | |
|
|
|
| Winter Storm Severity Index (WSSI) Overall Impact |
|
|---|---|
|
|
|
| Winter Storm Severity Index (WSSI) Snow Amount |
Winter Storm Severity Index (WSSI) Ice Accumulation |
|
|
|
| Winter Storm Severity Index (WSSI) Snow Load |
Winter Storm Severity Index (WSSI) Blowing Snow |
|
|
|
|
|
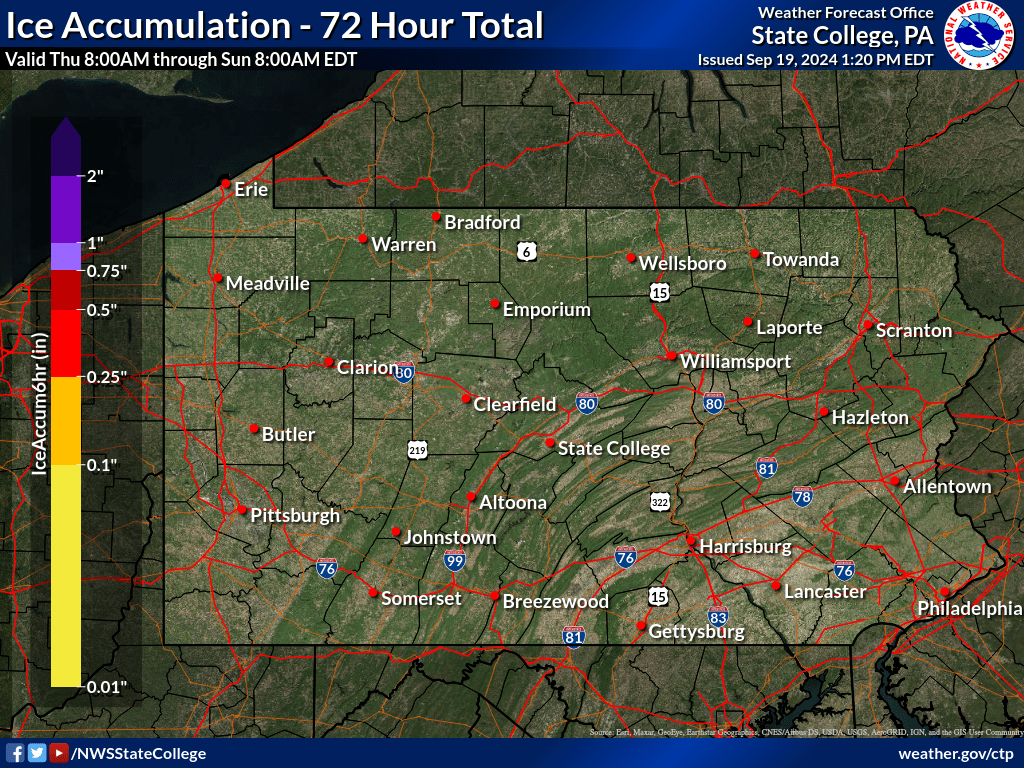
| 72 Hour Snowfall / Ice Accumulation Forecasts | ||
| 72 Hour Snowfall Forecast | 72 Hour Ice Accumulation Forecast | |
|---|---|---|
 |
 |
|
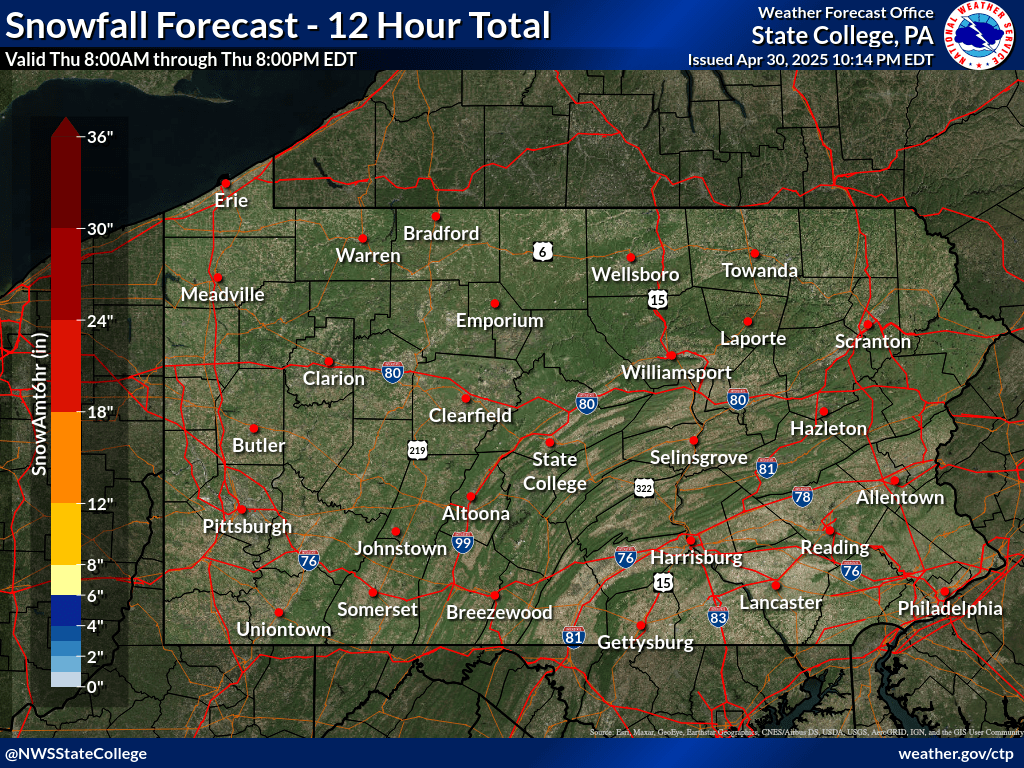
| 12 Hour Snowfall / Ice Accumulation Forecasts | ||
| 12 Hour Snowfall Forecasts (through 72 Hours) | |||||
|---|---|---|---|---|---|
| 0 to 12 Hours | 12 to 24 Hours | 24 to 36 Hours | 36 to 48 Hours | 48 to 60 Hours | 60 to 72 Hours |
 |
 |
 |
 |
 |
 |
| 12 Hour Ice Accumulation Forecasts (through 72 Hours) | |||||
|---|---|---|---|---|---|
| 0 to 12 Hours | 12 to 24 Hours | 24 to 36 Hours | 36 to 48 Hours | 48 to 60 Hours | 60 to 72 Hours |
 |
 |
 |
 |
 |
 |
** EXPERIMENTAL ** EXPERIMENTAL ** EXPERIMENTAL **Day 4-7 Winter Weather Outlook(Winter Liquid Equivalent Exceedance Graphics) |
| Day 4 | Day 5 | Day 6 | Day 7 | |
|---|---|---|---|---|
 |
 |
 |
 |
|
|
||||
|
These images are created using WPC Probability of Exceeding 0.25"
|
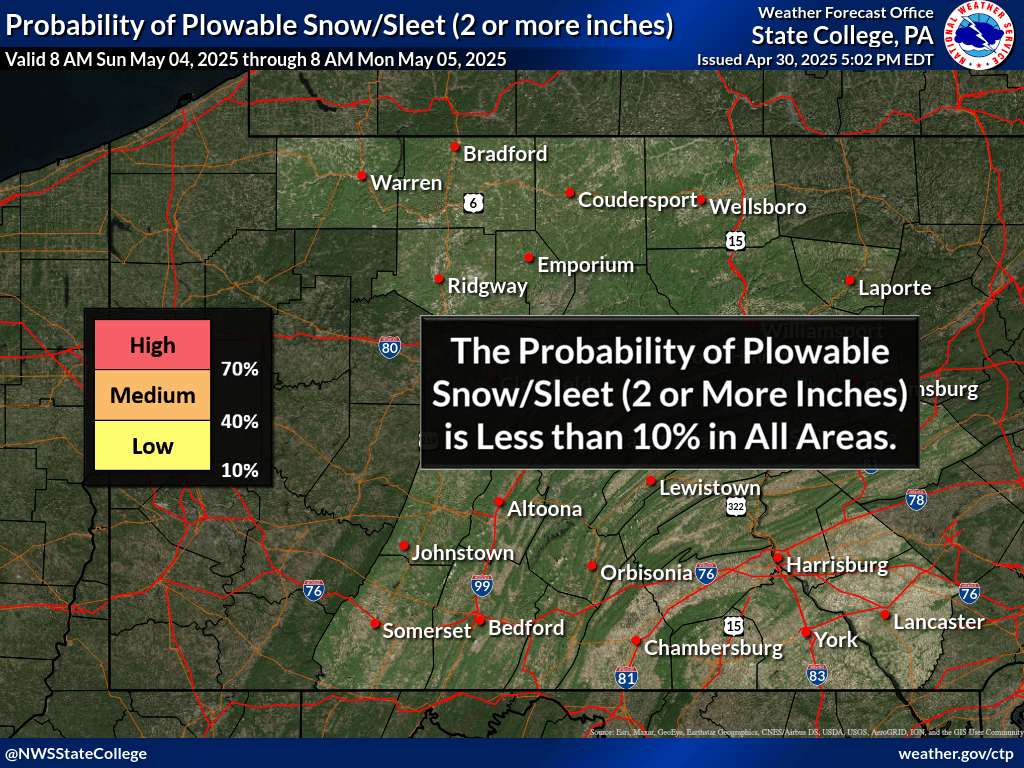
| High | High Threat for a Plowable Snow. Potential impacts include travel delays and closures. Plan ahead to minimize impact on you and your family. |
|---|---|
| Medium | Moderate Threat for a Plowable Snow. Primary threat is disruption to travel. |
| Low | Slight Threat for a Plowable Snow. If threat materializes, may cause travel disruptions. |
| None | No significant winter storm threat is currently expected. However, light wintry precipitation may still be possible. |
| Days 4-7 Winter Weather Outlook | |
| Day 4 Winter Weather Outlook | Day 5 Winter Weather Outlook |
|
|
| Day 6 Winter Weather Outlook | Day 7 Winter Weather Outlook |
|
|
| CPC Week-2 Experimental Heavy Snow Risk | |
 |
|
| CPC Temperature & Precipitation Maps | |
|
Days 6-10 |
|
| Temperature | Precipitation |
 |
 |
|
Days 8-14 |
|
| TEMPERATURE | PRECIPITATION |
 |
 |
|
Week 3-4 |
|
|
TEMPERATURE |
PRECIPITATION |
 |
 |
| Daily Snow / Ice Reports | ||
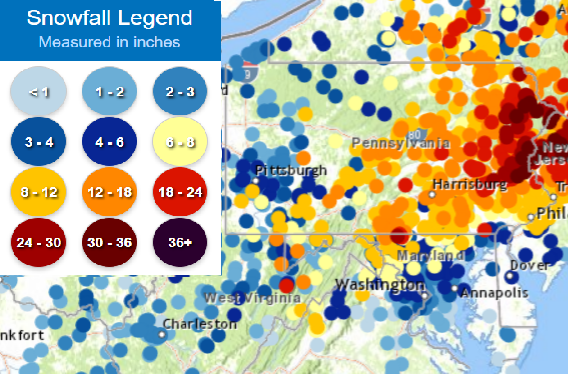
Reported Snow/Ice Totals |
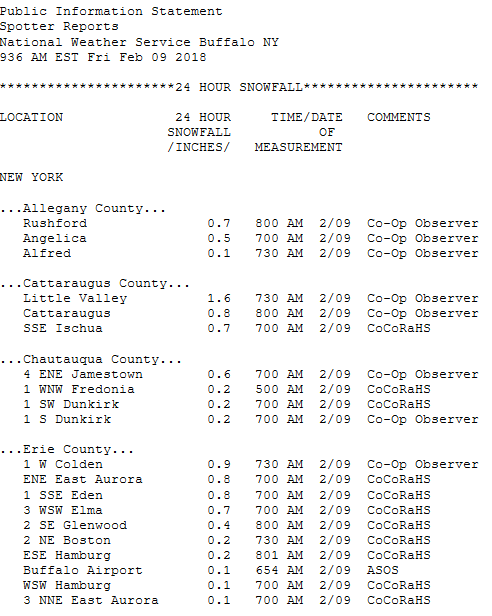
Text Reported Snow/Ice Totals |
Snow/Ice Analysis |
|---|---|---|
 |
 |
 |
| National Snowfall Reports/Analysis | ||
| National Snow Reports | National Snowfall Analysis | |
|---|---|---|
 |
 |
|
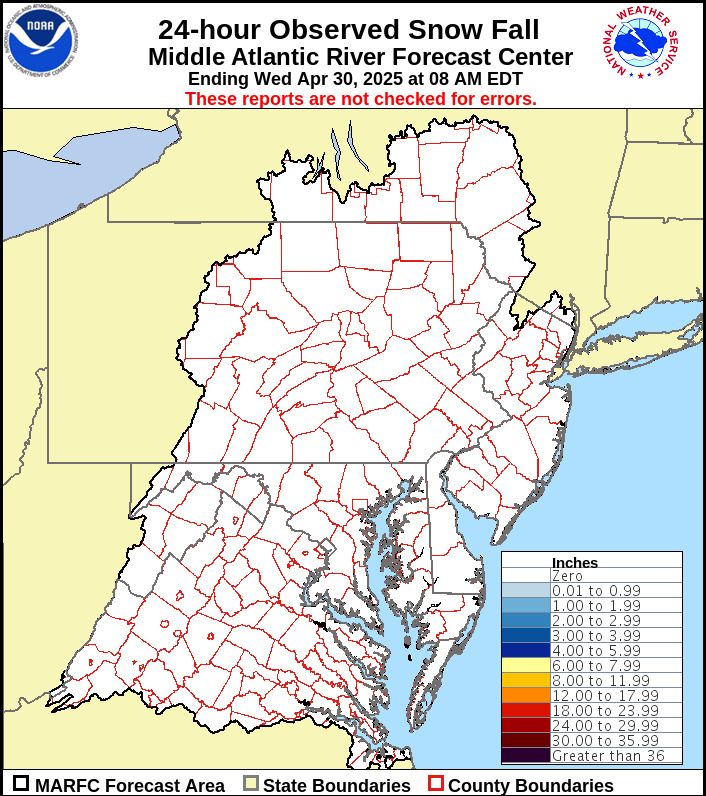
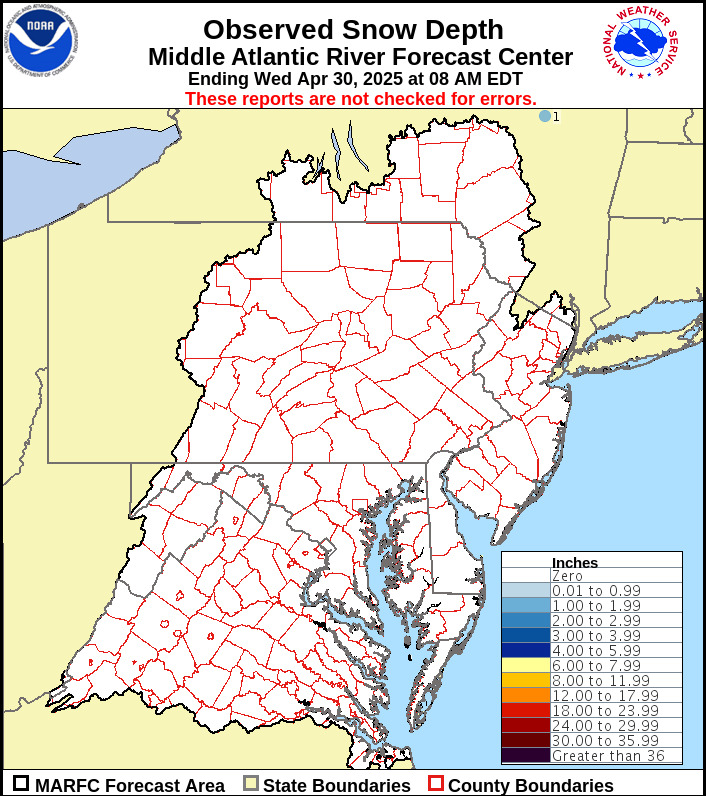
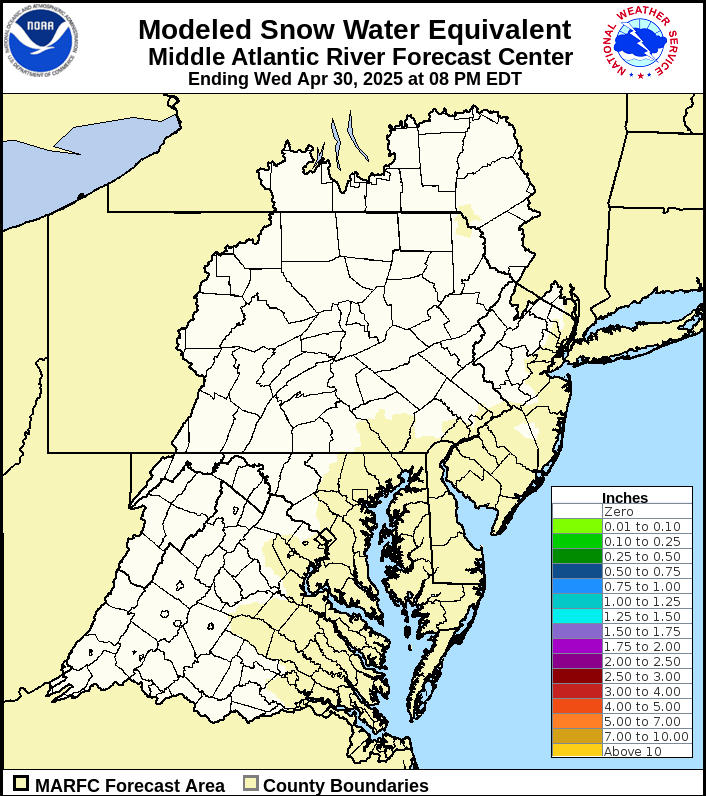
| From the Middle Atlantic River Forecast Center | ||
24-hr Observed |
Observed Snow Depth |
Modeled Snow Water Equivalent |
|---|---|---|
 |
 |
 |
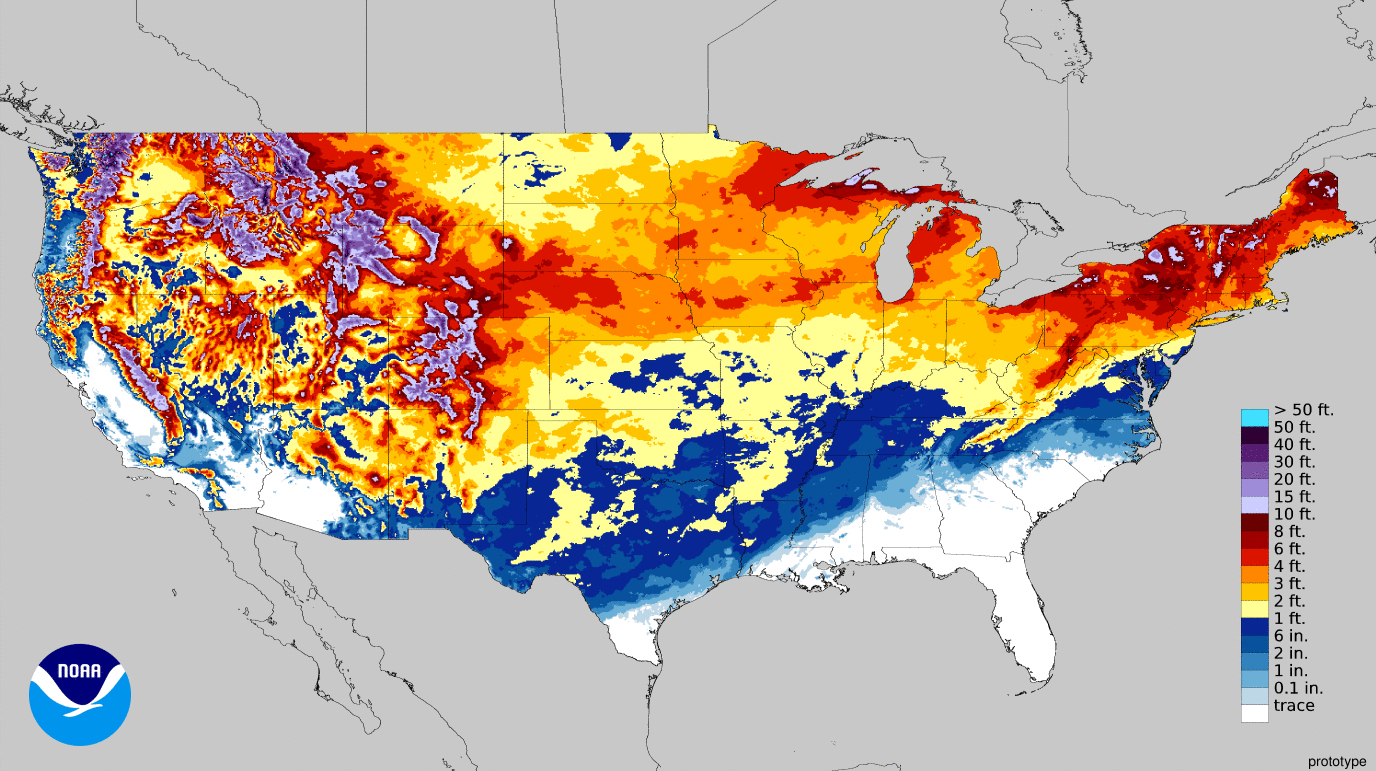
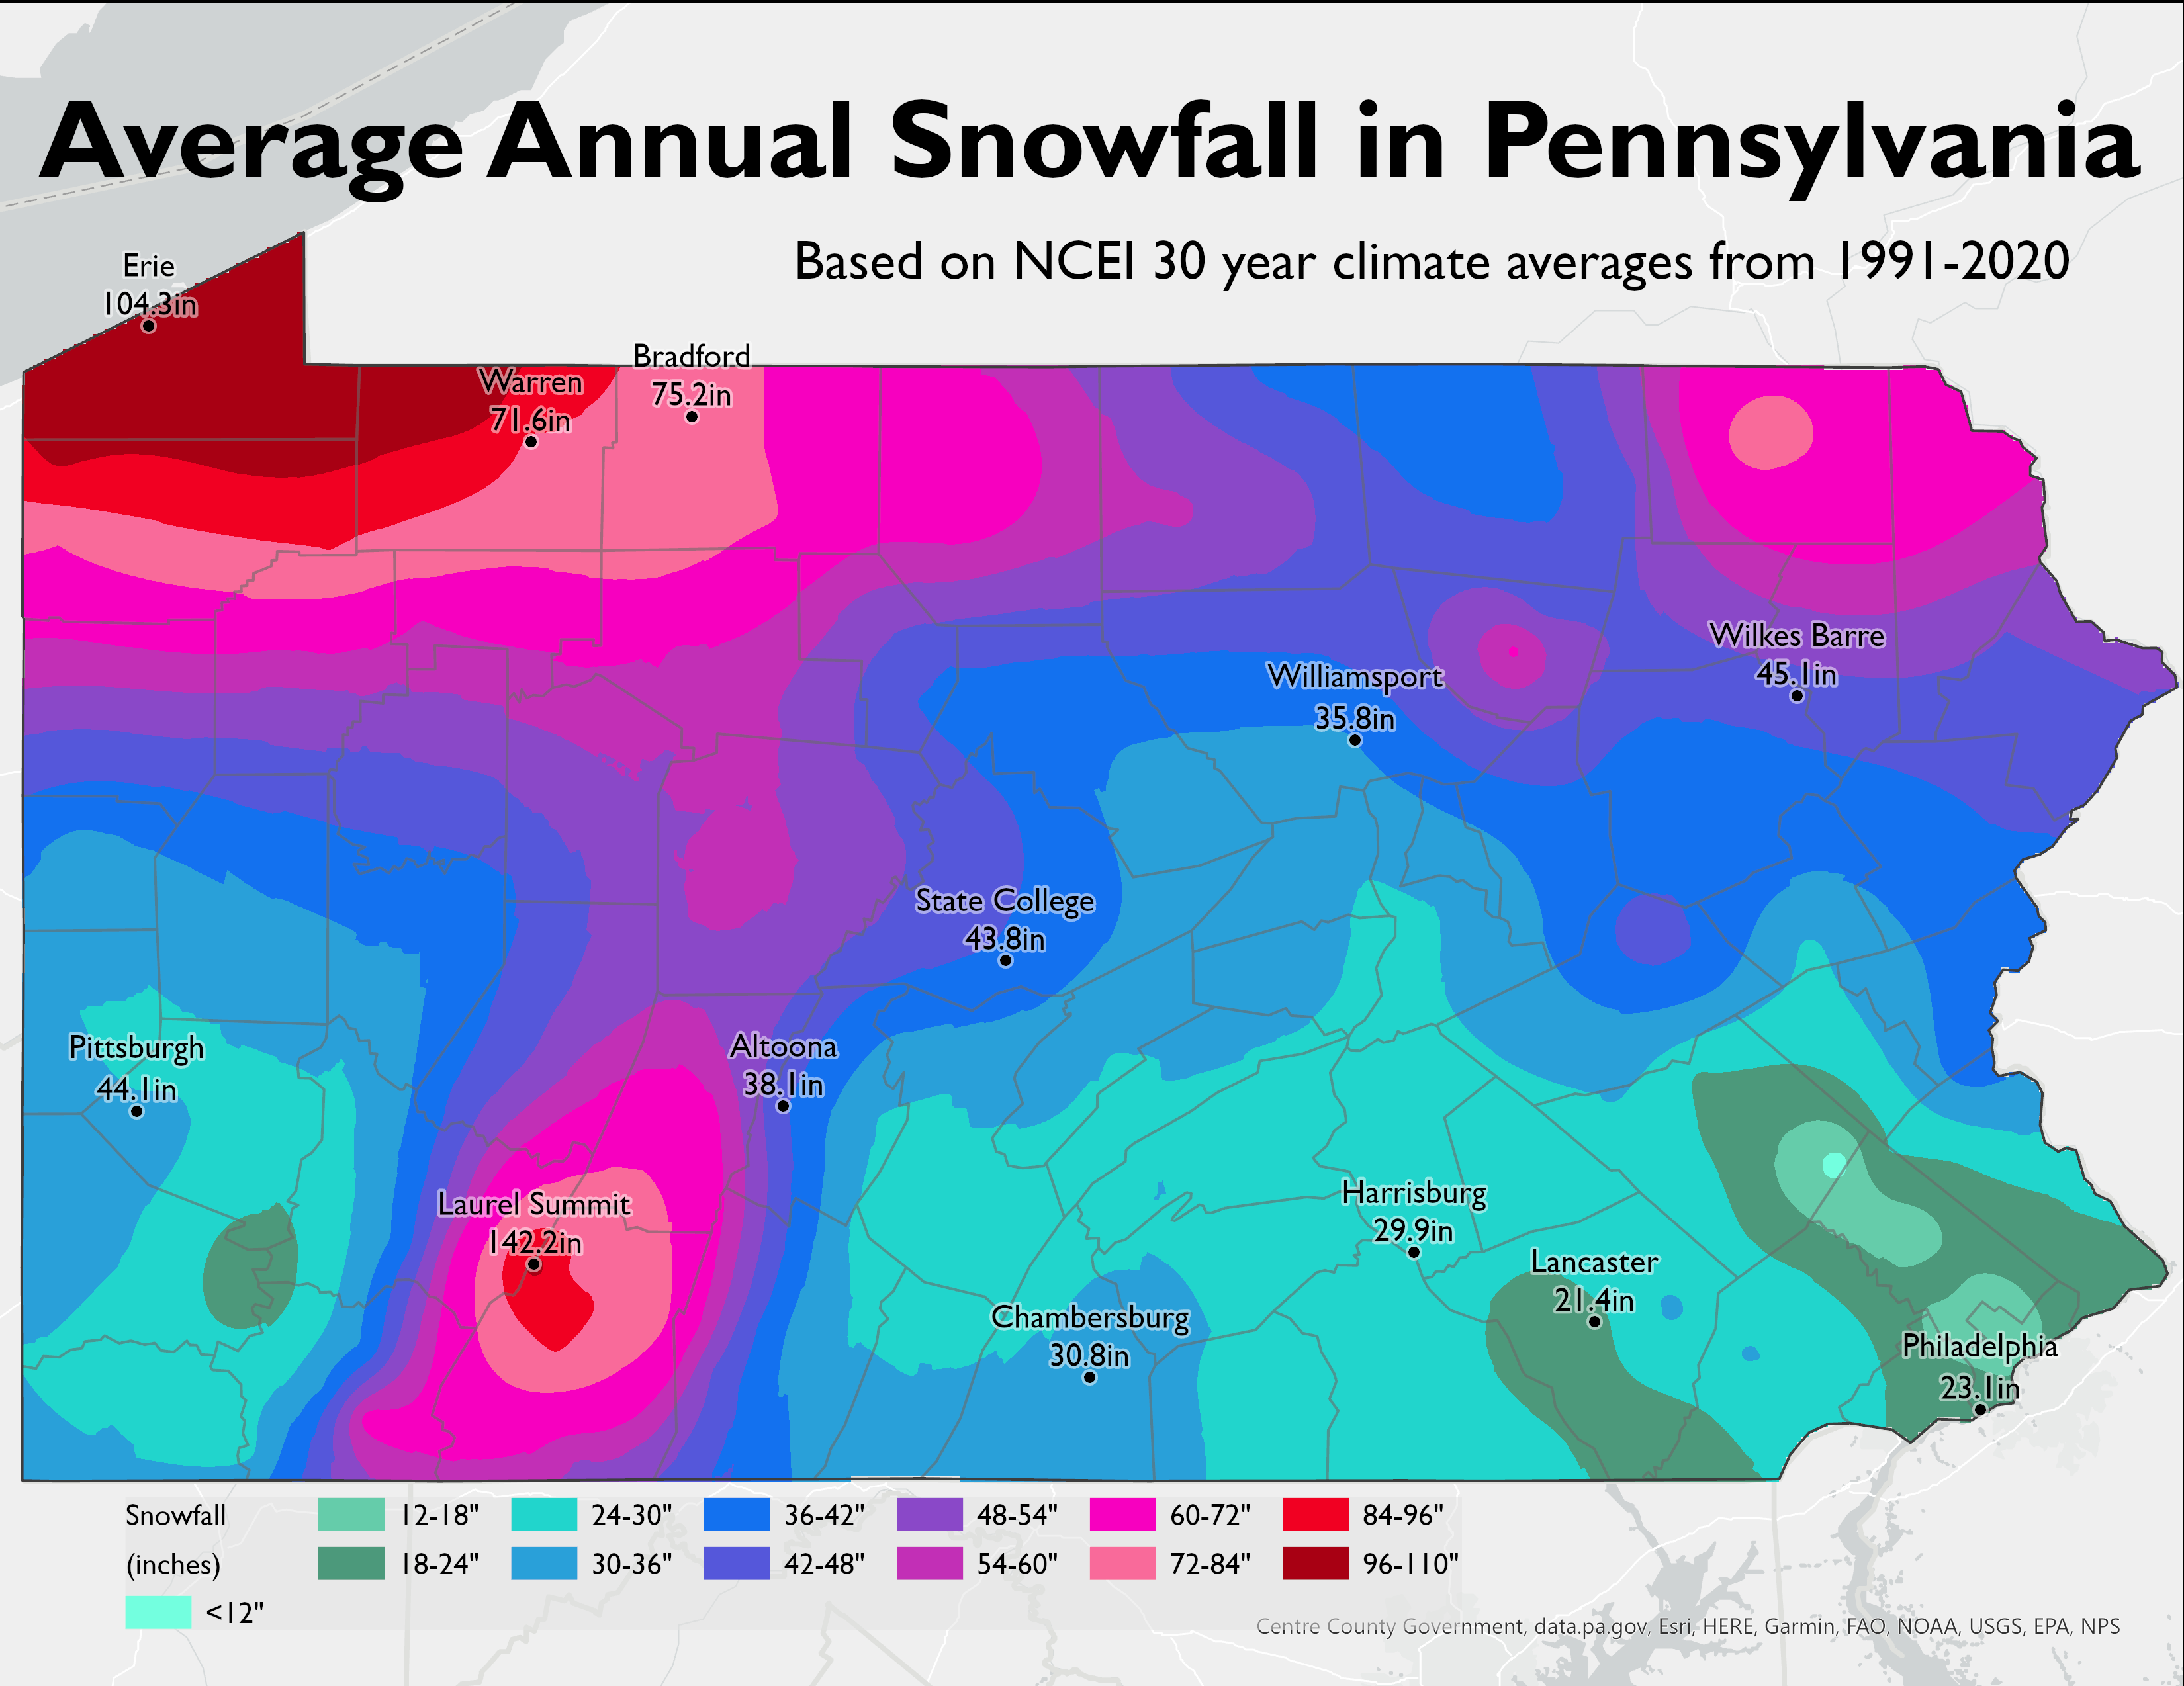
| Average Snowfall (30-Year Average / 1991-2020) | ||
 |
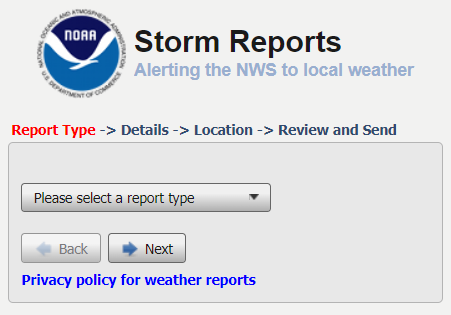
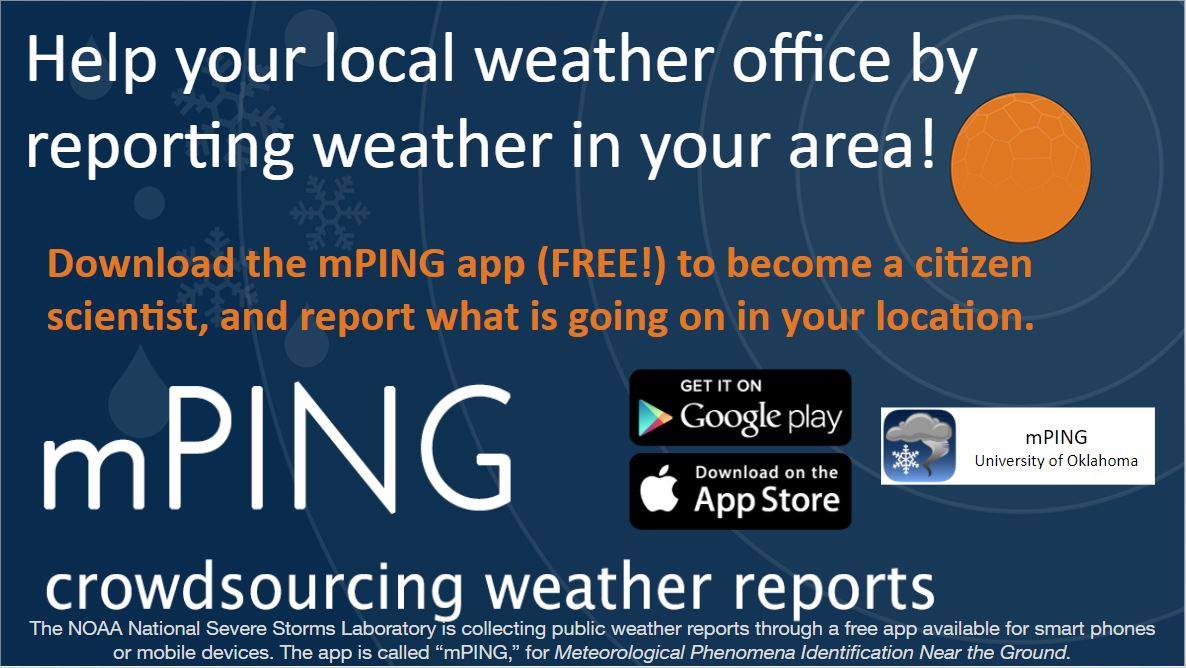
| Report Snow/Ice to the National Weather Service |
| REPORT SNOW/ICE AMOUNTS TO US | REPORT SNOW/ICE IMPACTS TO US |
|---|---|
 |
 |
|
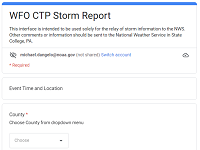
Fill in a Form
|
Send an email to: |
Use Social Media: We are always monitoring
|


 Send Us a Report