|
Recent Text Summaries and Reports |
|
Hourly Data for up to 3 Days Ago |
|
Daily and Monthly Summaries and Historical Extremes |
|
Please see the examples and accompanying example images below.
The records can be found in many ways, but the two easiest are:
|
|
|---|---|
|
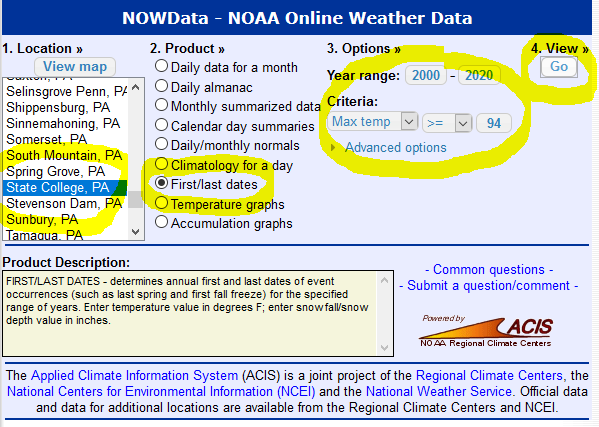
1) Day-by-day:
* Go to "Climate and Past Weather"
* Choose the Location in column #1,
* "Daily almanac" from column #2,
* Select the date from column #3, and
* Hit "GO!"
|
2) Calendar Day Summary:
* Go to "Climate and Past Weather"
* Choose the Location in column #1,
* "Calendar day summaries" from column #2,
* For column #3, leave the Year range at "por (period of record) - 2020",
* Select the variable and summary type, and hit "GO!"
Example: Selecting Max temp and Daily Maximum as the variable and summary type, you'll get the record maximums. (tip: Selecting "Daily Minimum" results in the Lowest High temps (mini maxes))
|

|
Harrisburg | Williamsport | ||||
| New Years Day | Harrisburg | Williamsport | ||||
| PA Farm Show Weeks | Day-By-Day Weather for 1917-Present | |||||
| Easter Day | Harrisburg | Williamsport | ||||
| July 4th (Independence Day) |
Harrisburg | Williamsport | ||||
| Thanksgiving Day | Harrisburg | Williamsport | ||||
| Christmas Day | Harrisburg | Williamsport | ||||
|
ADDITIONAL RESOURCES: |
IMPORTANT: The data available from the various NWS websites are considered preliminary and are usually NOT permissible in court/legal proceedings.
The following two sources (PA State Climatologist and the NCEI) can provide fully-quality-checked documentation which is usually permissible in legal matters.
| Pennsylvania State Climatologist |
NCEI National Center for Environmental Information |
|---|---|
|
The NOAA National Centers for Environmental Information (NCEI) in Asheville, NC may have what you are looking for. NCEI stores all weather information recorded across the US and it's territories since the 1800's. NCEI quality controls the data and publishes it in various forms (a monthly summary is the most common form). They also certify the data for use in court, as well. NCEI's phone #: (828) 271-4800. |
| Severe Weather Events | |
|
(Selected Significant events for Central PA) Searchable "Storm Data" database from NCEI (Gives listing of all severe weather events from 1950) |
State College (STCP1) Climate Data (from PSU Meteorology Department):
|
Etc. |
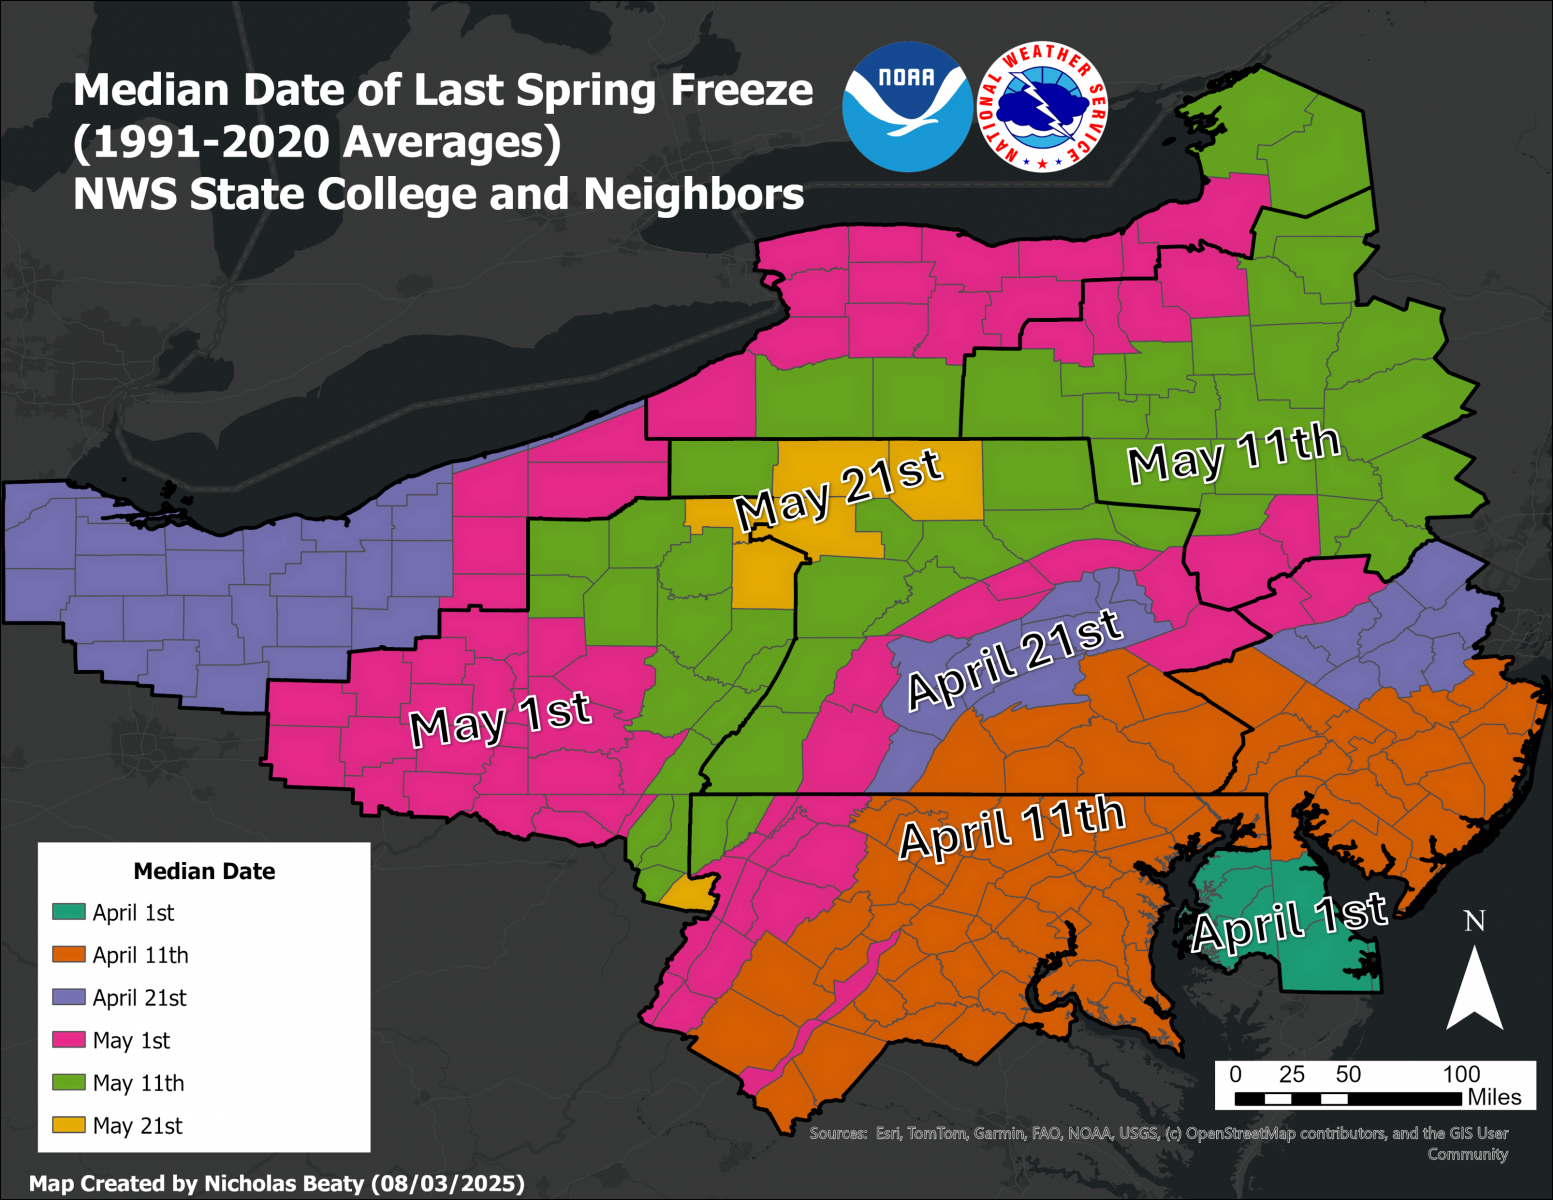
| The BEGINNING of the "growing season" is set by the average date of the last freeze in Spring, and normally happens during very late April to mid May in Central PA. |
Median Date of the Last Freeze in Spring
|
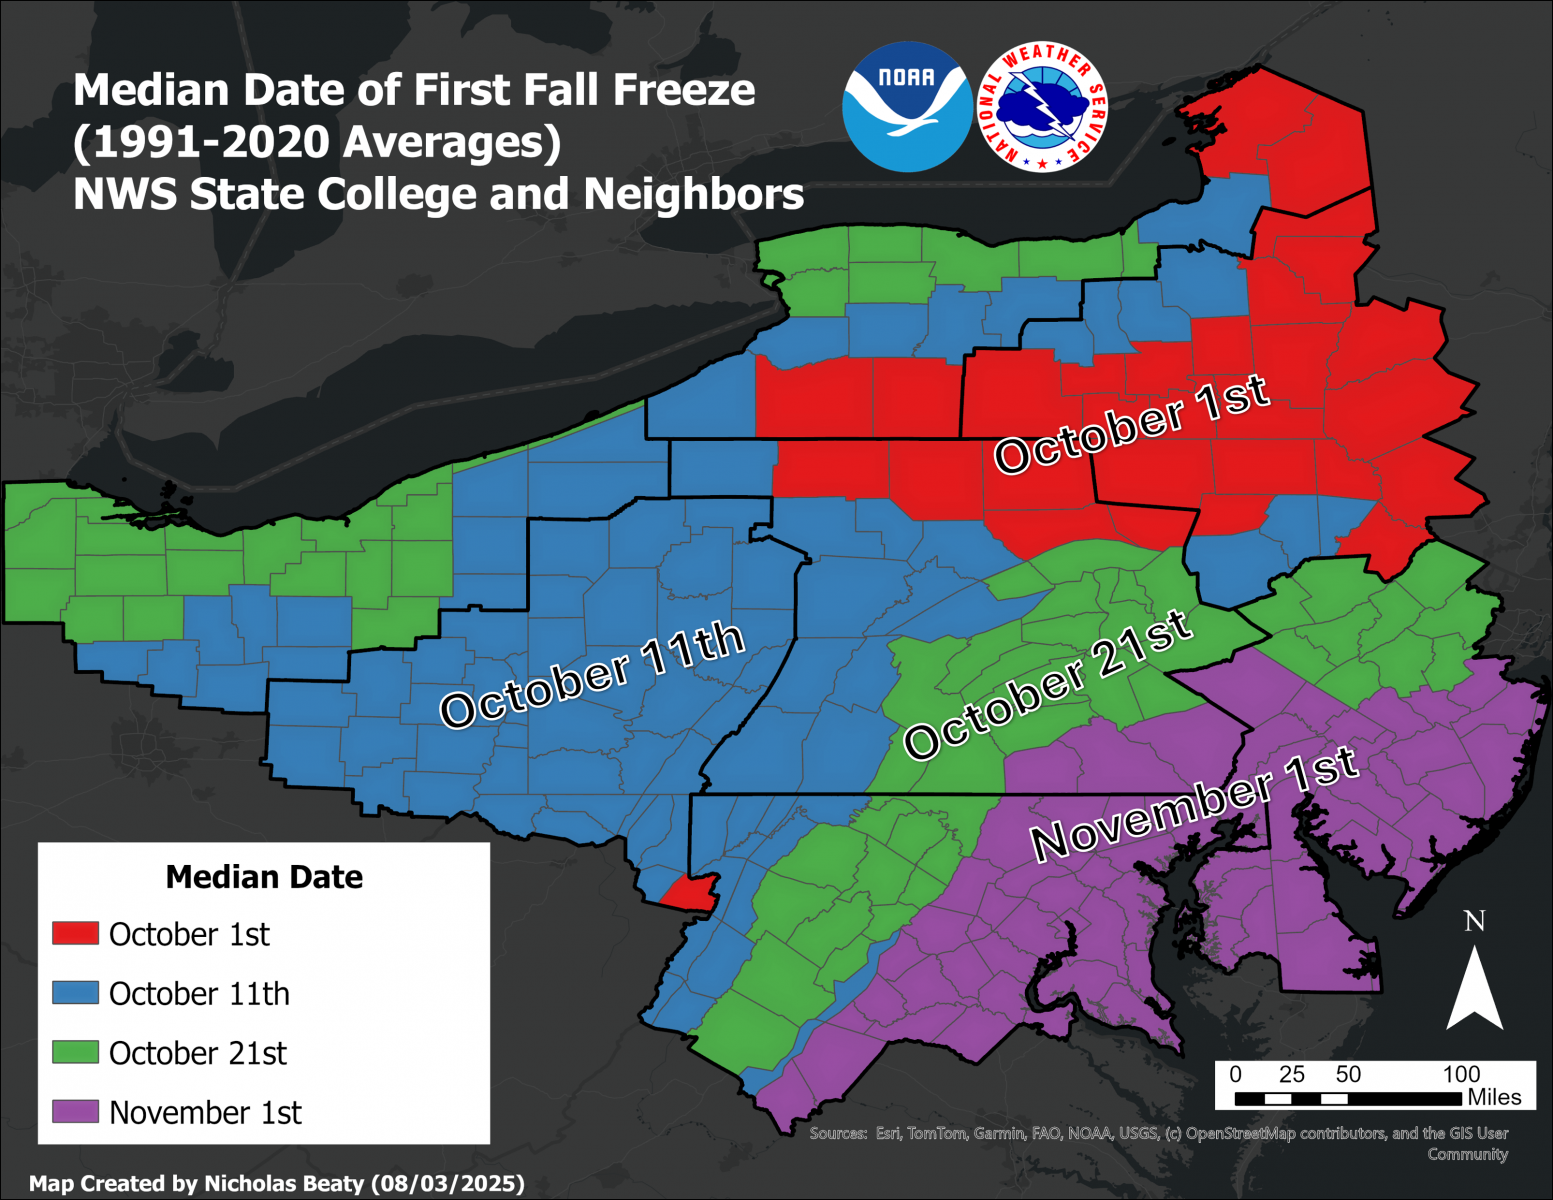
| The END of the "growing season" occurs when most of the county/NWS zone has had it's first freeze in the autumn (1/2 or more of the zone has reached 32°F or below) which usually occurs in October in Central PA. This map for context of when the first freeze usually occurs. |
Median Date of the First Autumn Freeze
|
|
Date of first 36 degree minimum temperature in the Autumn. This may be useful as a (poor man's) proxy for when the average first frost occurs. However, two big caveats are involved in using it that way: 1) 36F at 2m height (standard observation/sensor height) is about when we see the near-ground temps able to get down to freezing. So, by extension frost can occur when the observed temperature is 36F. 2) It needs to be calm and mainly clear. Otherwise frost is much less likely at 33-36F. Freezes can occur even without frost forming, and is mainly possible when it's windy and a strong early-season cold front has moved through. |
We'll work on a map of the data. |
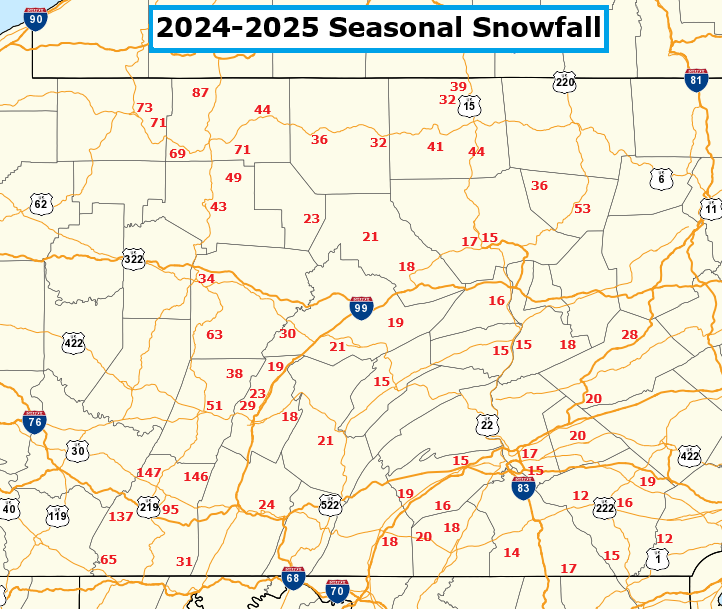
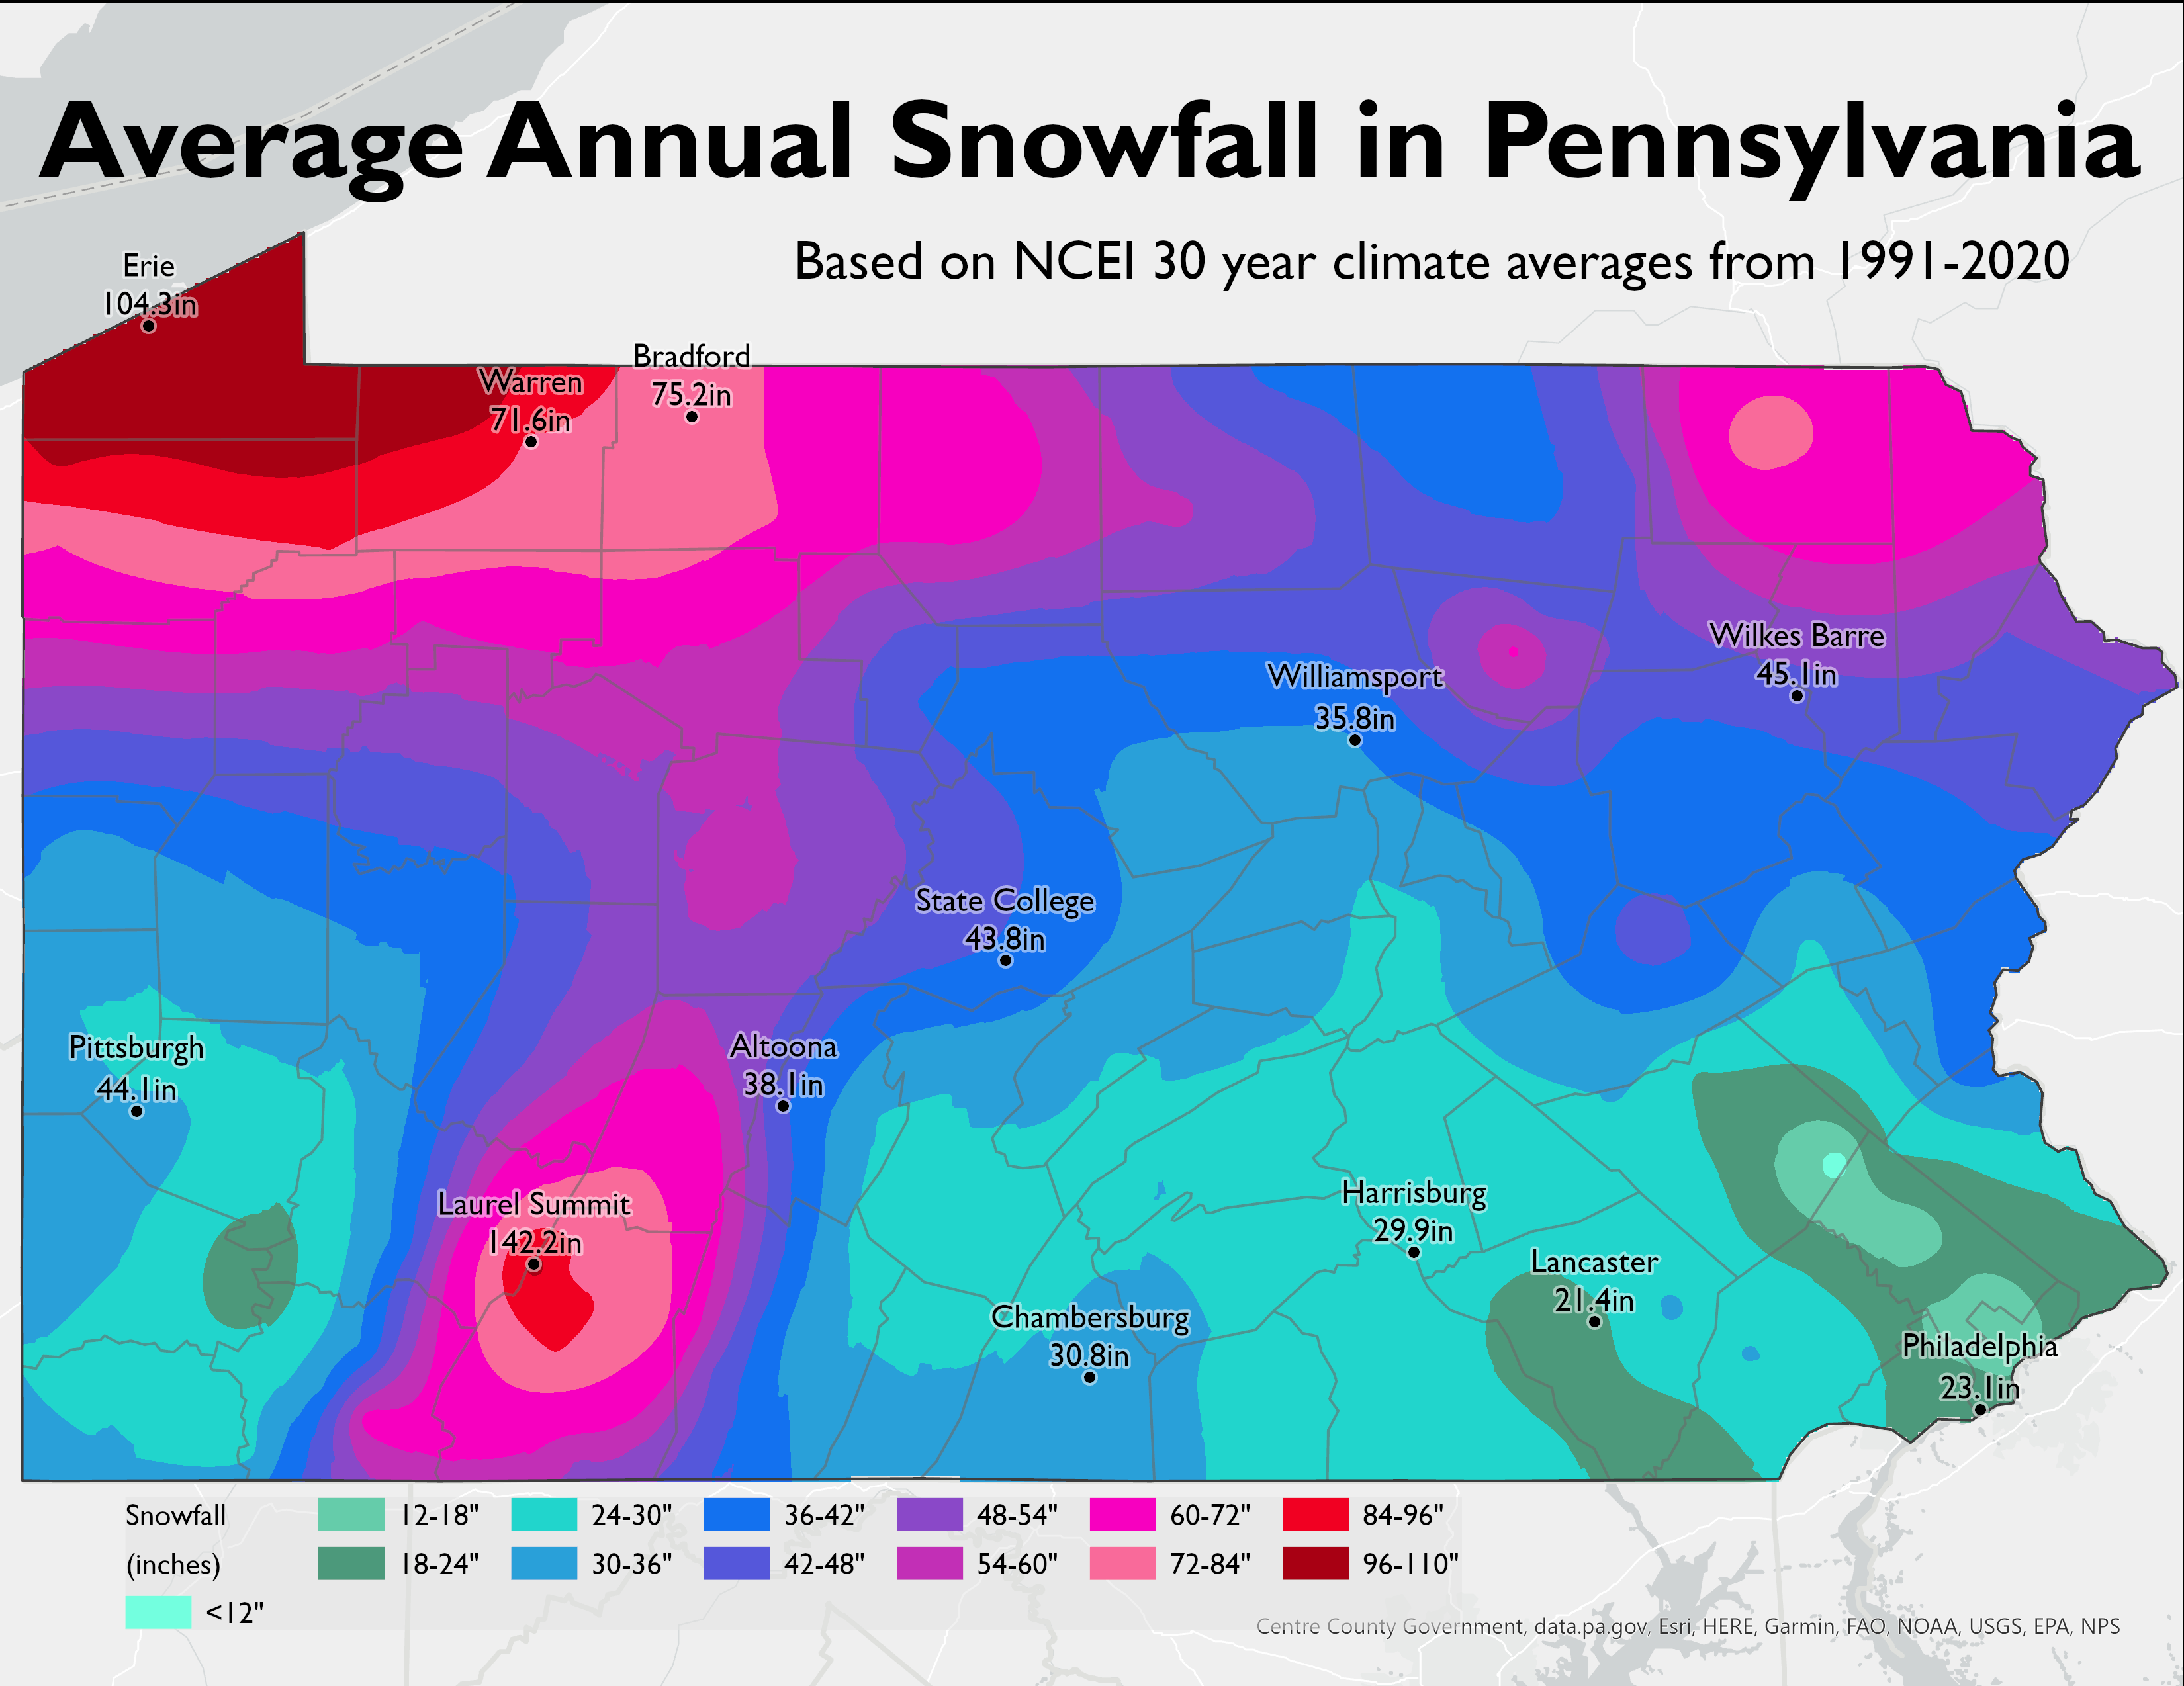
| Seasonal Snowfall Maps | Seasonal Normal Snowfall Map |
 |
 |
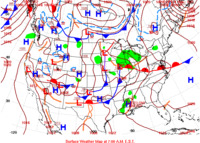
Past Daily Weather Maps On-line (from NWS WPC)
Flood Climatology for Susquehanna Basins

Maps showing common regional names:


 Send Us a Report