| |
|
Seasonal Totals
Select Season:
 |
|
Tip: right click on image above and open in a new window to see the image full-sized (1032x700px)
|
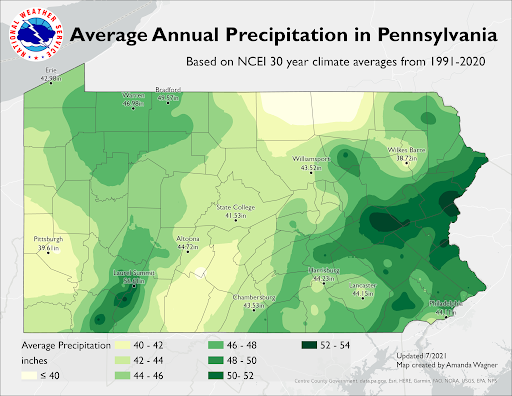
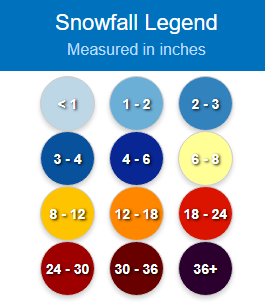
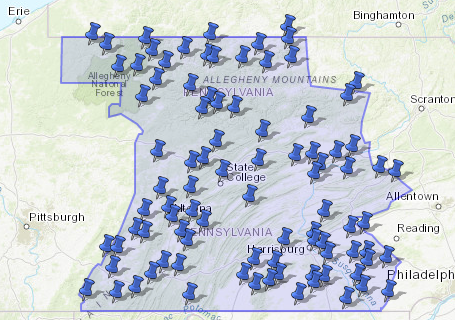
What is normal (average) for my location?
Check the map below, which lists the Average Annual Snowfall for Pennsylvania. Then, if you need further/more-detailed (monthly averages) information, check the Climate Database for a location near you.
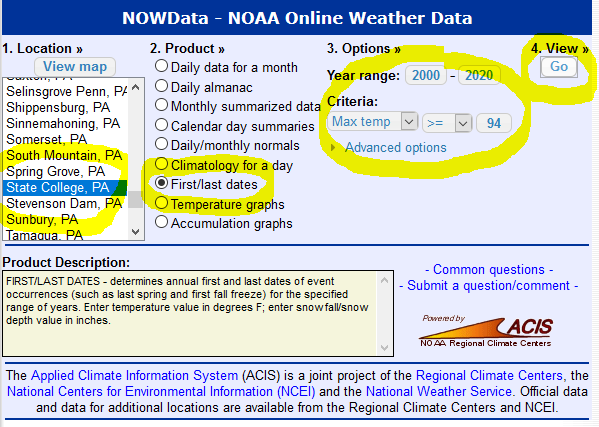
Select:
- "Monthly avgs/totals" from Col #1 (Product)
- Choose a location near to you from Col #2 (Location)
- Select "Snowfall" from Col #3 (Variable)
- Select "1981-2010" from Col#4 (Year)
- Hit "GO!"
|
|
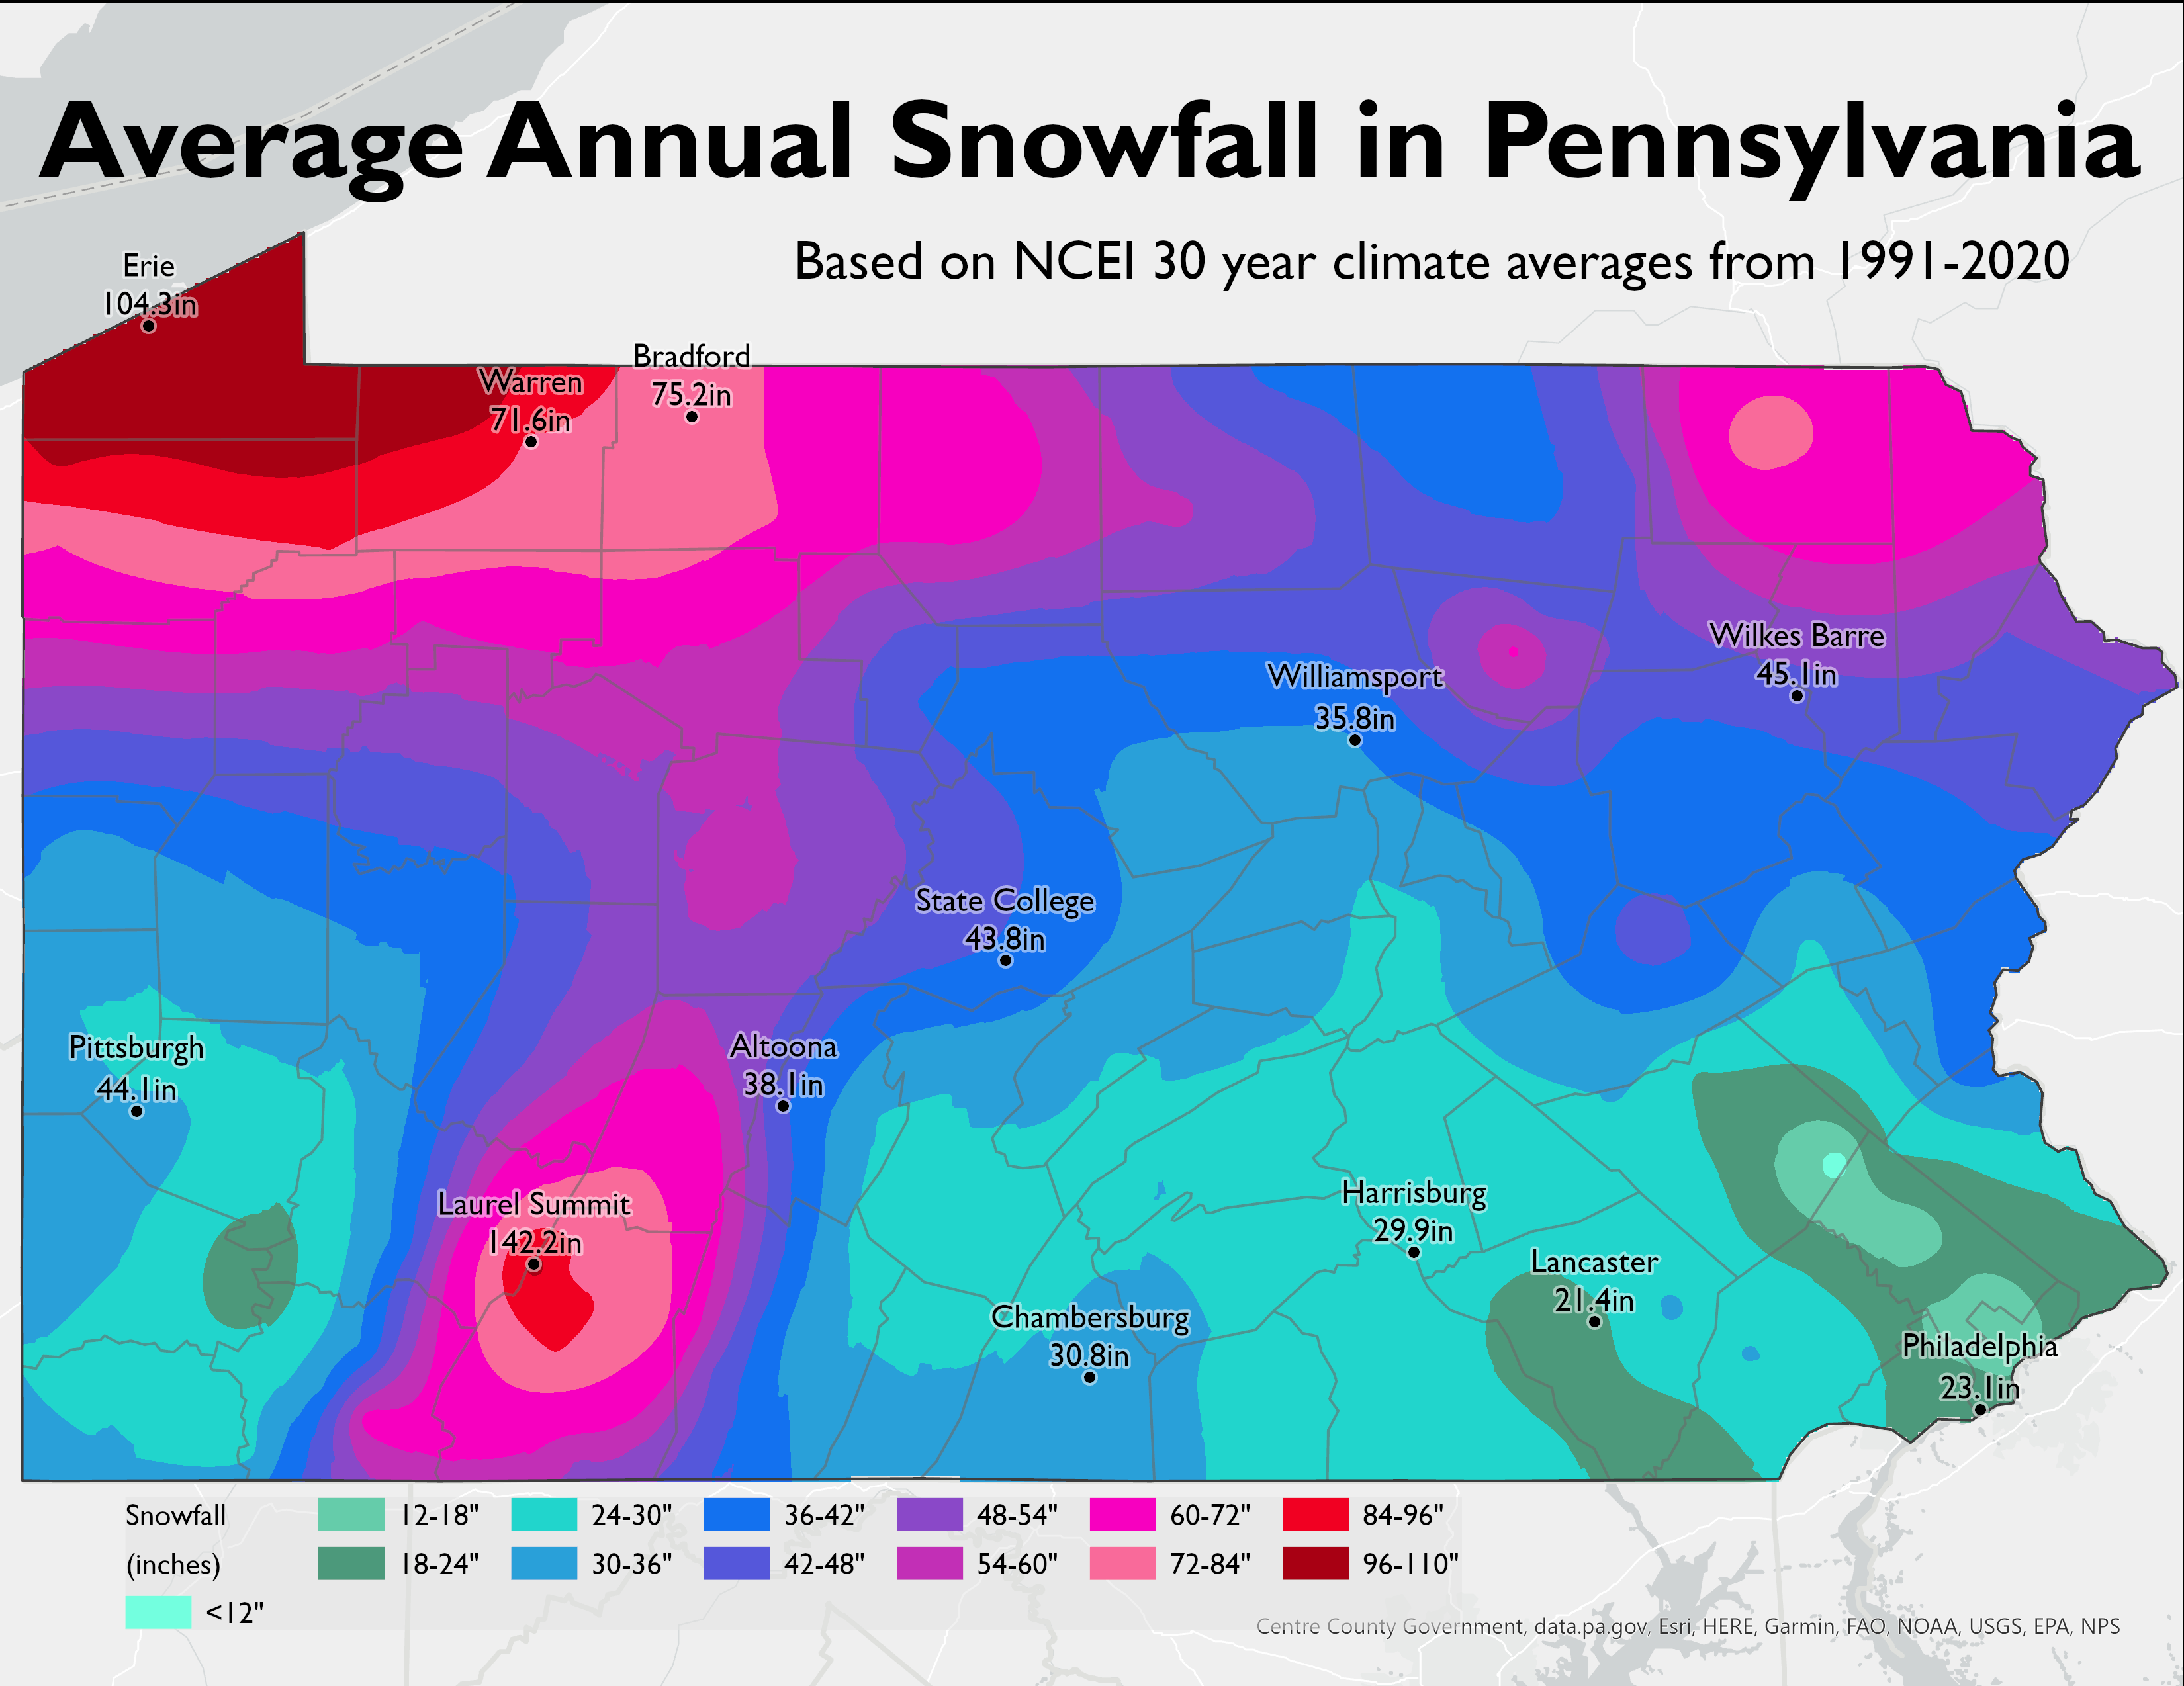
| Location |
Long-Term Average |
30 Year Average
1991-2020 |
| Harrisburg |
33.2
since 1889 |
29.9 |
| State College |
45.9
since 1893 |
43.8 |
| Williamsport |
38.8
since 1895 |
35.8 |
|
|
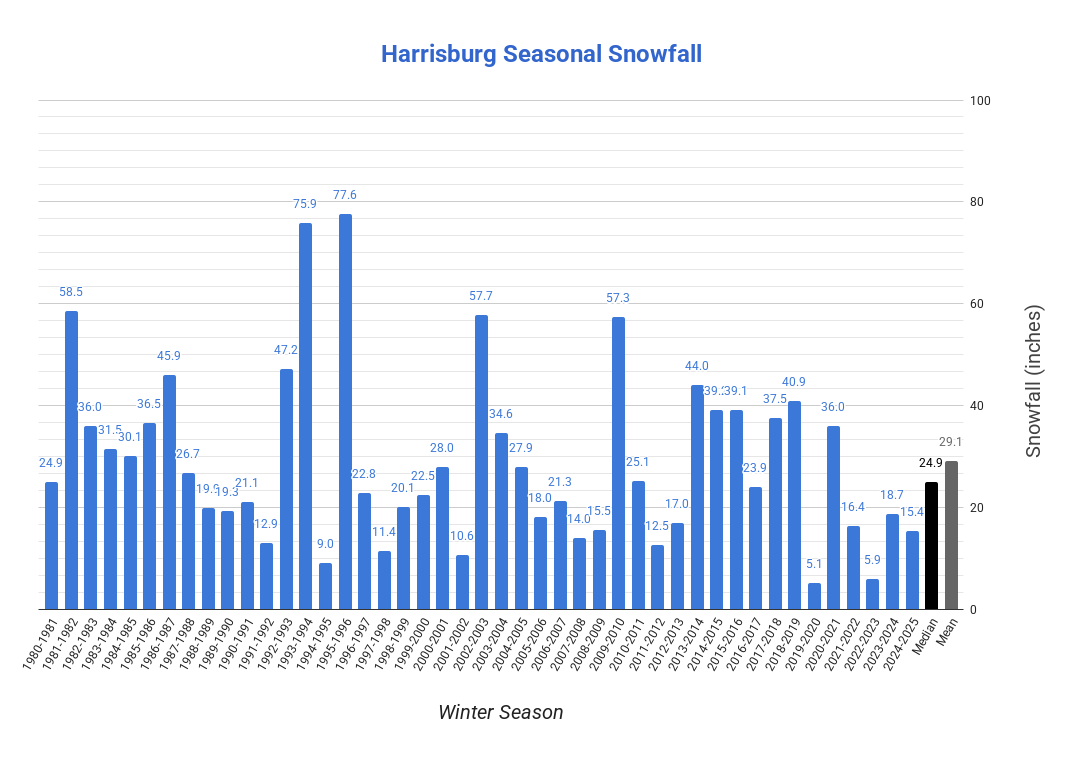
Long-Term Station Snowfall Totals
|
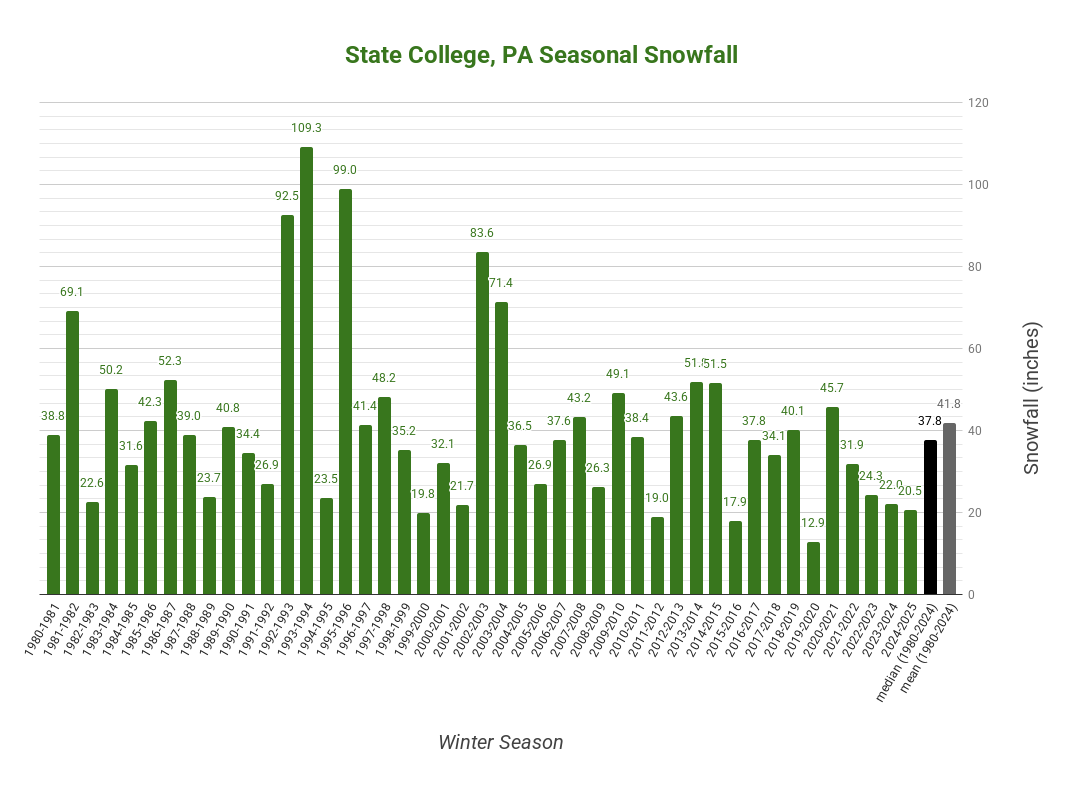
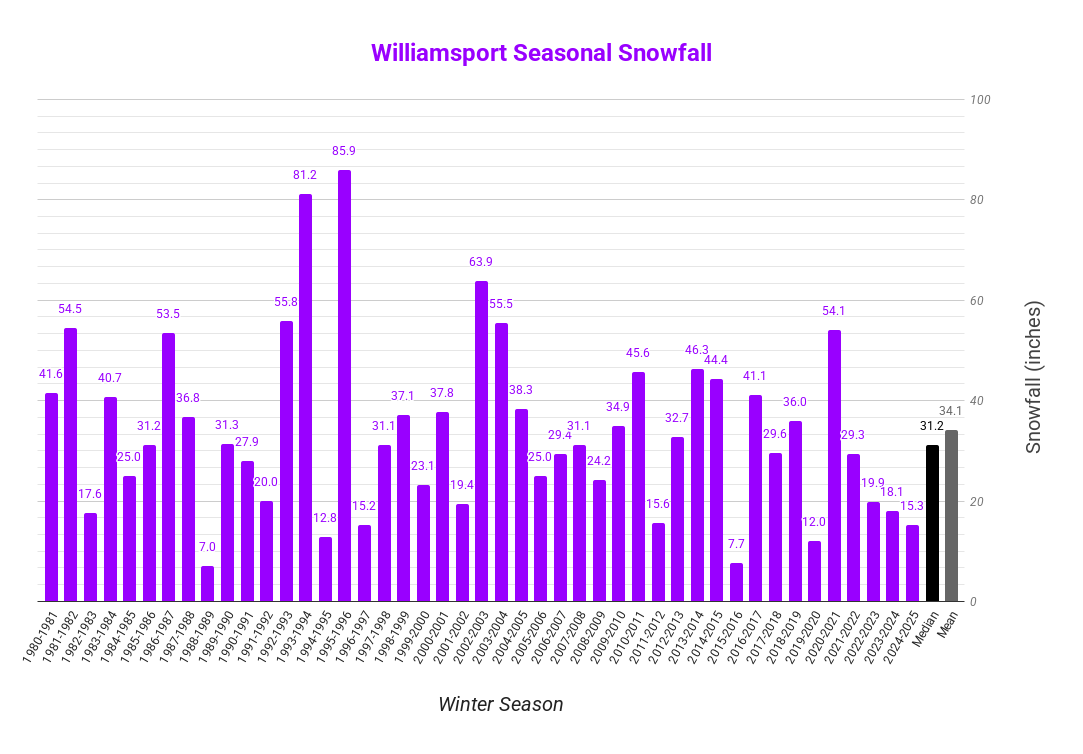
| The following charts show the individual winter season snowfalls since 1980-1981. Continuous weather records have been kept since 1888 in Harrisburg, and since 1895 in both Williamsport and State College. Scroll down to see the larger images. |
 |
 |
 |
|
Harrisburg, PA Site Snowfall for recent winter seasons.
|
|
State College, PA Co-Operative Observation Site Snowfall for recent winter seasons.
|
|
Williamsport, PA Site Snowfall for recent winter seasons.
|
|
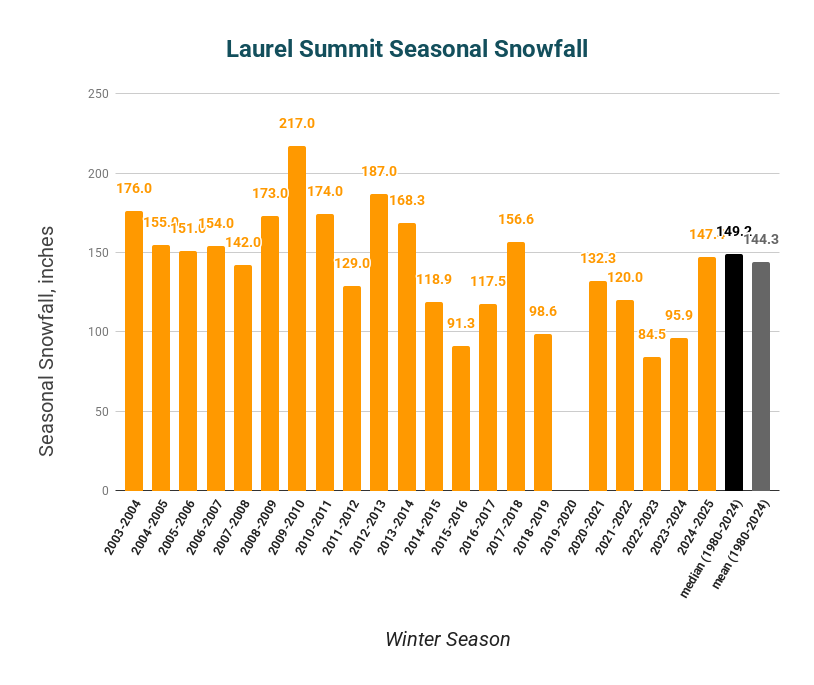
Laurel Summit, PA Co-Operative Observation Site Snowfall for recent winter seasons.
|
|
|


 Send Us a Report