|
Tropical Storm Idalia Struck the Carolinas August 30 Strong December Coastal Storm Brought Severe Flooding Well-Above Normal Temperatures Were Recorded Again in 2023 |
Top Ten Local Weather Events of 2023 (in chronological order)
1) February Heat Wave
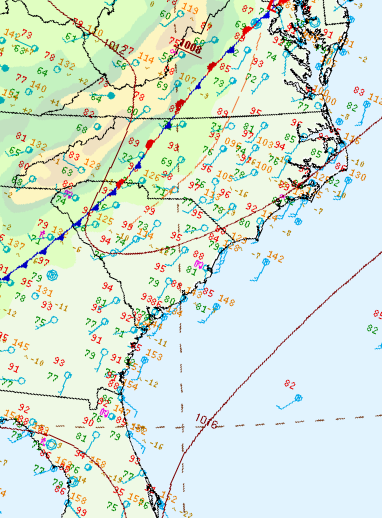
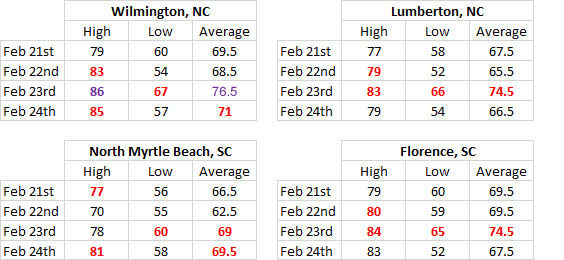
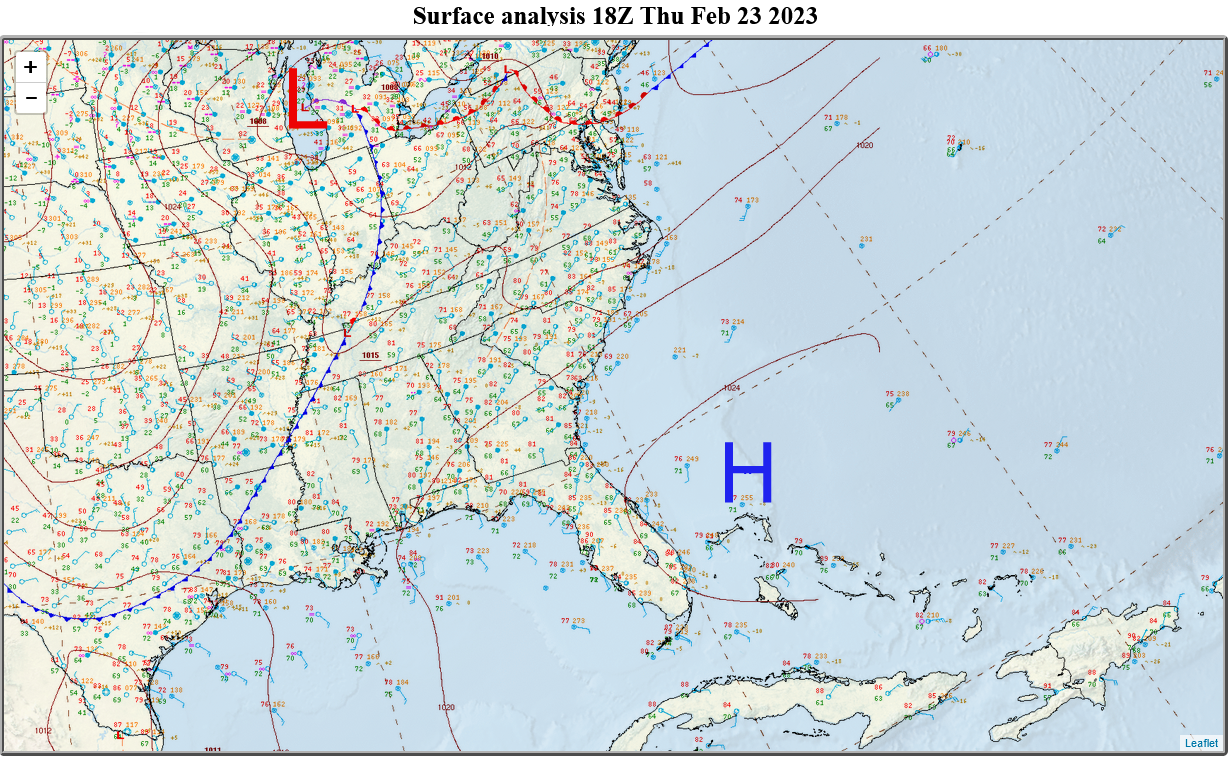
Beginning February 20, high pressure over the Bahamas transported warm air from the Caribbean northward across the Carolinas. Temperatures soared into the 80s between February 21 and 24, setting new record daily high temperatures in many locations. In Wilmington, the 86° temperature measured on February 23 broke the daily, monthly, and winter seasonal record high. Temperature records began in Wilmington in 1874.
|
* RED indicates a daily record value PURPLE indicates a monthly/seasonal record |
|
Surface weather map for 1:00 p.m. EST February 23, 2023. Record high temperatures occurred as Caribbean warmth was brought north by offshore high pressure. |
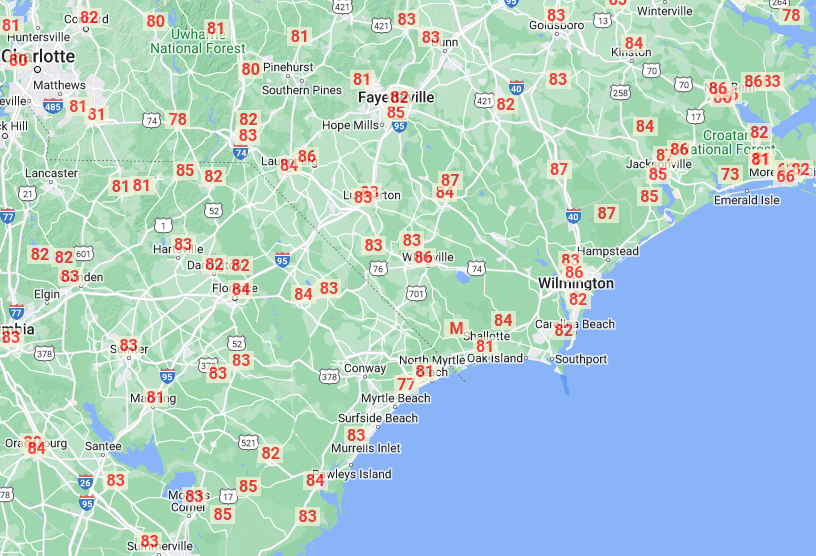
Warmest temperatures observed during the late February 2023 heat wave. |
2) Severe Thunderstorms: April 22
Unstable air ahead of a cold front helped produce multiple rounds of thunderstorms across the eastern Carolinas on April 22. Some of these storms became severe and produced wind damage and reports of large hail. A man in Dillon, SC was hospitalized after he was pinned beneath fallen tree limbs from a severe storm shortly after 5:00 pm. Other reports of fallen trees were received from Loris and Fairmont, while large hail reports were received from Mullins, Little Rock, and Marion, SC. Rainfall totals reached 1.72 inches in Andrews, SC; 1.73 inches in Longs, SC; and 1.91 inches at Bladen Lakes State Forest, NC.
The storms weakened as they approached Wilmington where they only brought 0.79 inches of rain with some lightning.
|
Severe thunderstorms on April 22, 2023 produced hail and wind damage reports across the area |
3) Belville/Leland Flash Flood: May 19
Persistent showers and thunderstorms developed across the Cape Fear area before sunrise on May 19. This was due to humid, unstable air lifted by a small area of low pressure just offshore. An upper level disturbance across the interior portion of North Carolina also helped sustain the thunderstorm clusters as they pushed northwestward and inland across eastern Brunswick County. The heaviest rain fell between 6 and 9 a.m. and reports of over 10 inches of rain were received from two locations in Belville with multiple other reports over six inches in Leland.
Over 20 roads in the Belville/Leland area were closed due to high water. Four homes and three businesses recorded water intrusion.
A National Severe Storms Laboratory analysis estimated rainfall of this intensity occurs, on average, once every 45 years for any location across southeastern North Carolina.
|
Right: Radar loop from 5:22 a.m. to 10:45 a.m. EDT on May 19, 2023 showing heavy rain and thunderstorms that brought over 10 inches of rain and flash flooding to parts of Belville and Leland, NC. |
A detailed summary on this flash flood event written by National Weather Service Wilmington meteorologist Ian Boatman contains additional graphics and an explanation about why this event developed and became so impactful.
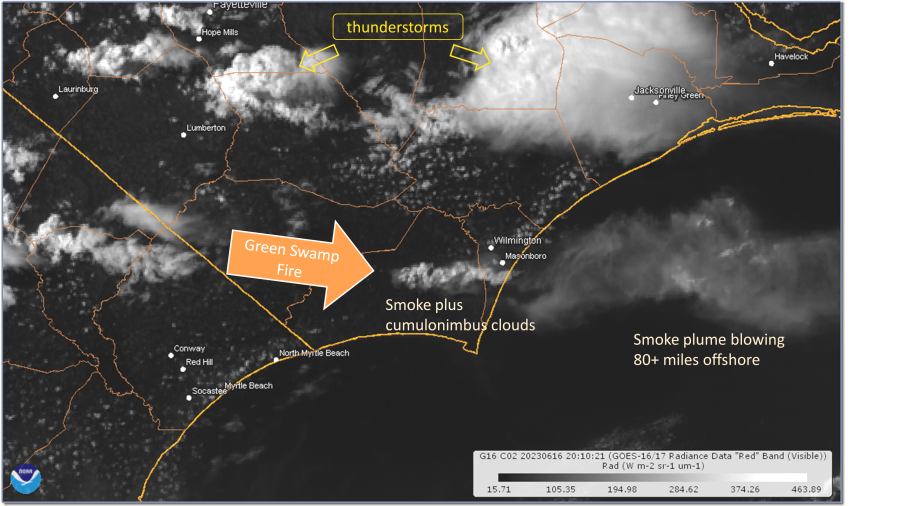
4) Green Swamp Wildfire: Mid-late June
A prescribed burn became uncontrolled in the Green Swamp in Brunswick County, NC on June 14 and grew into a blaze that burned over 15,000 acres over the next couple of weeks. On June 16 the newly-named Pulp Road Fire added so much heat to the environment that convective showers developed from pyrocumulus clouds over eastern Brunswick County. Thick smoke and ash from the fire were observed on radar and satellite streaming over 80 miles off the coast.
|
GOES-16 visible satellite image from the afternoon of June 16, 2023 showing smoke from the fire in the Green Swamp. Puffy pyrocumulus clouds within the smoke plume were produced by heat from the fire. |
Radar loop from June 16, 2023 showing the smoke plume from the Green Swamp wildfire. Convective showers developed within the smoke plume due to heat from the fire. |
 |
The Nature Conservancy published a storymap showing that the net effect of the fire was positive within the Green Swamp preserve.
Plants and animals rebounded quickly as the natural ecosystems (longleaf savannah and pocosin wetlands) found within the Green Swamp actually require periodic fire. According to The Nature Conservancy, grass was observed resprouting only one week after the fire, and orchids were blooming only two weeks later. An estimated 30 percent of the world's wild population of Venus Flytraps live within the Green Swamp preserve and flourish in the years after a fire.
The animation to the right shows images from NASA's Terra satellite from June 10 and August 7, 2023. The fire's burn scar is visible in the center of the image as a dark patch southwest of the city of Wilmington. (Lake Waccamaw is the dark oval in the upper left portion of the image)
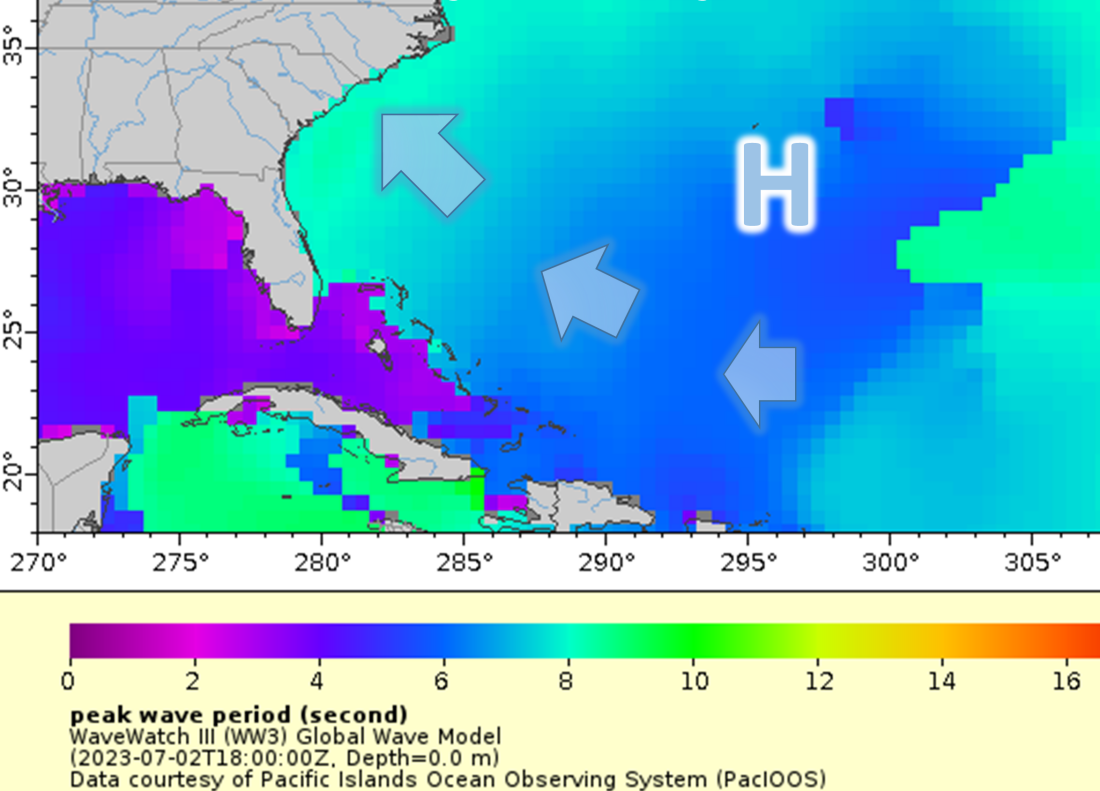
5) Deadly Rip Currents: July 1-4
A long swath of easterly winds south of the Bermuda high created persistent ocean swells that reached the Carolina coast in early July. Strong rip currents developed at local beaches, resulting in hundreds of rescues over a four day period as reported by local lifeguards. Unfortunately there was one rip current-related fatality reported by officials at Fort Fisher, NC on July 1.
|
East-southeasterly swells produced by a long swath of winds south of the Bermuda High caused rip currents at the South and North Carolina beaches in early July |
On July 1, local lifeguards reported they performed 138 rescues of people from rip-currents: 61 in Carolina Beach, 15 in Wrightsville Beach, 11 at Kure Beach, 50 at Fort Fisher, and 1 in Myrtle Beach. This was followed by 124 total rescues on July 2, 90 rescues on July 3, and 46 rescues on July 4.
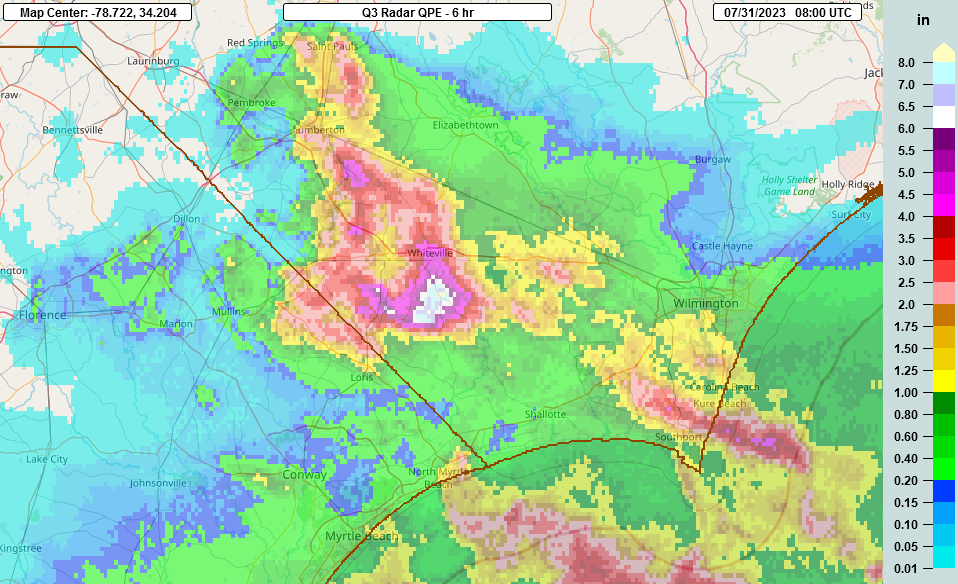
6) Whiteville, NC Flash Flood: July 30-31, 2023
Persistent thunderstorms developed along a slow-moving cold front during the evening of July 30 and continued into the early morning hours of July 31. Heavy rain measured up to six inches caused flash flooding in Columbus County, NC. According to local media reports, flooding extended from Whiteville into Tabor City. Video shared by media showed extensive flooding around homes and across highways. Local law enforcement reported flooding on Washington Street, JK Powell Blvd., NC Highway 130, and Gores Trailer Road near Whiteville.
|
Storm Total Precipitation Estimates from radar showing over six inches of rain near Whiteville, NC on July 31, 2023 |
Surface weather map for the early morning of July 31, 2023 shows a front just south of Cape Fear. Thunderstorms dropped their heavy rain along and north of the boundary. |
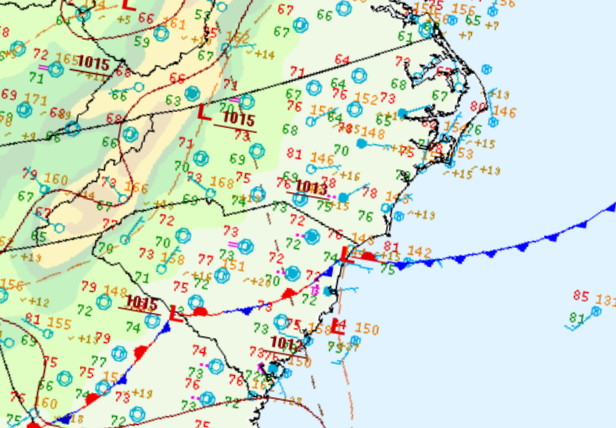
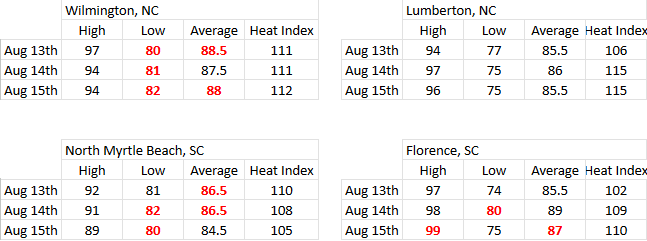
7) Mid-August Heatwave
Hot high pressure built across the Carolinas during mid August bringing daytime temperatures in the upper 90s and very high humidity. Even more unusual than the daytime heat was the extremely warm nights: low temperatures remained in the 80s for three consecutive nights in Wilmington (August 13-15) which is the second longest string of such oppressive heat on record. Myrtle Beach had similar nighttime temperatures and recorded the third longest string of 80+ degree lows in that city.
Highs in Wilmington and Lumberton, NC both reached 97 degrees during this heat wave, the warmest of the entire year. Florence, SC had highs of 97, 98, and 99 degrees from the 13th through the 15th and also recorded a nighttime low temperature of 80 degrees on August 14th, only the ninth time in the city's history it had remained so warm at night.
Heat index values (the apparent temperature when humidity is taken into account) exceeded 110 degrees in Wilmington each day from August 13 to 15. Dewpoints were in the upper 70s to near 80 degrees. Lumberton saw heat indices of 115 degrees on two days, indicative of exceptionally dangerous conditions for those outdoors without access to shade or water.
|
* RED indicates a daily record was tied or broken At right: Surface weather map from August 15, 2023 showing hot temperatures and very high dewpoints across the eastern Carolinas. |
 |
8) Tropical Storm Idalia: August 30
|
Radar loop of Idalia making landfall on the Florida Gulf coast as a category 3 hurricane, then weakening and moving along the South and North Carolina coast as a tropical storm on August 30. |
Storm total rainfall from volunteer and official reporting stations across southeastern NC and northeastern SC during the passage of Tropical Storm Idalia. A complete list is available at this link. |
Category 3 Hurricane Idalia struck the Florida Gulf coast with significant storm surge on August 30, causing wind damage across a broad area of Florida's Big Bend region. Weakening as it pushed inland across Georgia, Idalia was a tropical storm as it moved northeastward along the South and North Carolina coast. Idalia brought heavy rainfall with totals of five to 10 inches reported in some locations, resulting in flash flooding from Conway, SC north through Tabor City and into Whiteville, NC. Minor coastal flooding occurred with tide levels 1 to 3 feet above flood stage which resulted in some inundation in low-lying beach communities.
Tornadoes touched down in a number of locations including Cherry Grove, Yaupon Beach, Leland, and Silver Lake just south of Wilmington.
|
Radar loop of two tornadoes on the ground simultaneously during Tropical Storm Idalia: one just south of Leland in Brunswick County (110 mph, EF1), and another near Myrtle Grove south of Wilmington (100 mph, EF1). Left image is reflectivity; right is storm-relative velocity. |
||
|
9) Fall Drought: October to early December
Tropical Storm Ophelia made landfall just west of Cape Lookout on September 23. A long period of unusually dry weather began the next day across the eastern Carolinas and persisted for the next couple of months. Accumulated rainfall deficits exceeded 6.8 inches in Wilmington. In Florence total rainfall during the period September 24 to December 9 was only 3.22 inches, the 8th lowest rainfall total observed in Florence over that time span since the city's climate records began in 1948.
Moderate to locally severe drought gradually developed across eastern portions of North and South Carolina. Given the season, local agricultural and water supply impacts were limited in scope. Drought was more impactful across the western Carolinas where lake levels fell and multiple large wildfires occurred across the mountains.
|
U.S. Drought Monitor during late November showing moderate to severe drought covering a portion of eastern North and South Carolina. More significant drought, D3 (Extreme Drought), was occurring across the western portions of the Carolinas. |
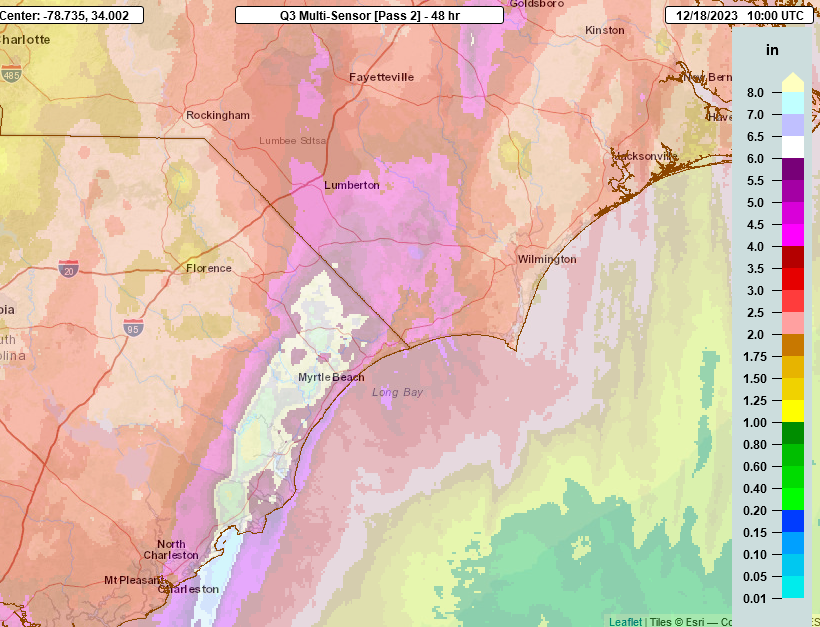
10) Major Coastal Storm: December 17
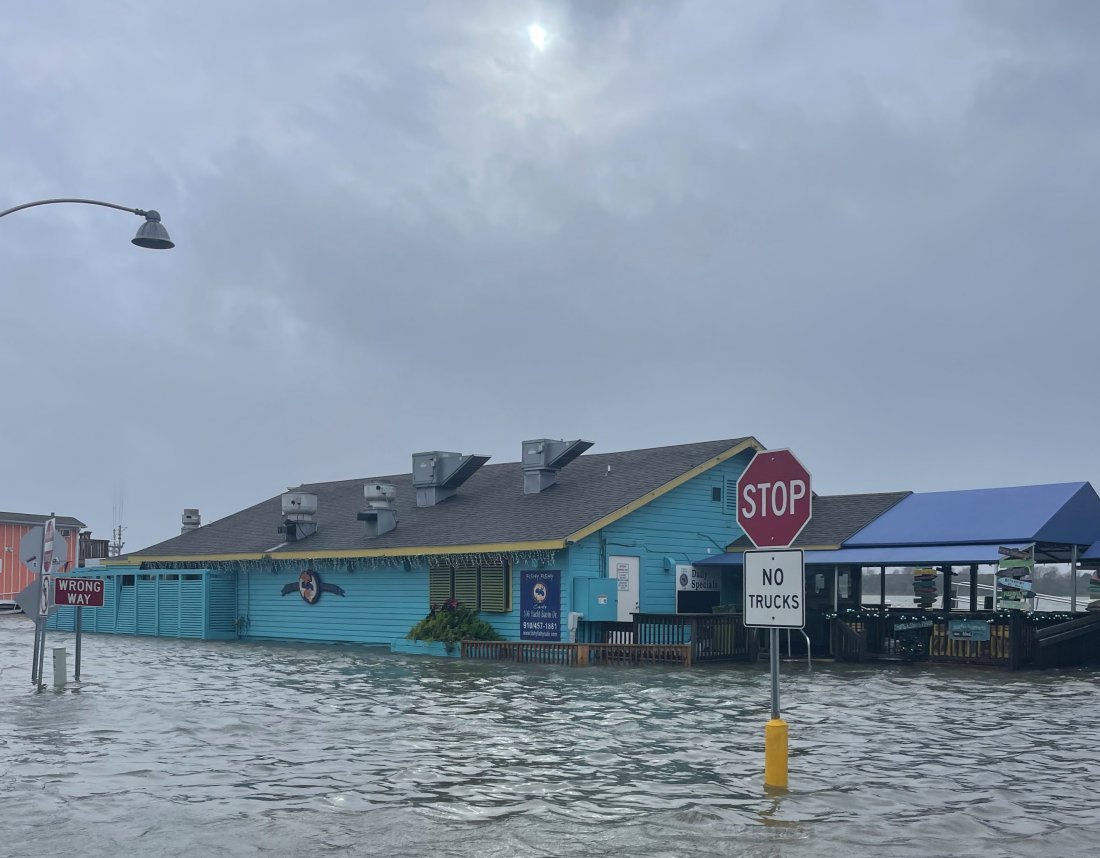
A strong low system developed in the Gulf of America, crossed Florida, and moved along the coastline of South and North Carolina on December 17. This was the strongest storm of the entire year to affect the area and brought multiple weather impacts including flash flooding from heavy rainfall in Georgetown and Conway, SC; extensive tidal flooding in Myrtle Beach; straight-line wind damage in Florence, SC; and even a tornado touchdown near Socastee, SC.
|
WPDE viewer-submitted video of the tornado on the Intracoastal Waterway at Riverside Drive. |
Radar loop of the Socastee tornado on December 17, 2023 |
Just offshore, wave heights reached 23 feet at the Frying Pan Shoals buoy and wind gusts were measured as high as 67 mph. In Wilmington, the barometric pressure fell to 29.10 inches (985.4 millibars) which is tied for the 18th lowest pressure measured in local climate history. This storm system was as impactful as a strong tropical storm or weak hurricane but was of non-tropical origin, intensifying along the boundary between warm and cool airmasses.
 Radar loop from the early morning of December 16 through the evening of December 17, 2023 Radar loop from the early morning of December 16 through the evening of December 17, 2023 |
Exceptionally heavy rainfall occurred, resulting in flash flooding across portions of northeastern South Carolina. Gauge-measured rainfall totals rivaled those observed during the passage of tropical storms and hurricanes. Law enforcement from Georgetown and Murrells Inlet responded to a number of rescue calls to stranded vehicles and flooded homes. Conway city officials reported that portions of Highways 701, 501, and 378 were closed due to high water. SC Highway 19 was washed out approximately five miles west of Loris. In Georgetown, the intersection of Dozier St. and Prince St. was covered in three feet of water according to a public report received shortly before 4:00 pm.
The average winter (December through February) rainfall total across coastal South Carolina is 9 to 10 inches. Several locations listed below received an entire winter's rainfall in a single day.
|
Multi-radar Multi-sensor (MRMS) rainfall estimates show a large area of rainfall in excess of six inches across interior Georgetown and Horry counties in South Carolina. This resulted in significant flash flooding. |
|
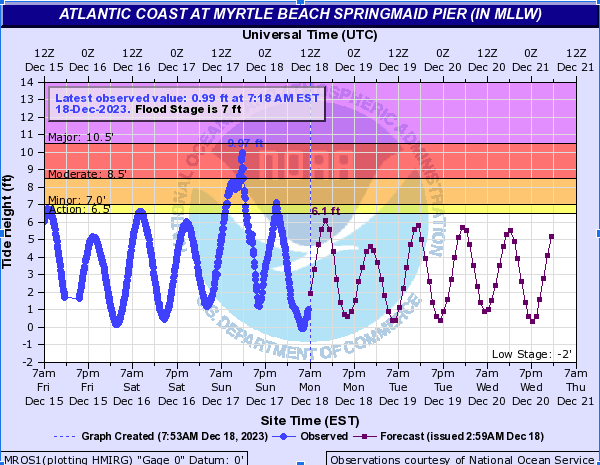
Significant coastal flooding also occurred, especially south of Cape Fear. Flash flooding in Georgetown county was likely enhanced by high coastal water levels. This led to road closures in Georgetown including Highway 17 from Highmarket Street to the Sampit River Bridge.
|
Myrtle Beach's peak water level was 9.97 feet MLLW on December 17, almost 3 feet above flood stage.
|
List of Peak Wind Gusts | List of Rainfall Totals | Details on the Socastee Tornado | Storm Summary from SC Climate Office
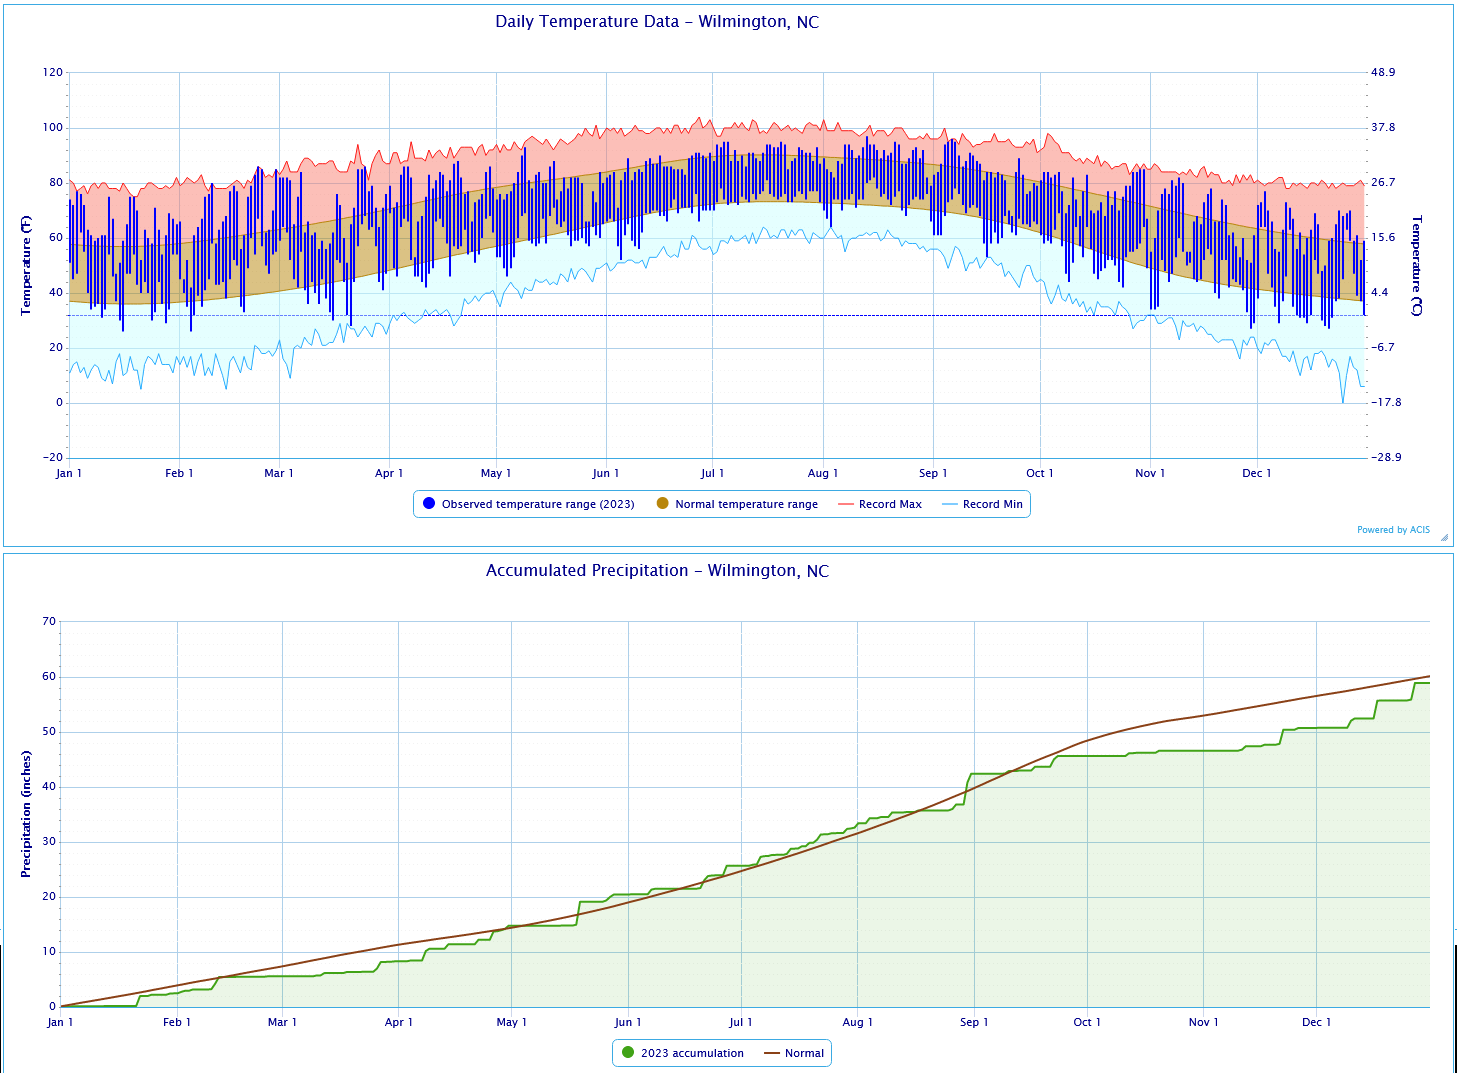
2023 City Climate Summaries
Monthly observed average temperatures and rainfall totals with departures from normal
Wilmington, North Carolina
     Avg Hi/Dep   Avg Lo/Dep   Avg T/Dep   Warmest   Coolest   Precip/Dep
JAN   64.6/+7.4    41.7/+5.4   53.1/+6.3   77/3rd    26/16th   2.48/-1.33
FEB   68.6/+8.3    45.4/+7.0   57.0/+7.7   86/23rd   26/4th    3.10/-0.37
MAR   70.4/+3.9    47.7/+3.6   59.0/+3.7   86/25th   28/21st   2.74/-1.23
APR   77.9/+3.3    56.4/+3.8   67.1/+3.5   88/20th   42/11th   6.45/+3.38
MAY   79.6/-1.5    59.7/-1.4   69.7/-1.4   93/9th    46/4th    5.70/+1.16
JUN   85.9/-1.1    66.5/-2.8   76.2/-2.0   91/30th   52/5th    5.20/-0.47
JUL   90.9/+0.9    74.8/+1.8   82.9/+1.4   95/20th   70/1st    6.94/+0.08
AUG   89.8/+1.5    73.6/+1.9   81.7/+1.7   98/13th   64/3rd    9.80/+1.64
SEP   84.6/+0.7    65.7/-1.0   75.2/-0.1   96/6th    53/16th   3.21/-5.48
OCT   76.9/+0.8    54.2/-1.4   65.5/-0.4   85/30th   42/24th   0.99/-3.67
NOV   66.9/-0.5    44.8/+0.0   55.9/-0.2   82/9th    27/29th   4.13/+0.57
DEC   63.3/+3.0    40.9/+1.8   52.1/+2.4   77/3rd    27/21st   8.18/+4.49
--------------------------------------------------------------------------
ANN   76.6/+2.2    56.0/+1.6   66.3/+1.9   97/Aug    26/Feb   58.92/-1.23


Number of days with Temperatures...
90 degrees or higher:  52 (7 more than normal)
32 degrees or lower:   23 (14 fewer than normal)

Heating degree days: 1692 (634 fewer than normal)
Cooling degree days: 2265 (132 more than normal)

Number of days with precipitation...
0.01" or greater: 118 (4 fewer than normal)
0.10" or greater:  75 (4 fewer than normal)
0.50" or greater:  37 (1 more than normal)
1.00" or greater:  17 (1 fewer than normal)

Thunderstorms occurred on 56 days.
No snow or sleet occurred fell.

Average wind speed: 7.5 MPH
Maximum 2-minute wind speed: 41 mph on August 10 (Thunderstorm)
Maximum 5-second wind gust: 58 mph on December 11 (Line of heavy showers)

Notes: Wilmington's 2023 average temperature was tied for the third warmest
on record behind 1990 and 2019.
The number of days with low temperatures at or above 80 degrees (4) was tied
for the fourth largest number on record behind 2020, 2022, and 1999.
|
2023 Climate Summary for Wilmington, NC |
Florence, South Carolina
     Avg Hi/Dep   Avg Lo/Dep   Avg T/Dep   Warmest   Coolest   Precip/Dep
JAN   62.4/+5.3    39.9/+3.9   51.1/+4.5   76/3rd    24/16th   4.98/+1.90
FEB   67.5/+6.7    44.6/+6.0   56.0/+6.3   84/23rd   28/4th    3.05/+0.05
MAR   69.4/+1.1    46.2/+1.9   57.8/+1.5   87/24th   27/21st   4.66/+1.47
APR   77.5/+0.8    52.1/+0.0   64.8/+0.4   87/19th   35/11th   3.42/+0.42
MAY   79.5/-4.0    57.6/-3.3   68.5/-3.7   93/9th    40/4th    1.99/-1.72
JUN   86.2/-3.0    64.8/-4.2   75.5/-3.6   92/26th   54/10th   3.26/-1.35
JUL   92.1/+0.1    73.0/+0.6   82.5/+0.3   97/4th    68/11th   8.80/+3.00
AUG   92.0/+1.7    72.0/+0.6   82.0/+1.1  100/26th   64/24th   7.26/+2.40
SEP   84.4/-1.0    63.9/-1.9   74.2/-1.4   97/6th    54/16th   2.28/-2.25
OCT   76.9/+0.2    52.5/-1.8   64.7/-0.8   86/30th   37/24th   0.98/-2.44
NOV   66.7/-0.3    42.7/-0.8   54.7/-0.6   83/9th    27/30th   2.21/-0.42
DEC   62.0/+2.6    38.8/+0.5   50.4/+1.5   77/9th    25/21st   3.58/+0.11
--------------------------------------------------------------------------
ANN   76.4/+0.8    54.0/+0.1   65.2/+0.5  100/Aug    24/Jan   46.47/+1.17


Number of days with Temperatures...
90 degrees or higher:  66 (4 fewer than normal)
32 degrees or lower:   32 (1 fewer than normal)

Heating degree days: 1924 (410 fewer than normal)
Cooling degree days: 2103 (154 fewer than normal)

Number of days with precipitation...
0.01" or greater: 110 (1 fewer than normal)
0.10" or greater:  71 (2 fewer than normal)
0.50" or greater:  24 (6 fewer than normal)
1.00" or greater:  11 (1 fewer than normal)

Thunderstorms occurred on 45 days.
No snow or sleet fell.

Average wind speed: 6.5 MPH
Maximum 2-minute wind speed: 53 mph on December 17 (Gravity wave)
Maximum 5-second wind gust: 69 mph on December 17 (Gravity wave)
|
2023 Climate Summary for Florence, SC |
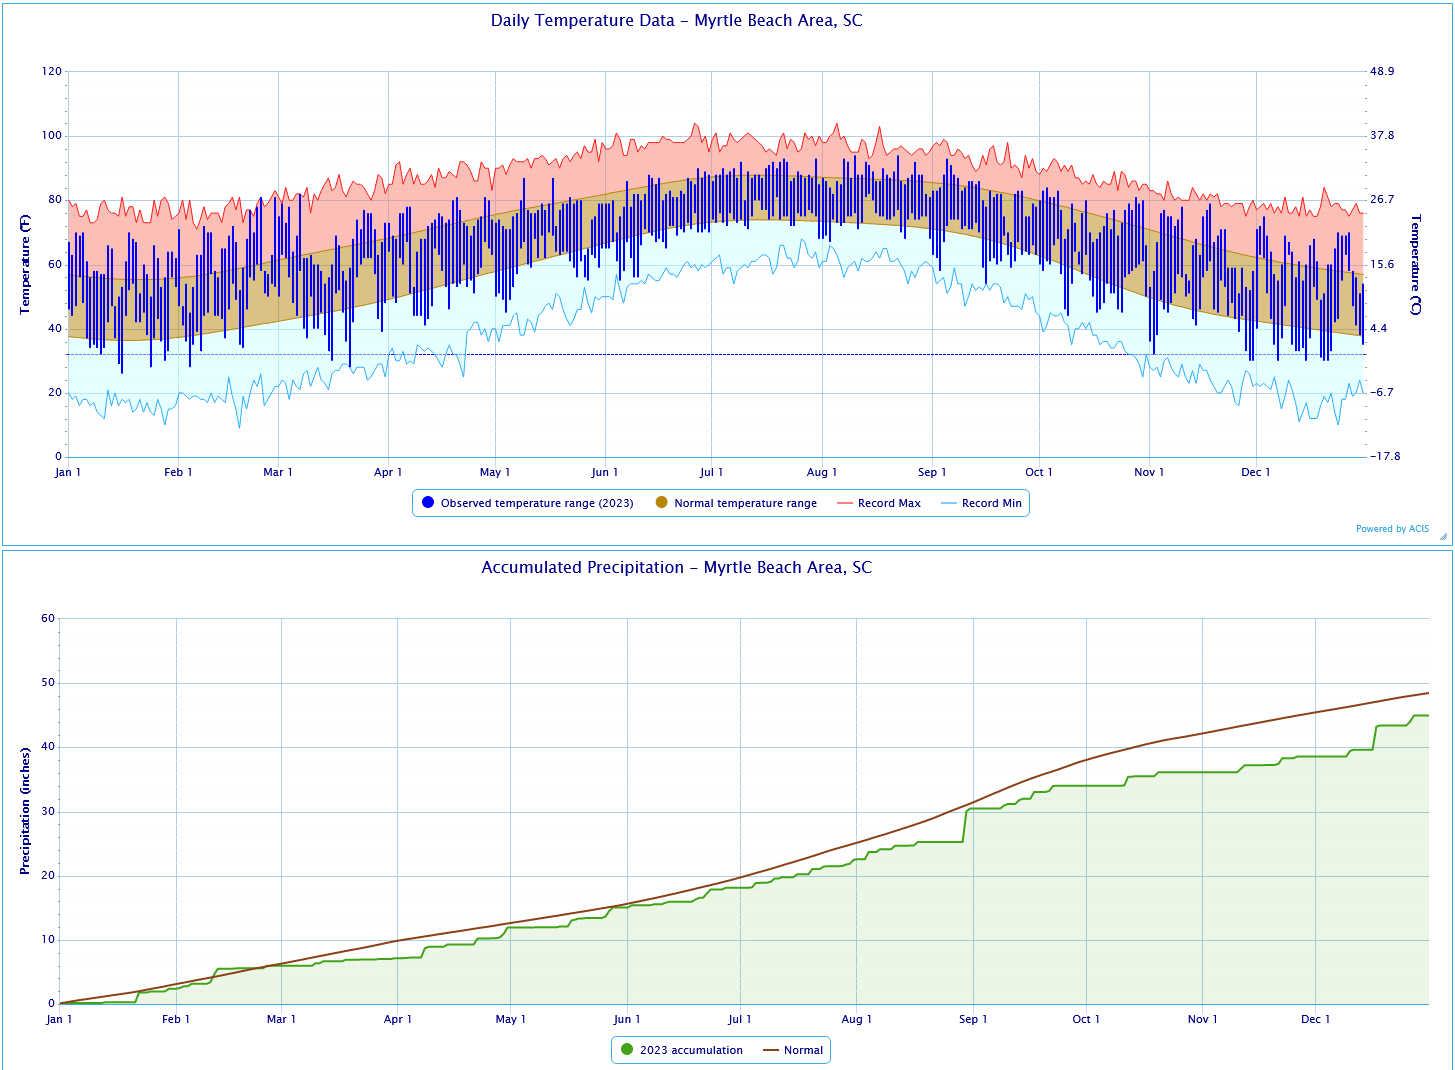
North Myrtle Beach, South Carolina
     Avg Hi/Dep   Avg Lo/Dep   Avg T/Dep   Warmest   Coolest   Precip/Dep
JAN   60.6/+4.9    40.7/+4.0   50.6/+4.4   70/18th   26/16th   2.39/-0.62
FEB   64.4/+6.2    45.5/+5.9   55.0/+6.1   81/28th   28/4th    3.56/+0.38
MAR   67.0/+2.3    47.6/+2.2   57.3/+2.3   83/7th    28/21st   1.19/-2.40
APR   73.2/+1.4    54.7/+1.4   63.9/+1.4   81/28th   41/11th   4.80/+2.77
MAY   76.4/-2.3    59.9/-2.2   68.2/-2.2   87/17th   45/4th    3.11/+0.15
JUN   82.7/-2.1    67.0/-3.3   74.9/-2.6   90/27th   55/5th    3.06/-1.01
JUL   88.6/+1.0    74.7/+1.0   81.7/+1.1   93/30th   68/31st   4.36/-1.04
AUG   87.8/+1.3    73.8/+1.3   80.8/+1.3   94/22nd   67/3rd    8.00/+1.75
SEP   82.0/-1.2    65.6/-2.1   73.8/-1.7   93/5th    54/16th   3.55/-3.10
OCT   75.2/-0.4    55.2/-1.1   65.2/-0.8   84/3rd    44/9th    2.10/-2.10
NOV   65.8/-0.6    45.8/+0.2   55.8/-0.2   79/18th   30/30th   2.46/-0.83
DEC   62.3/+3.0    42.6/+2.6   52.5/+2.9   75/3rd    30/21st   6.37/+3.27
--------------------------------------------------------------------------
ANN   73.8/+1.1    56.1/+0.9   65.0/+1.0   94/Aug    26/Jan   44.95/-3.52


Number of days with Temperatures...
90 degrees or higher:  22 (1 more than normal)
32 degrees or lower:   16 (18 fewer than normal)

Heating degree days: 1842 (501 fewer than normal)
Cooling degree days: 1948 (55 fewer than normal)

Number of days with precipitation...
0.01" or greater: 115 (7 fewer than normal)
0.10" or greater:  75 (4 more than normal)
0.50" or greater:  31 (exactly normal)
1.00" or greater:   8 (5 fewer than normal)

Thunderstorms occurred on 57 days.
No snow and sleet fell.

Average wind speed: 7.4 MPH
Maximum 2-minute wind speed: 44 mph on June 23 (Thunderstorms)
Maximum 5-second wind gust: 54 mph on June 23 (Thunderstorms)
|
2023 Climate Summary for North Myrtle Beach, SC |
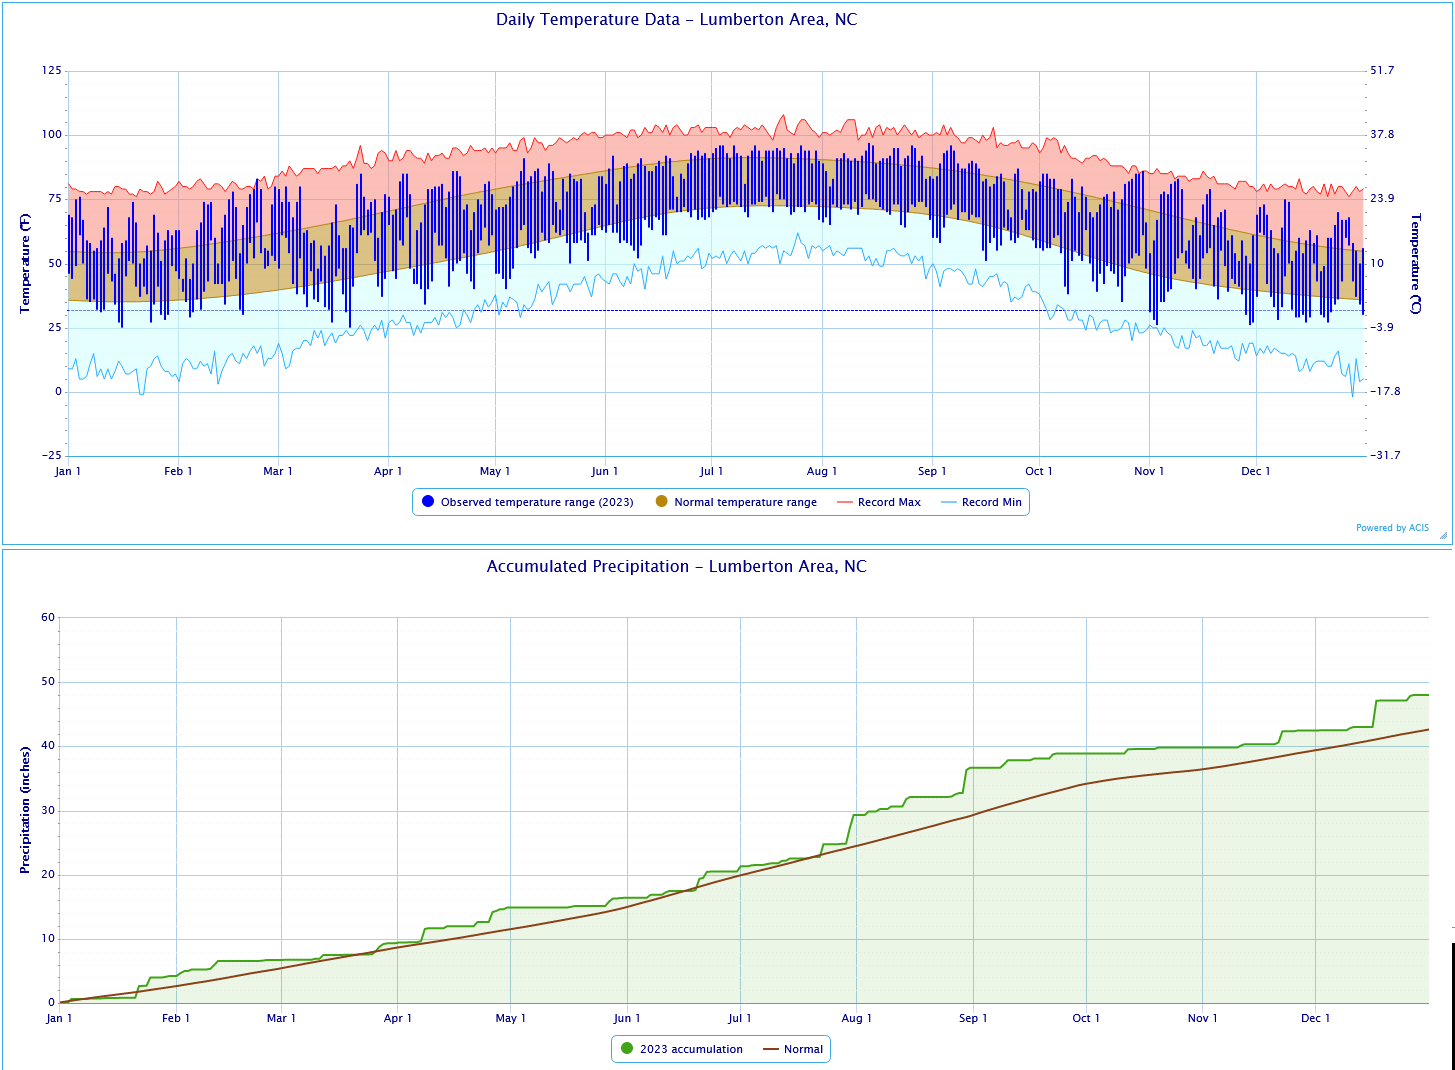
Lumberton, North Carolina
     Avg Hi/Dep   Avg Lo/Dep   Avg T/Dep   Warmest   Coolest   Precip/Dep
JAN   61.4/+6.8    39.2/+3.9   50.3/+5.4   76/4th    25/16th   4.19/+2.55
FEB   65.9/+7.3    43.9/+6.5   54.9/+6.9   83/23rd   29/4th    2.52/-0.25
MAR   67.6/+1.8    44.5/+1.4   56.1/+1.6   85/24th   25/21st   2.59/-0.67
APR   75.5/+0.8    50.8/+0.1   63.2/+0.5   86/20th   34/11th   5.60/+2.75
MAY   79.5/-3.0    56.2/-3.3   67.8/-3.2   91/9th    40/4th    1.49/-1.92
JUN   87.4/-1.4    64.4/-4.3   75.9/-2.9   94/27th   52/10th   4.09/-0.83
JUL   92.9/+1.9    72.4/+0.1   82.6/+1.0   96/26th   67/31st   8.82/+4.21
AUG   90.6/+1.5    71.2/+0.3   80.9/+0.9   97/14th   64/24th   7.37/+2.60
SEP   84.1/-0.1    62.7/-2.1   73.4/-1.1   96/6th    51/16th   2.23/-2.70
OCT   77.5/+1.6    50.0/-2.5   63.8/-0.4   86/30th   35/24th   0.91/-1.38
NOV   66.5/+0.6    41.4/-1.0   54.0/-0.1   83/9th    26/29th   2.65/-0.30
DEC   61.4/+3.9    38.3/+0.8   49.8/+2.3   75/9th    27/21st   5.55/+3.31
--------------------------------------------------------------------------
ANN   75.8/+1.7    52.9/+0.0   64.4/+0.9   97/Aug    25/Mar   48.01/+5.39


Number of days with Temperatures...
90 degrees or higher:  68 (1 more than normal)
32 degrees or lower:   36 (15 fewer than normal)

Heating degree days: 2098 (511 fewer than normal)
Cooling degree days: 1988 (99 fewer than normal)

Number of days with precipitation...
0.01" or greater: 109 (9 fewer than normal)
0.10" or greater:  75 (4 more than normal)
0.50" or greater:  28 (exactly normal)
1.00" or greater:  12 (2 more than normal)

Thunderstorms occurred on 46 days.
No snow and sleet fell.

Average wind speed: 5.8 MPH
Maximum 2-minute wind speed: 37 mph on May 2 (Line of showers)
Maximum 5-second wind gust: 49 mph on May 2 (Line of showers)
|
2023 Climate Summary for Lumberton, NC |
Research and Page Author: Tim Armstrong
Last Updated: January 4, 2024


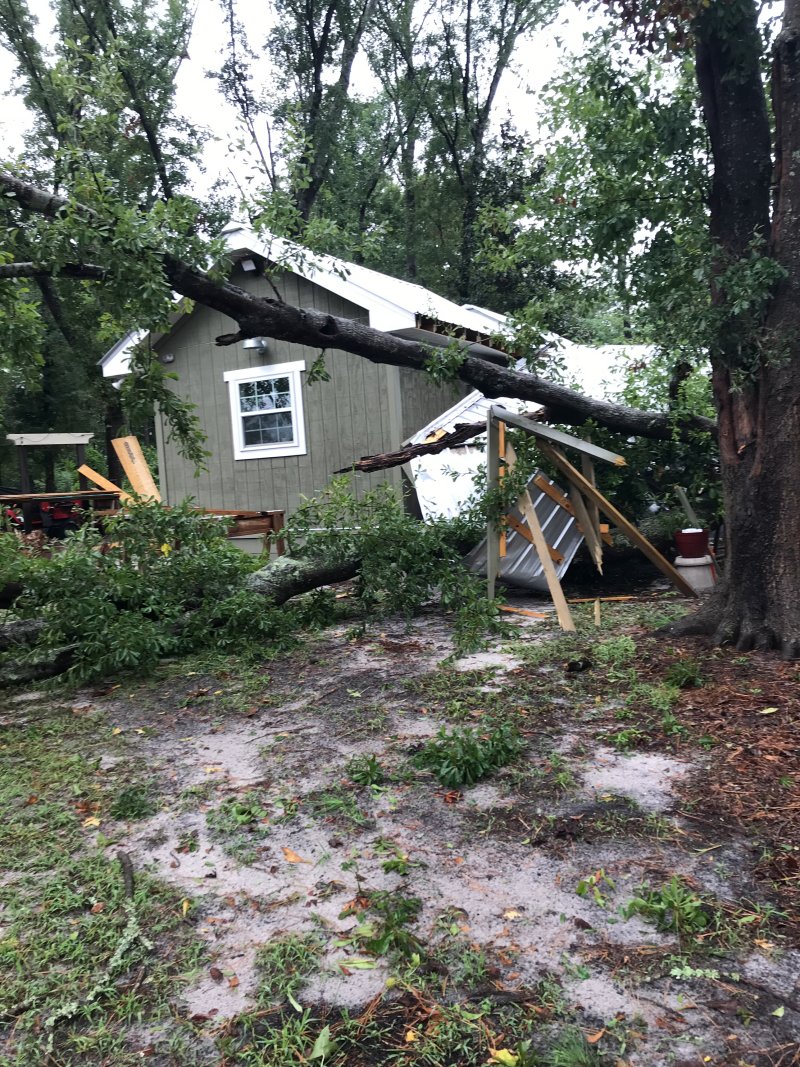
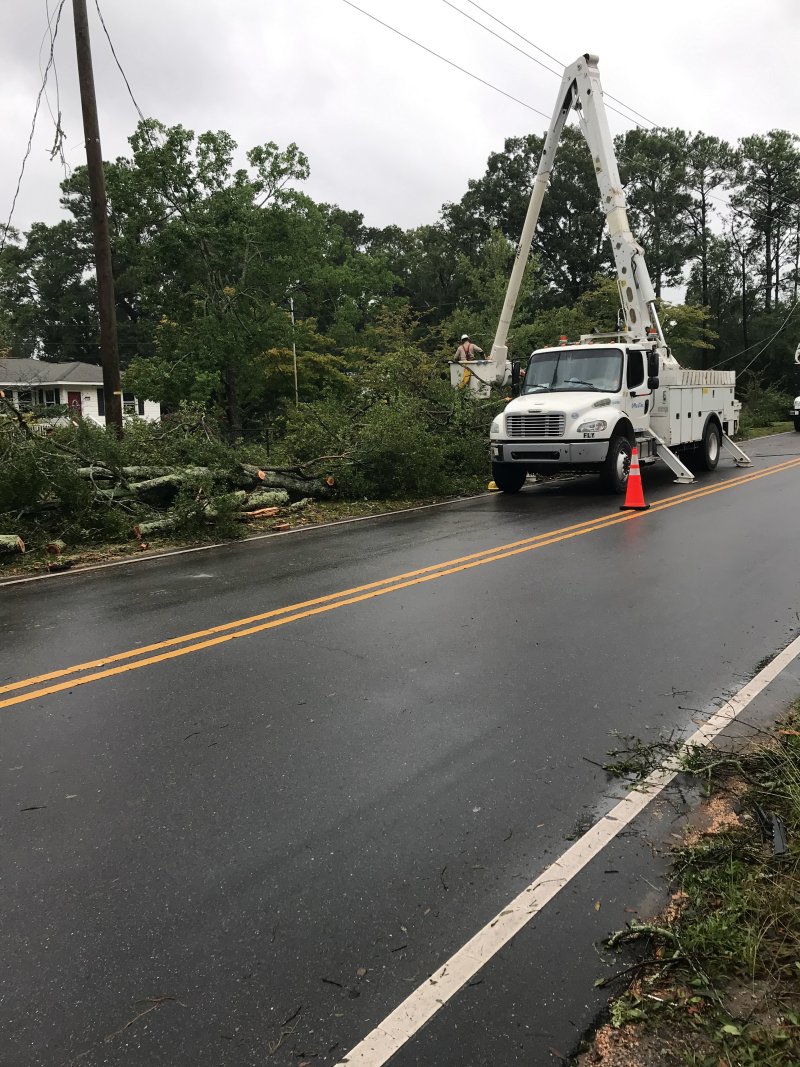 Trees and power lines were blown down in Silver Lake by an EF1 tornado during Tropical Storm Idalia.
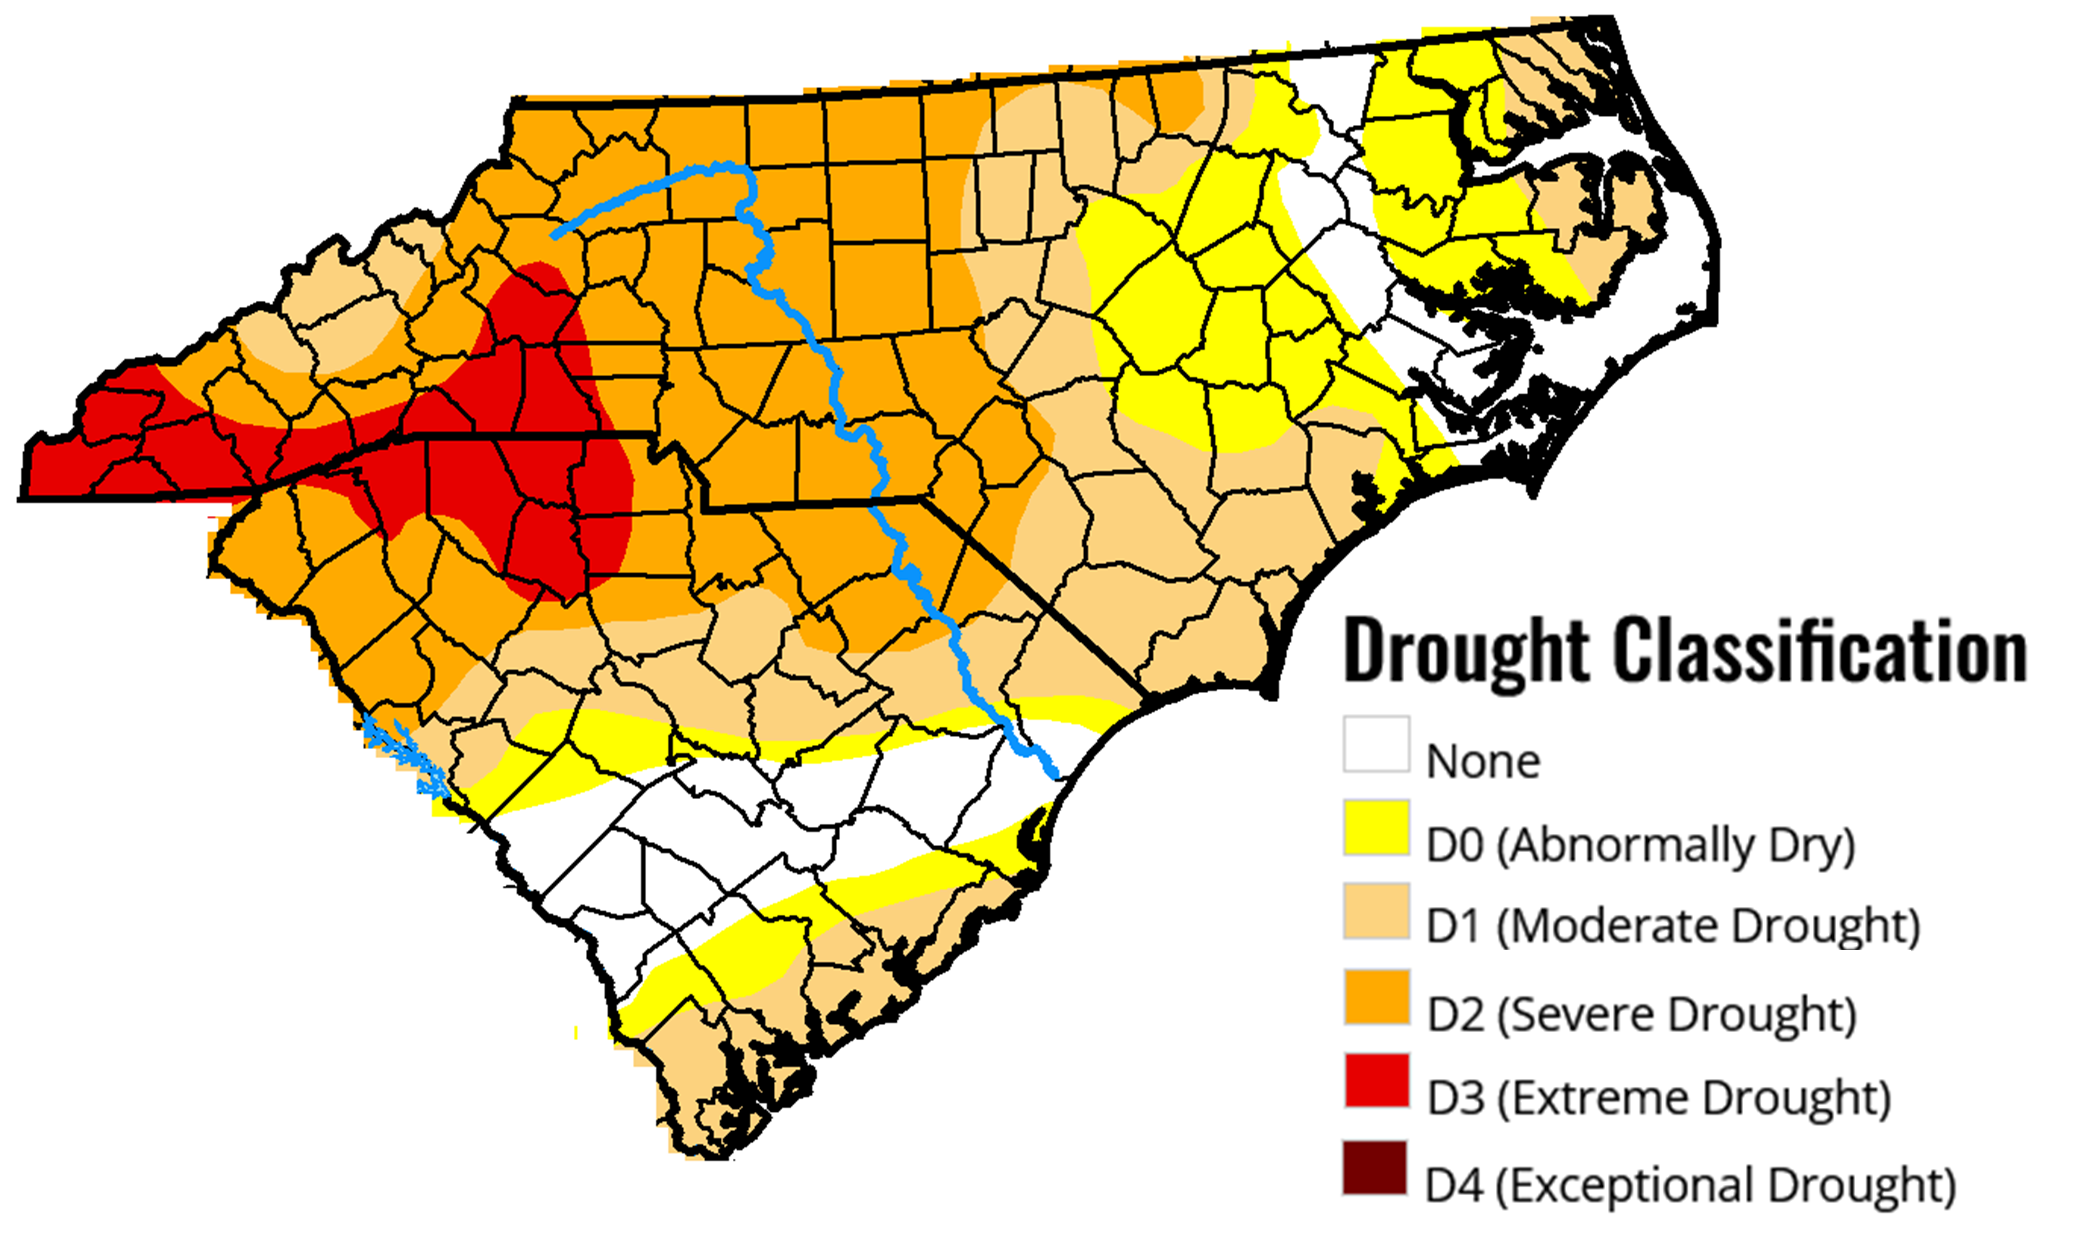

 Coastal Flood