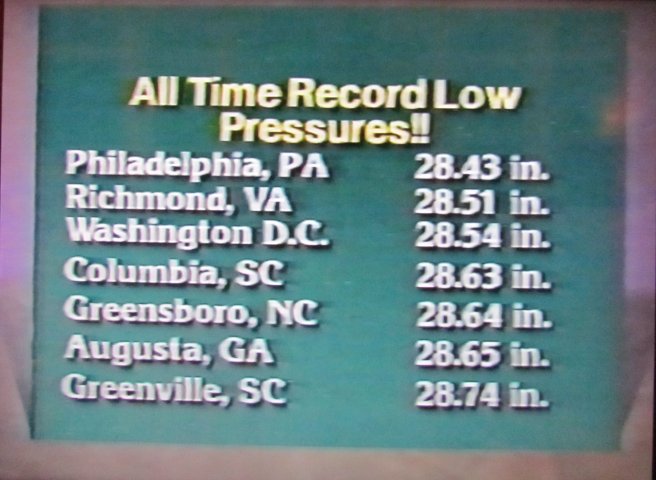
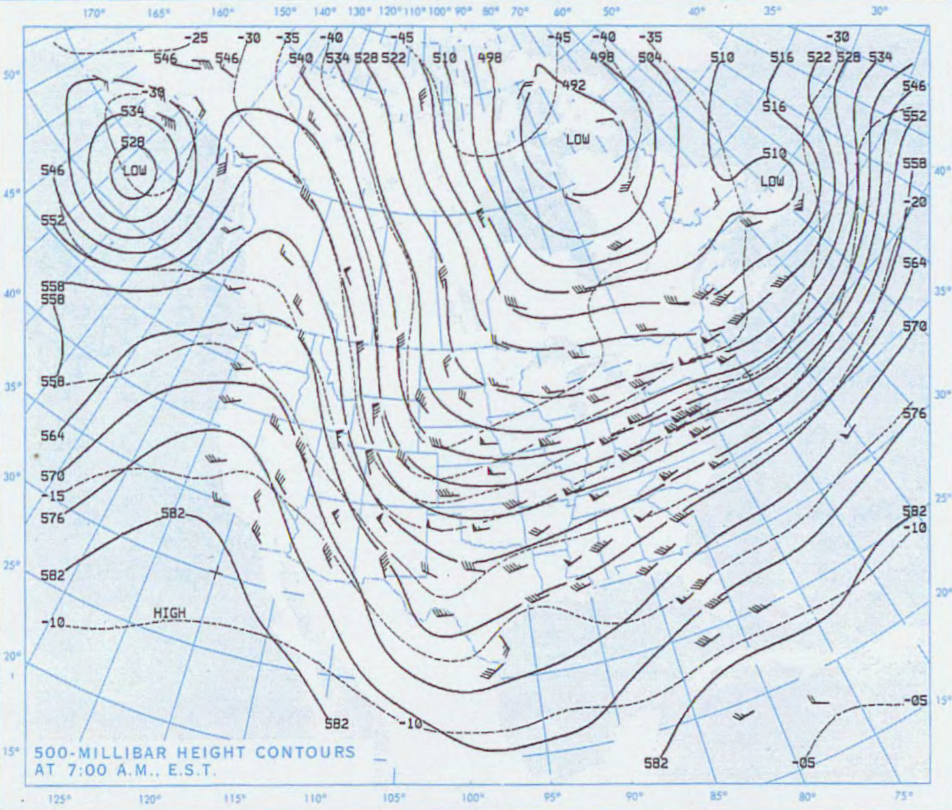
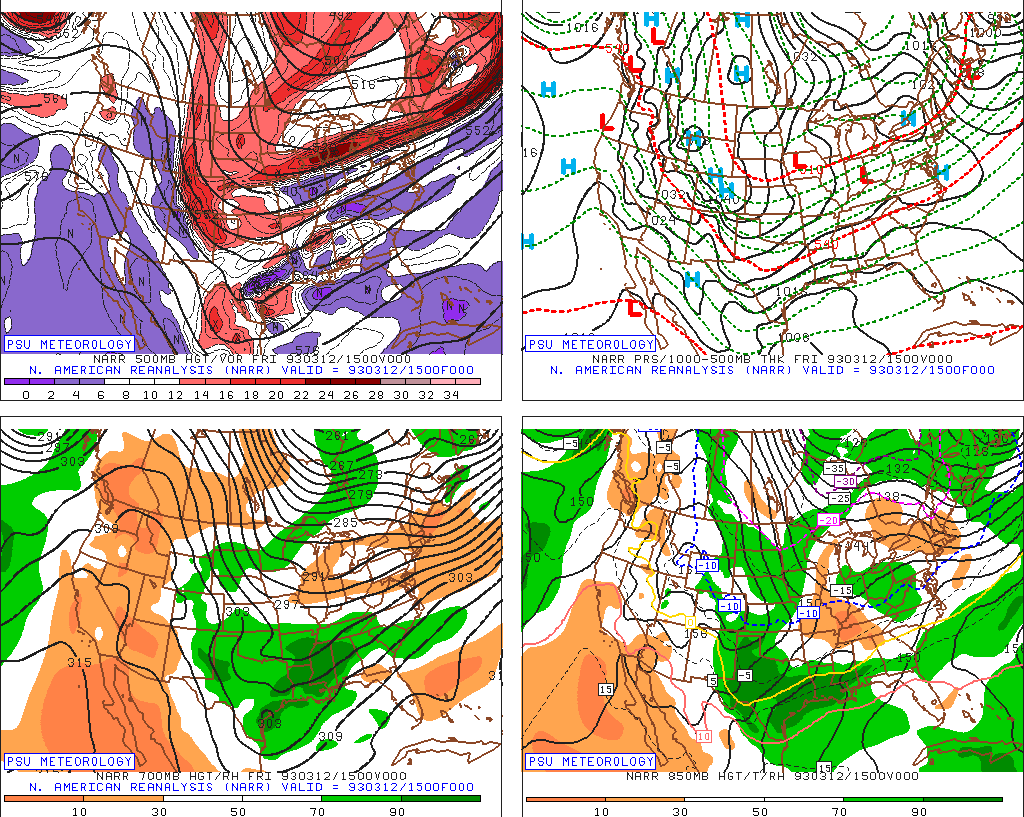
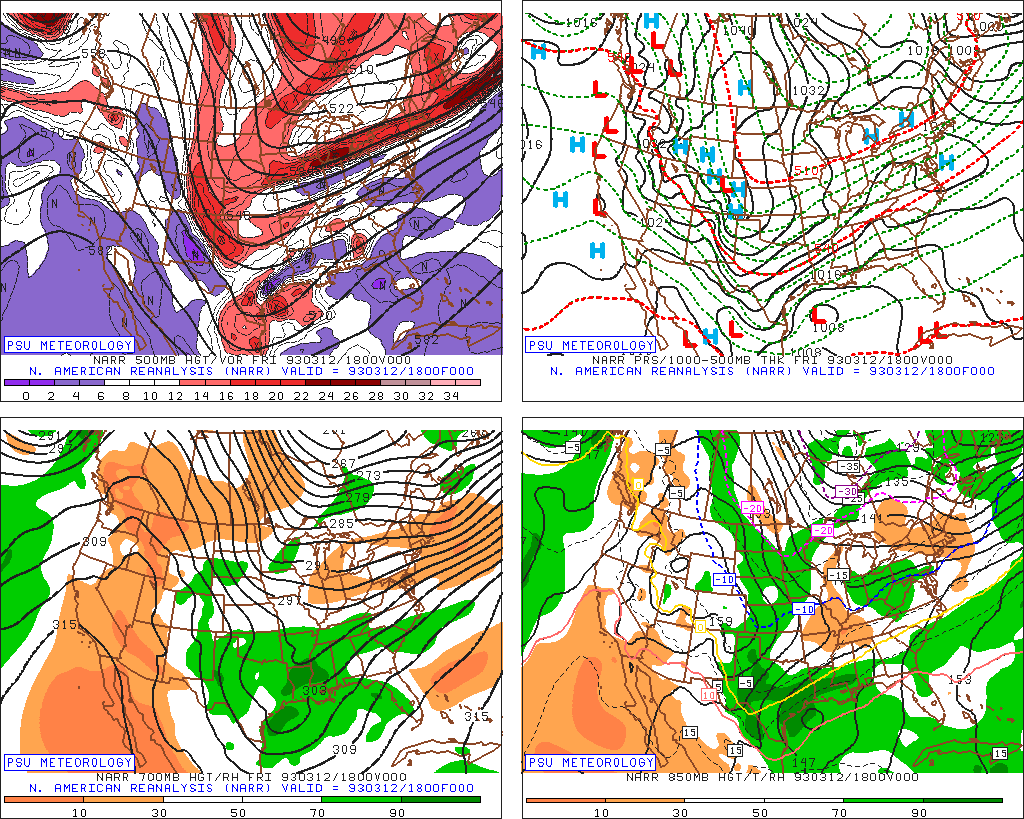
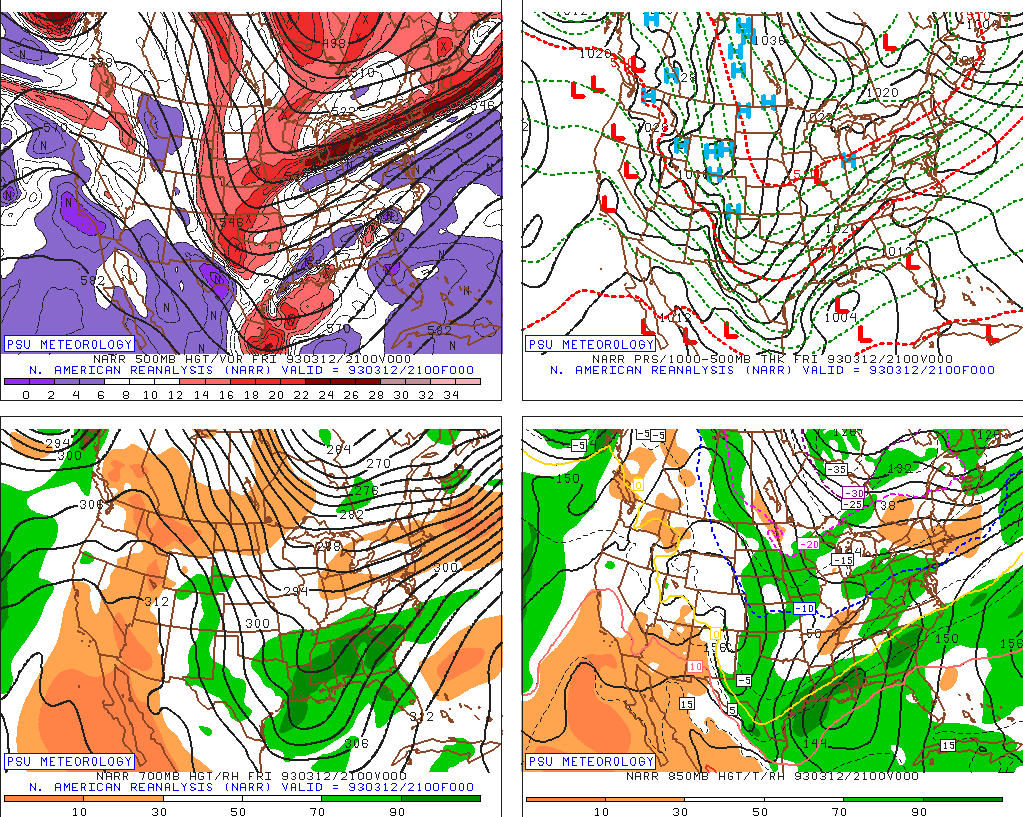
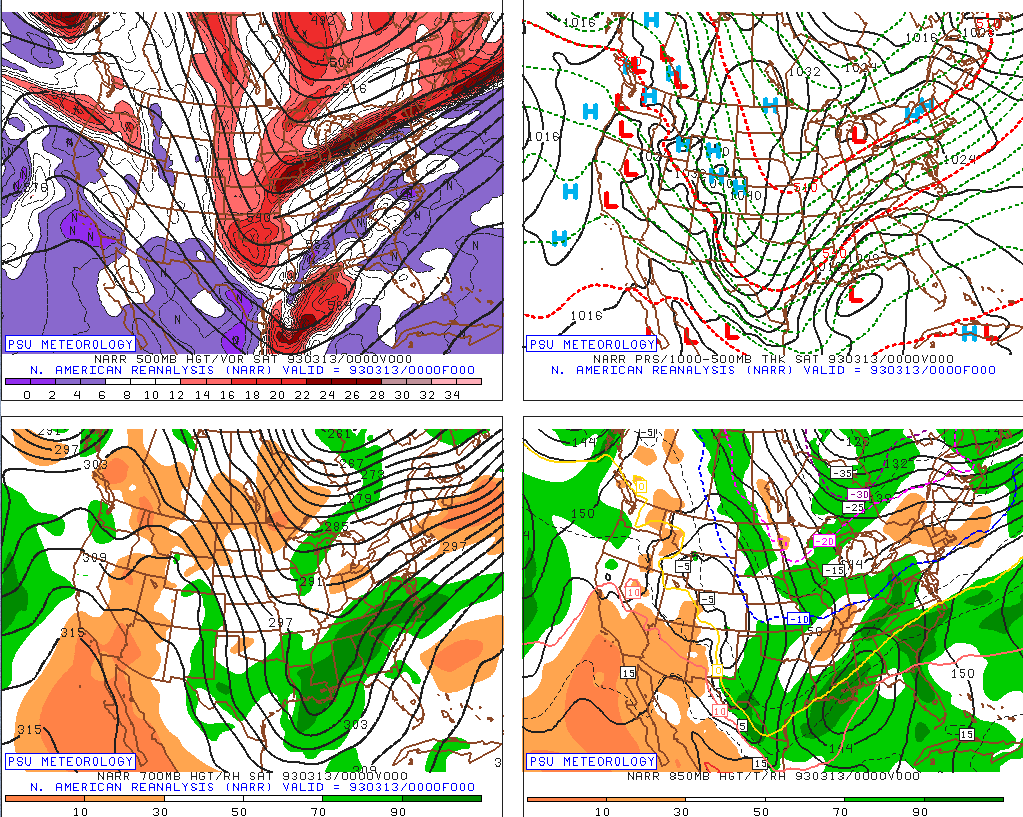
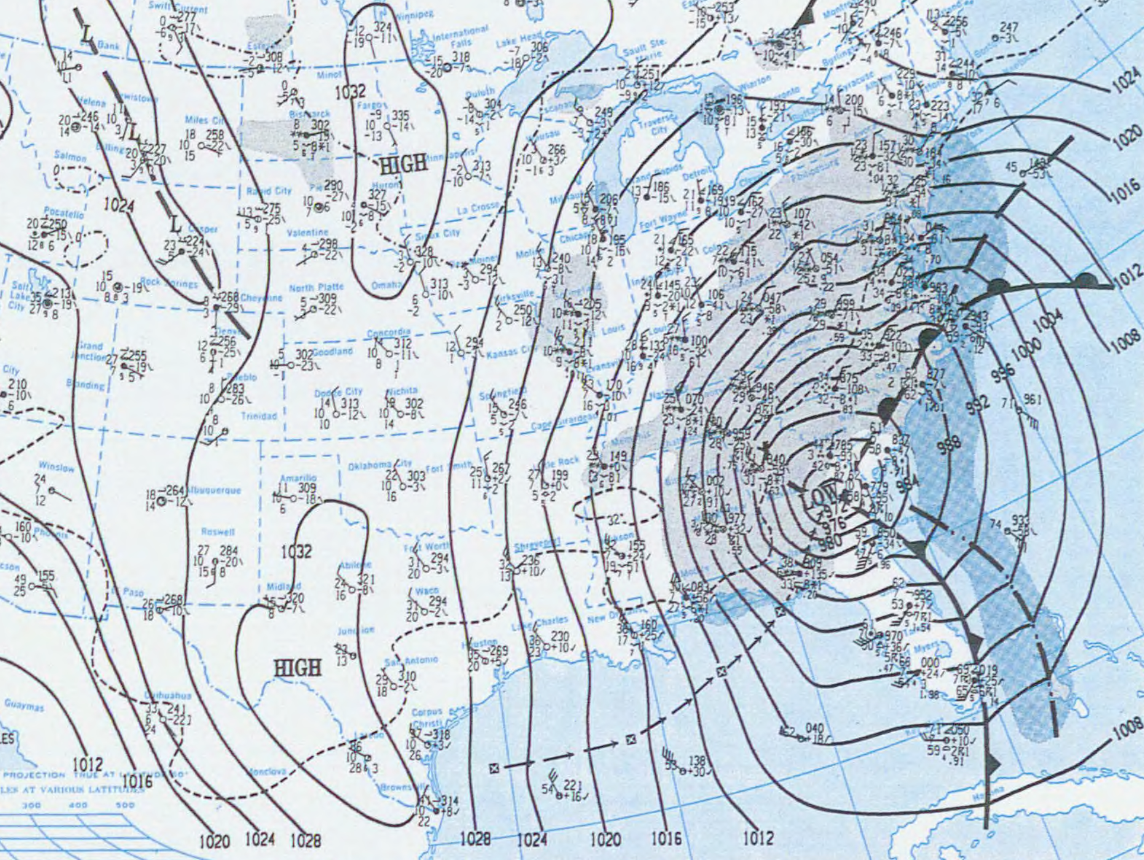
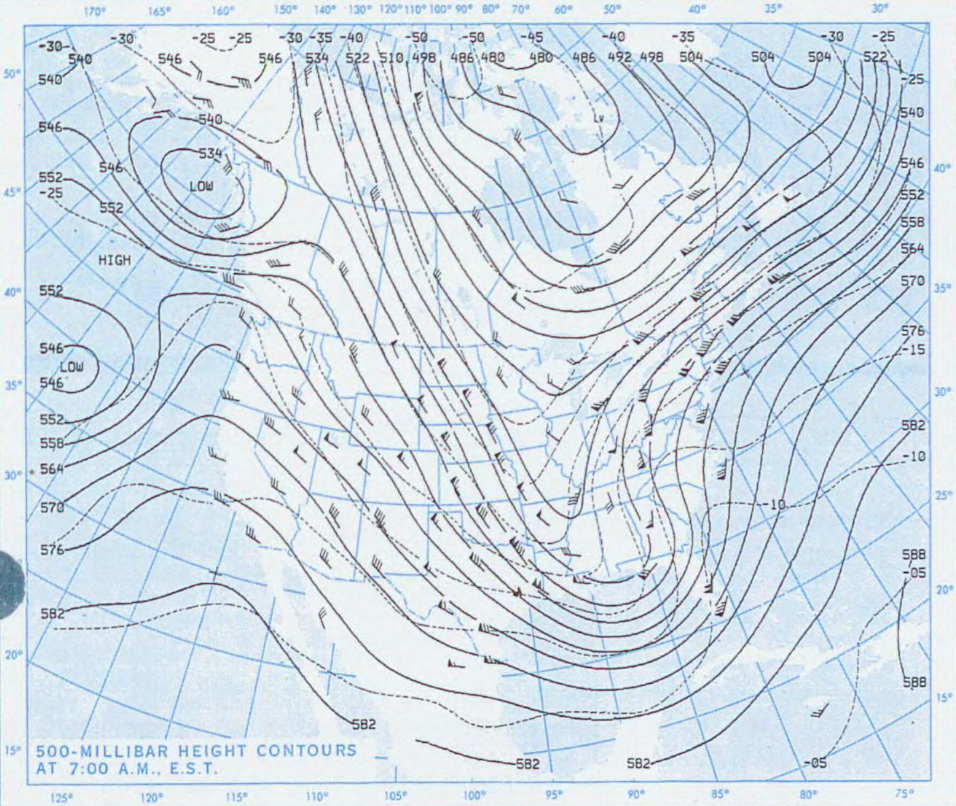
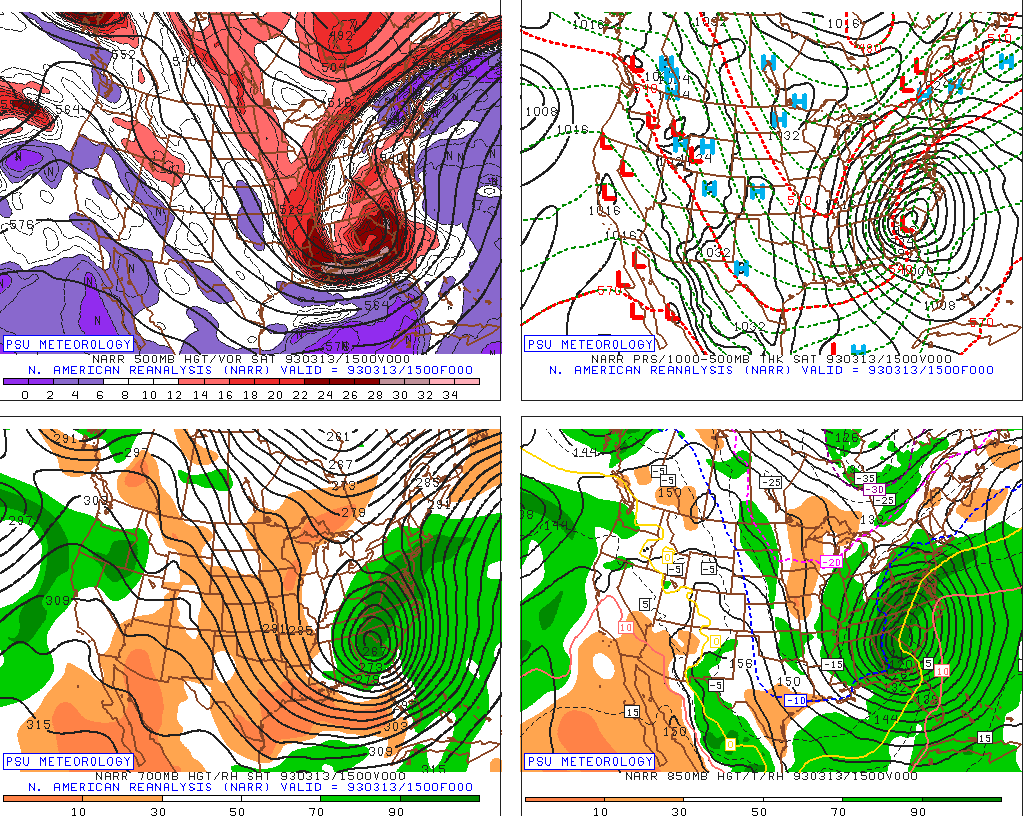
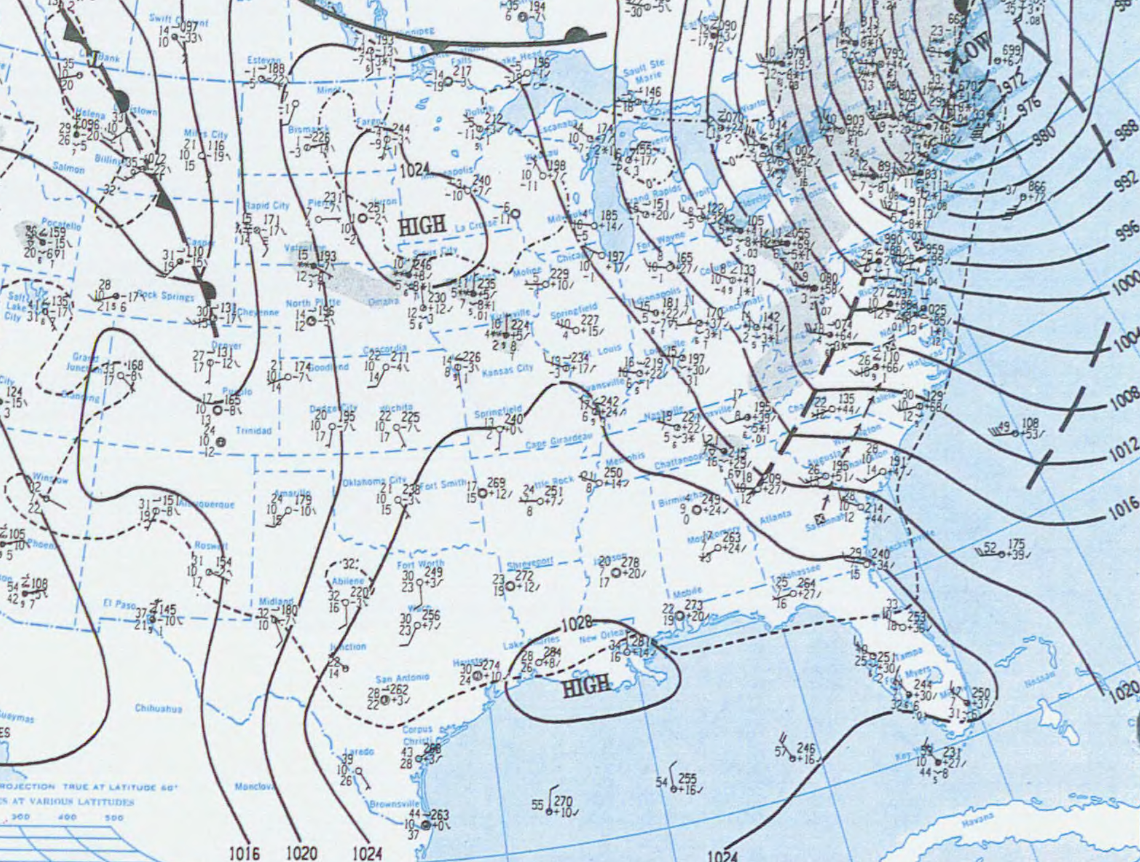
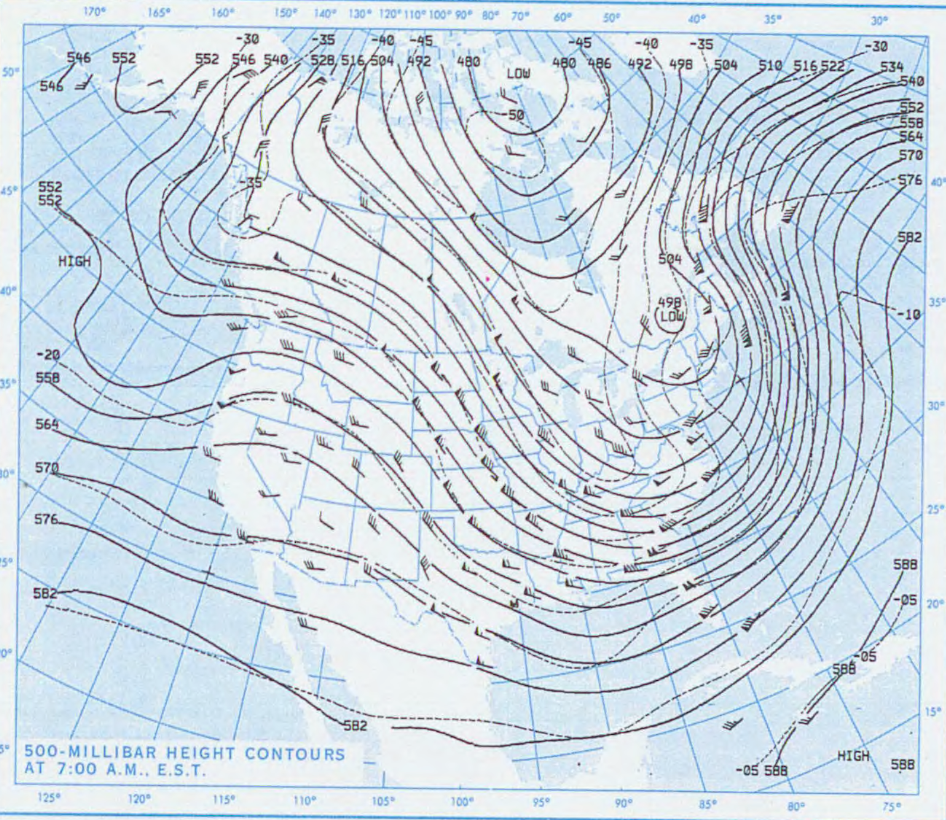
 The Superstorm of 1993 (also called the Storm of the Century) was one of the most intense mid-latitude cyclones ever observed over the Eastern United States. The storm will be remembered for its tremendous snowfall totals from Alabama through Maine, high winds all along the East coast, extreme coastal flooding along the Florida west coast, incredibly low barometric pressures across the Southeast and Mid-Atlantic, and for the unseasonably cold air that followed behind the storm. In terms of human impact the Superstorm of 1993 was more significant than most landfalling hurricanes or tornado outbreaks and ranks among the deadliest and most costly weather events of the 20th century. Meteorological History  Low pressure developed during the day of March 12th along a nearly stationary front lying along the Texas Gulf coast. Upper level conditions were very favorable for intensification of the low as a powerful jet streak developed across the eastern United States on the downwind side of a deep upper level trough. Strong horizontal temperature contrasts near the front across the Gulf Coast states, plus the development of deep thunderstorms over the Gulf also added fuel to the strengthening system. The low rapidly deepened as it crossed the Gulf of America during the afternoon and evening of March 12th and made "landfall" along the Florida Panhandle just after midnight on March 13th. The U.S. Coast Guard rescued over 100 people from ships in distress during the storm. Low pressure developed during the day of March 12th along a nearly stationary front lying along the Texas Gulf coast. Upper level conditions were very favorable for intensification of the low as a powerful jet streak developed across the eastern United States on the downwind side of a deep upper level trough. Strong horizontal temperature contrasts near the front across the Gulf Coast states, plus the development of deep thunderstorms over the Gulf also added fuel to the strengthening system. The low rapidly deepened as it crossed the Gulf of America during the afternoon and evening of March 12th and made "landfall" along the Florida Panhandle just after midnight on March 13th. The U.S. Coast Guard rescued over 100 people from ships in distress during the storm.A squall line of severe thunderstorms extending south of the low impacted Florida during the early morning hours of March 13th. Damaging straight-line winds and 11 confirmed tornadoes were reported across Florida, with substantial thunderstorm wind damage occurring south into Cuba. A study from the Cuban weather service found evidence of wind speeds up to 120 mph from severe thunderstorms spawned there. Strong onshore winds along Florida's west coast created a storm surge up to 12 feet high in Taylor County with significant damage to property and up to seven fatalities reported.   Infrared (left) and visible (right) satellite loops covering the Superstorm's impact on the Southeastern U.S. Minimum Atmospheric Pressures Observed with the 1993 Superstorm
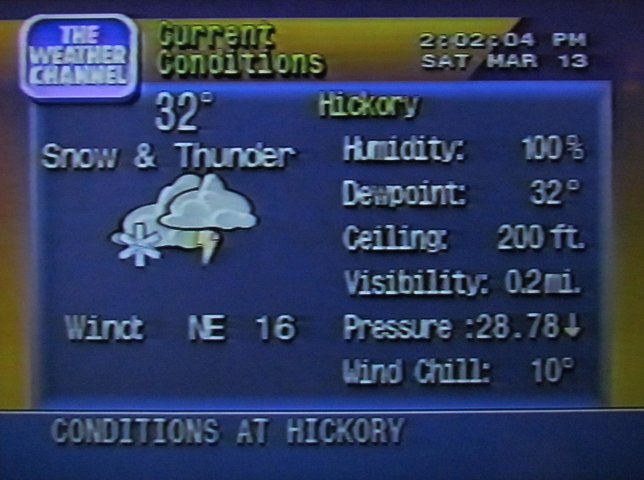
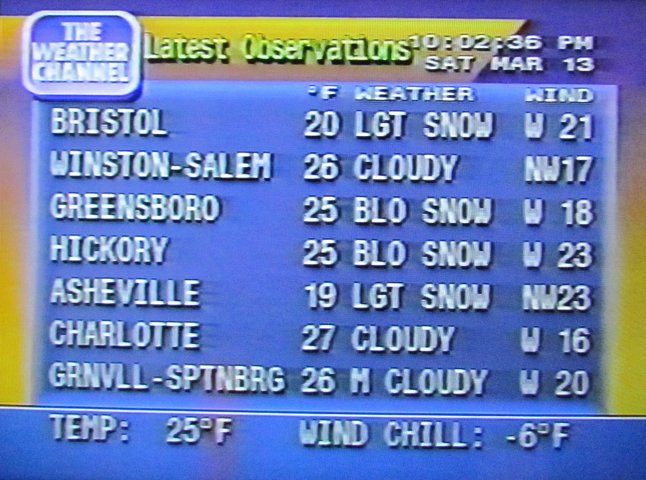
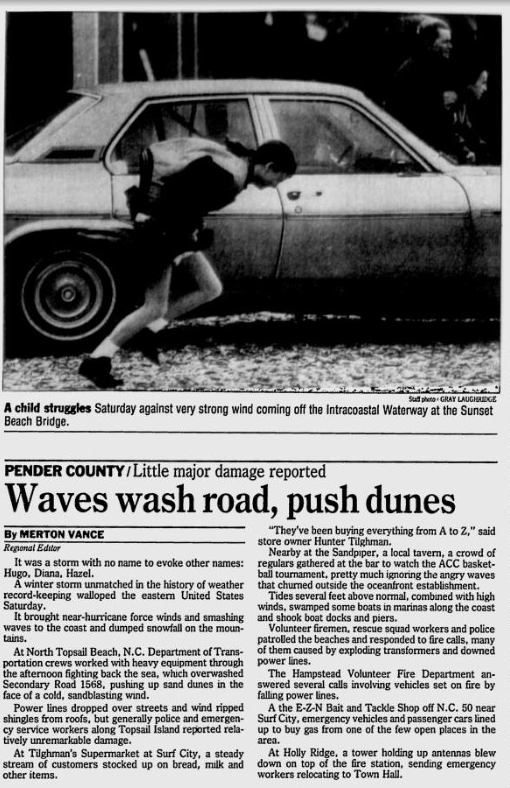
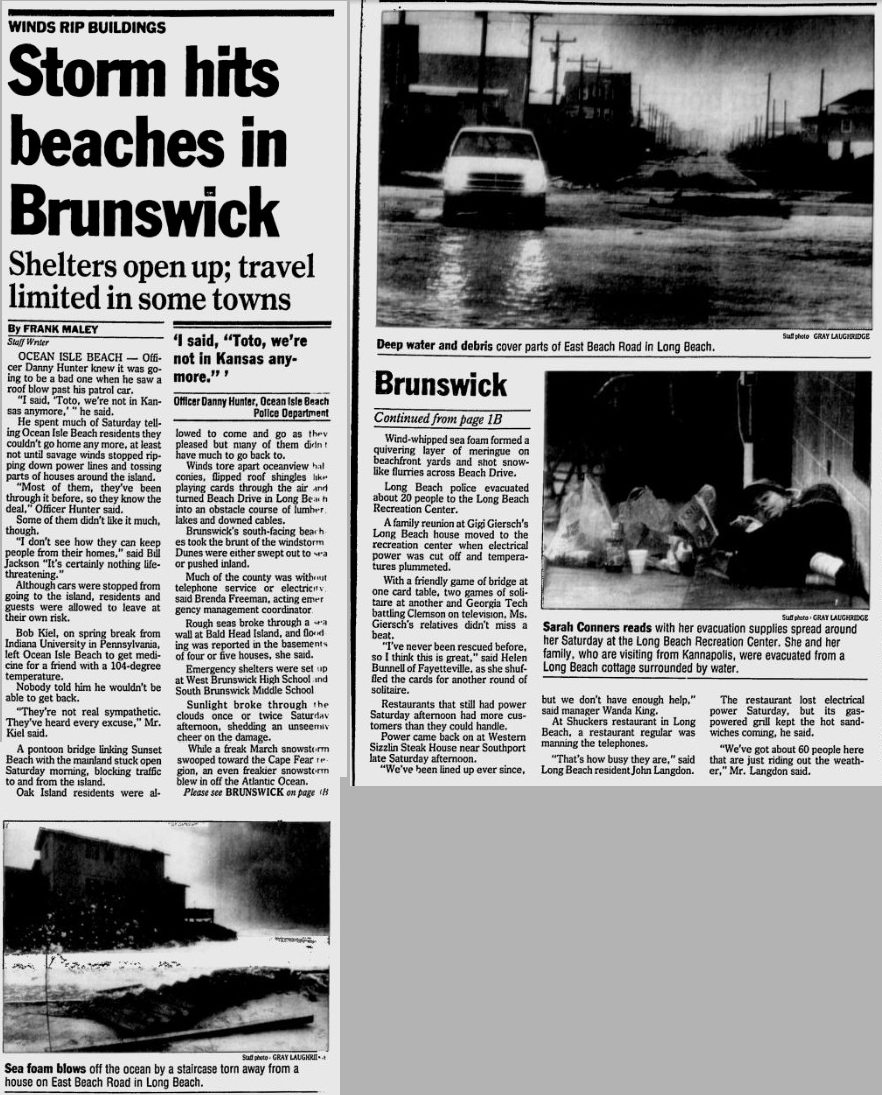
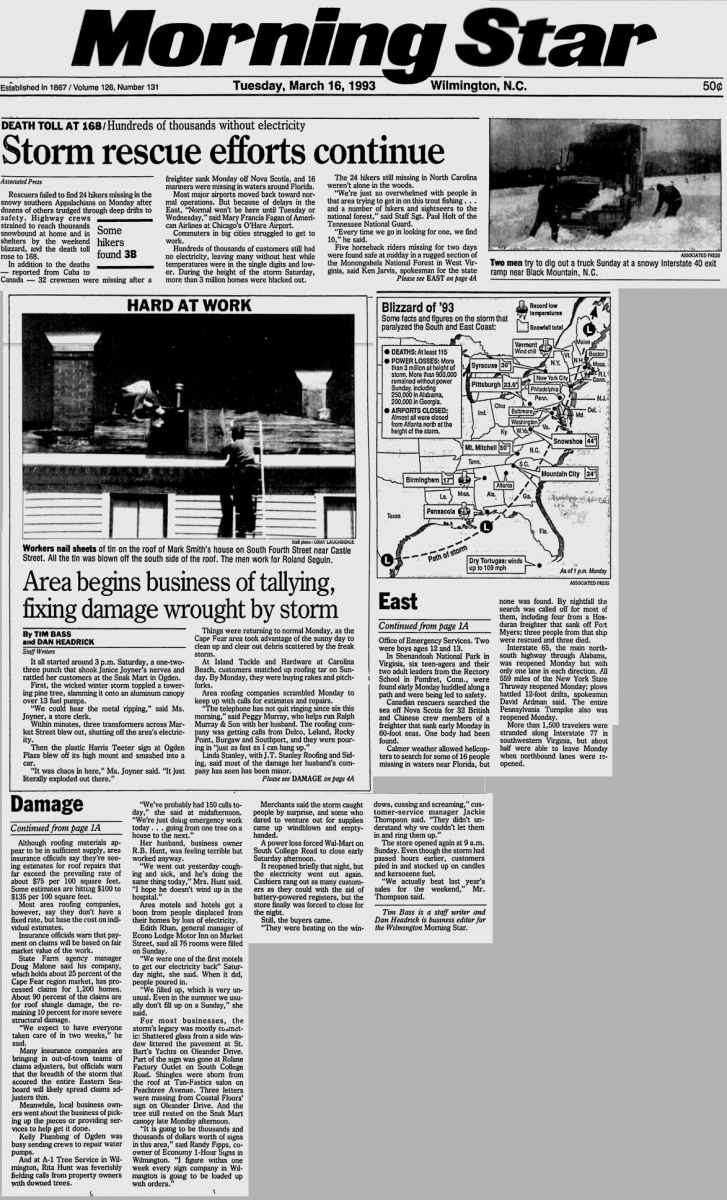
Across the Eastern Carolinas strong wind was the largest impact from the Superstorm. These winds were the result of a powerful pressure gradient out ahead of the rapidly deepening low. Warm, humid air was brought north from Florida on winds gusting to near hurricane force. Widespread damage was the result to homes, trees, and electrical infrastructure in coastal North Carolina. At the same time a blizzard was raging across the western Carolinas with thunder accompanying the whiteout conditions. Some of the peak wind gusts recorded locally include:
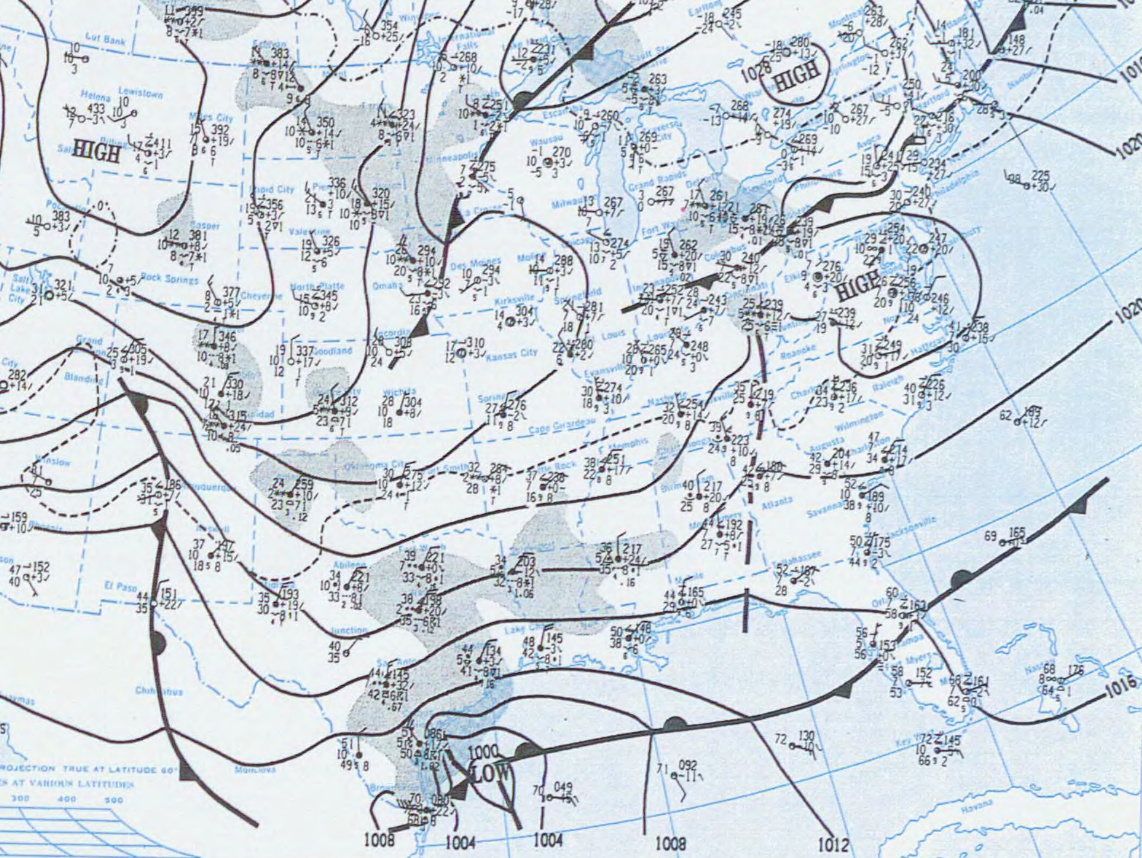
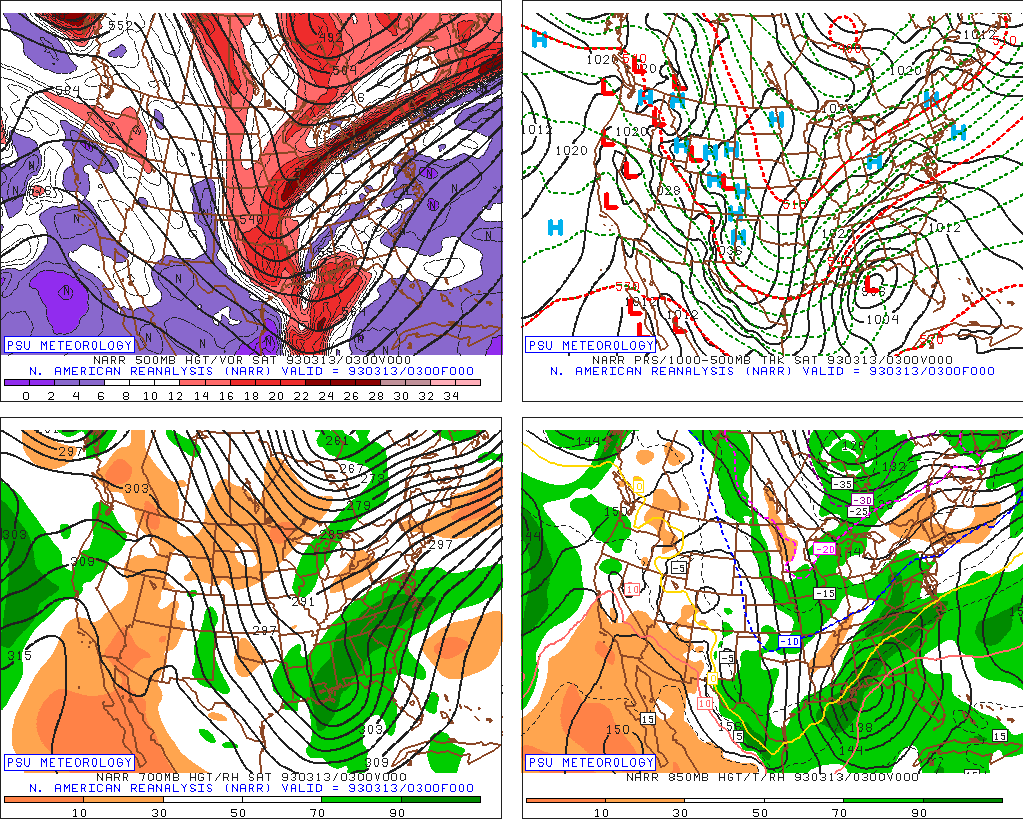
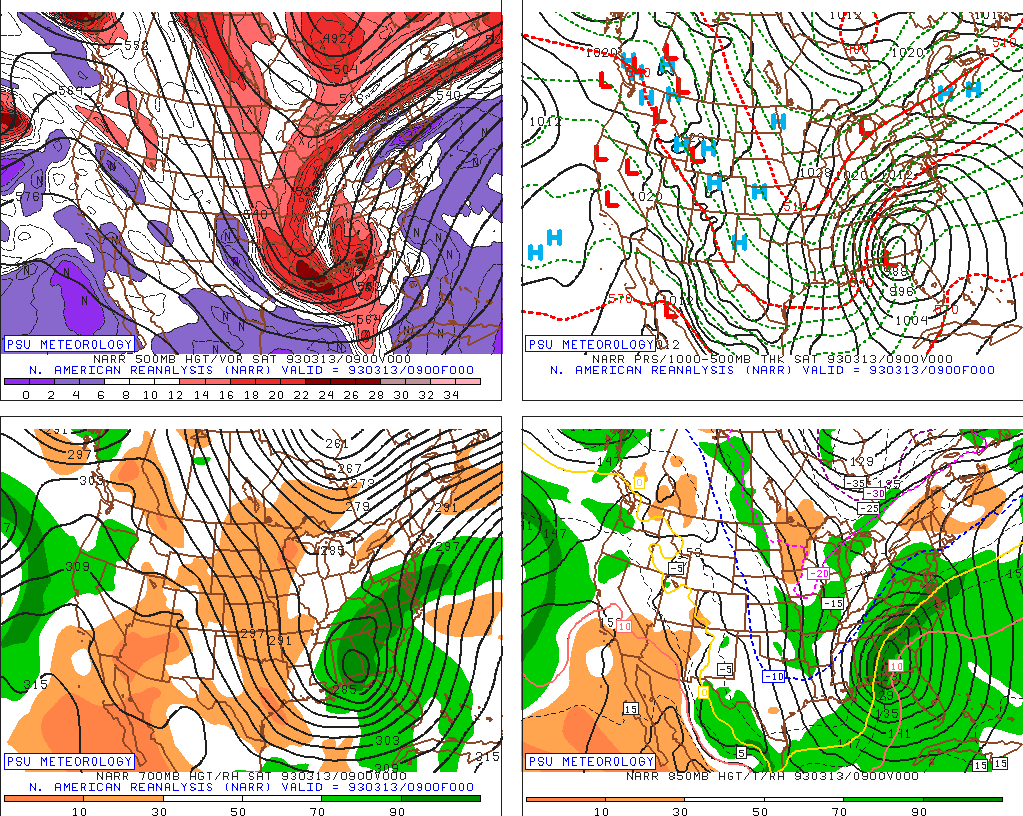
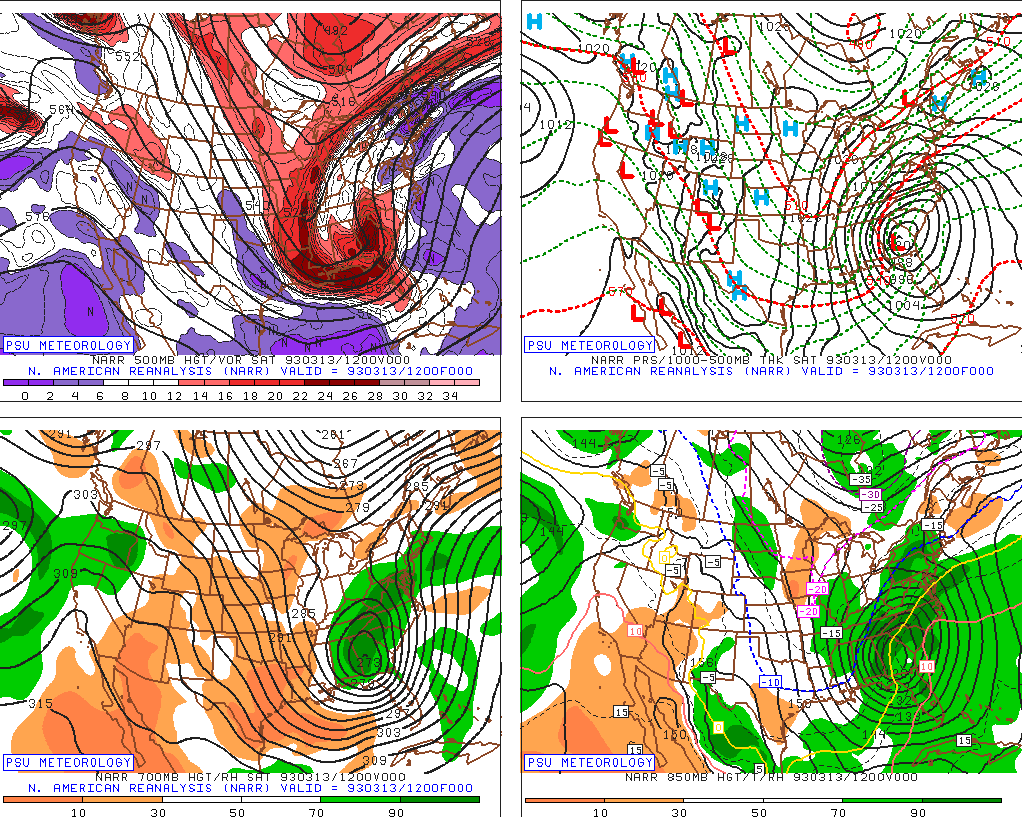
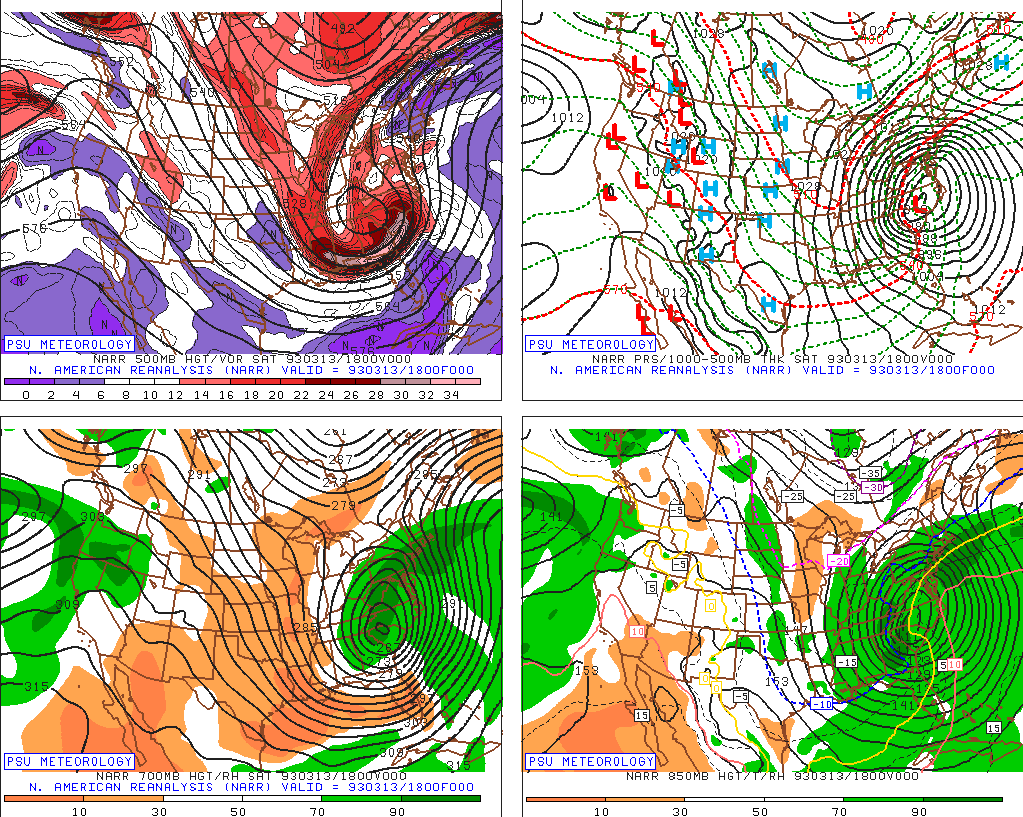
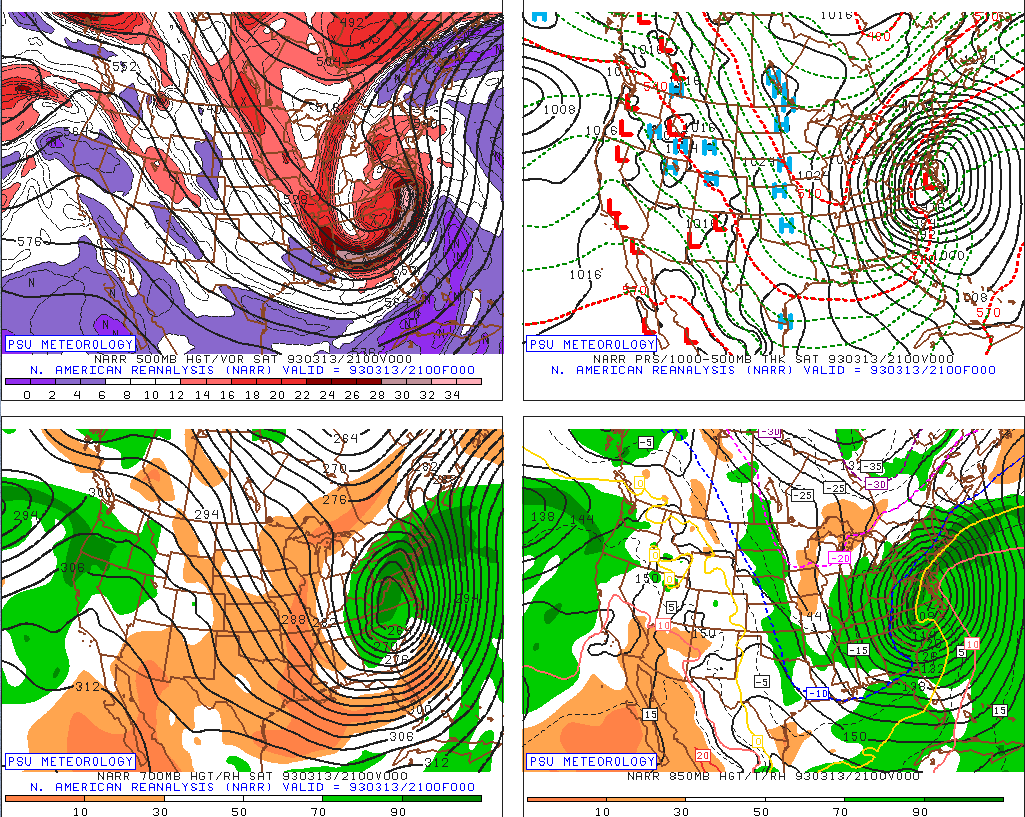
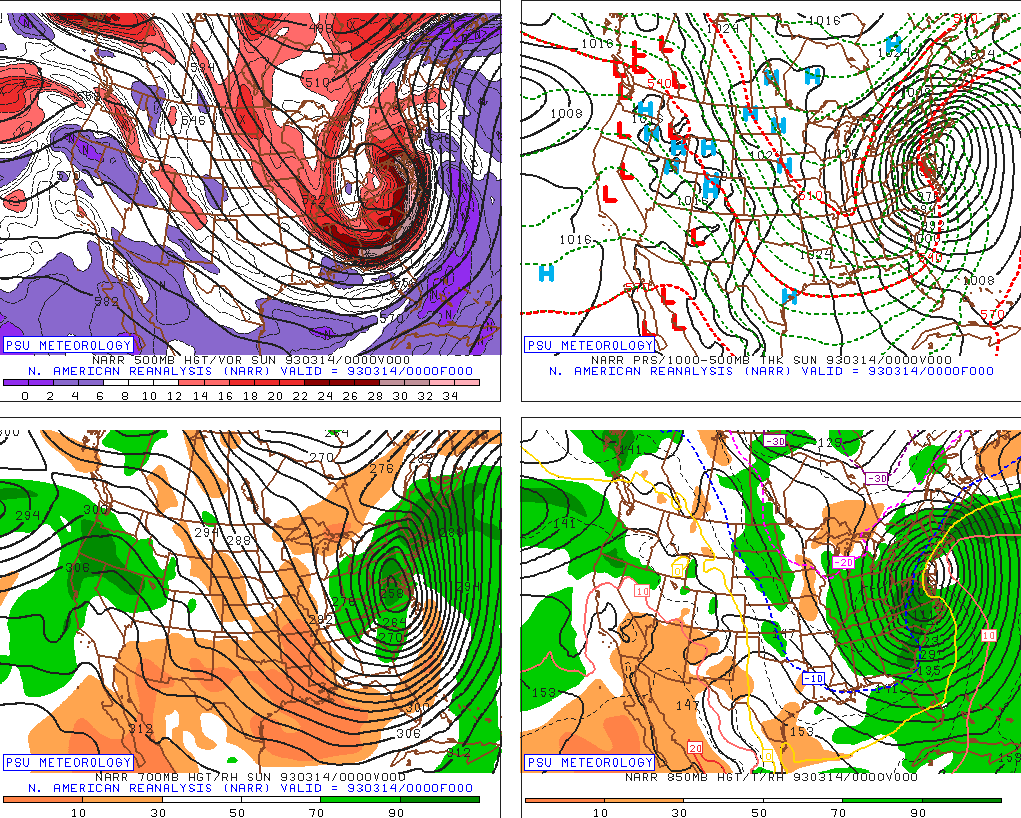
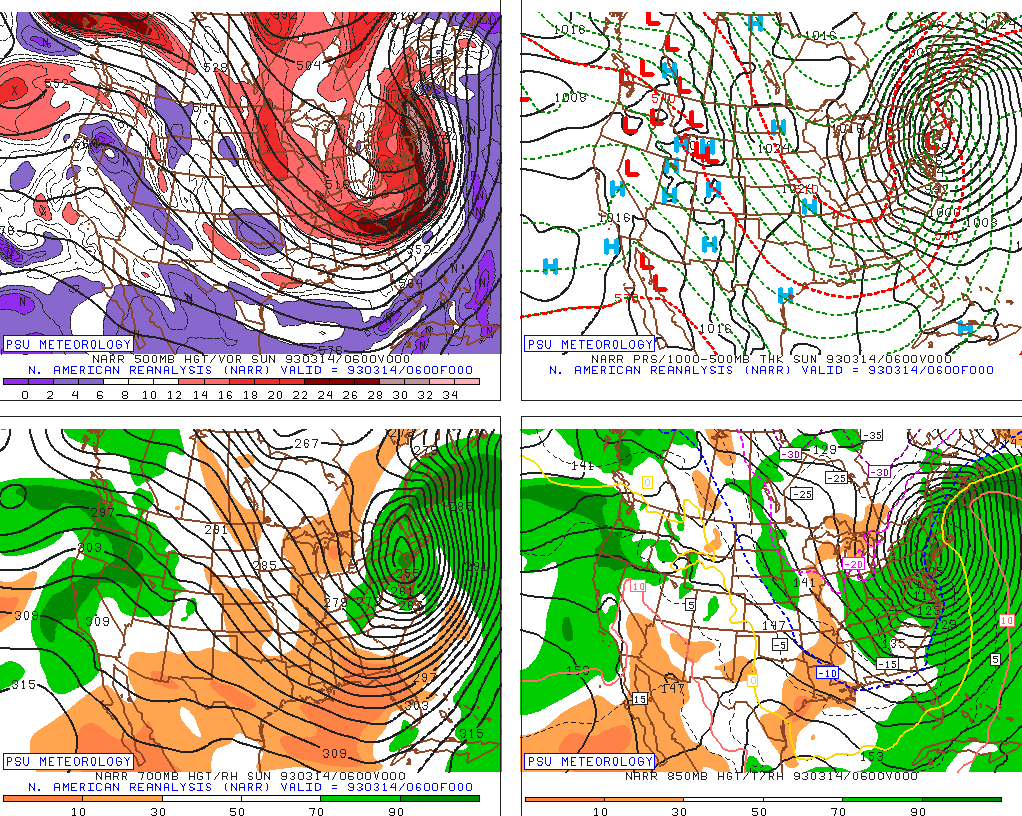
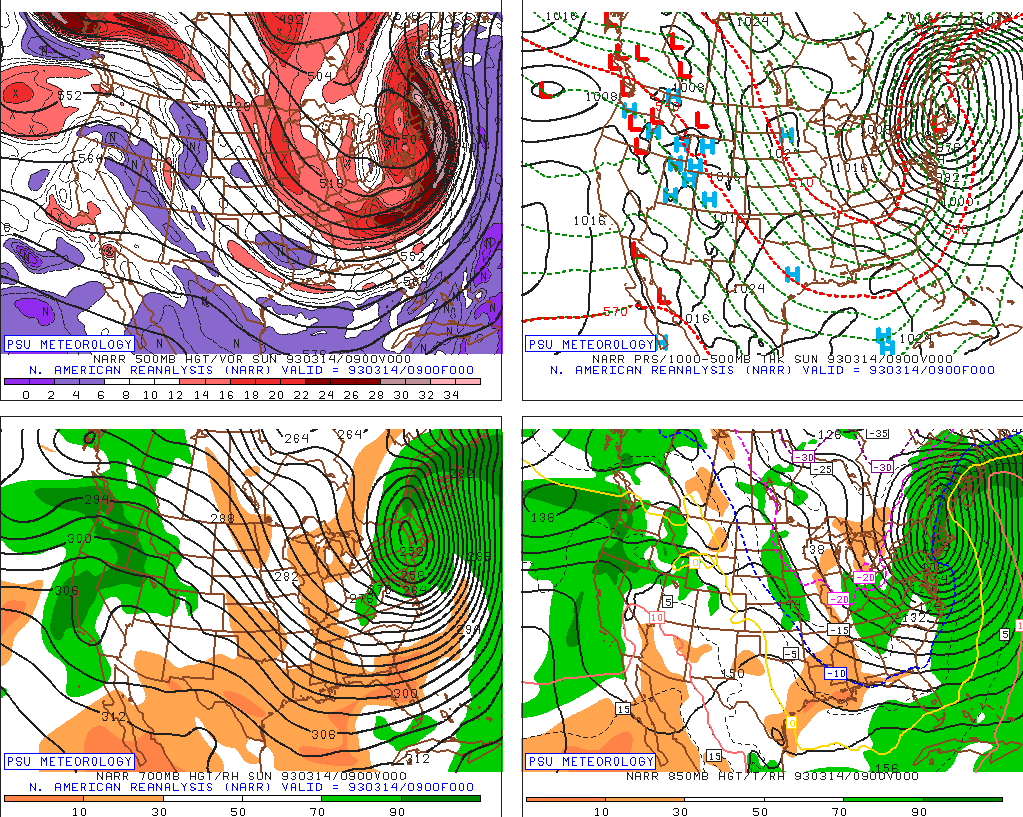
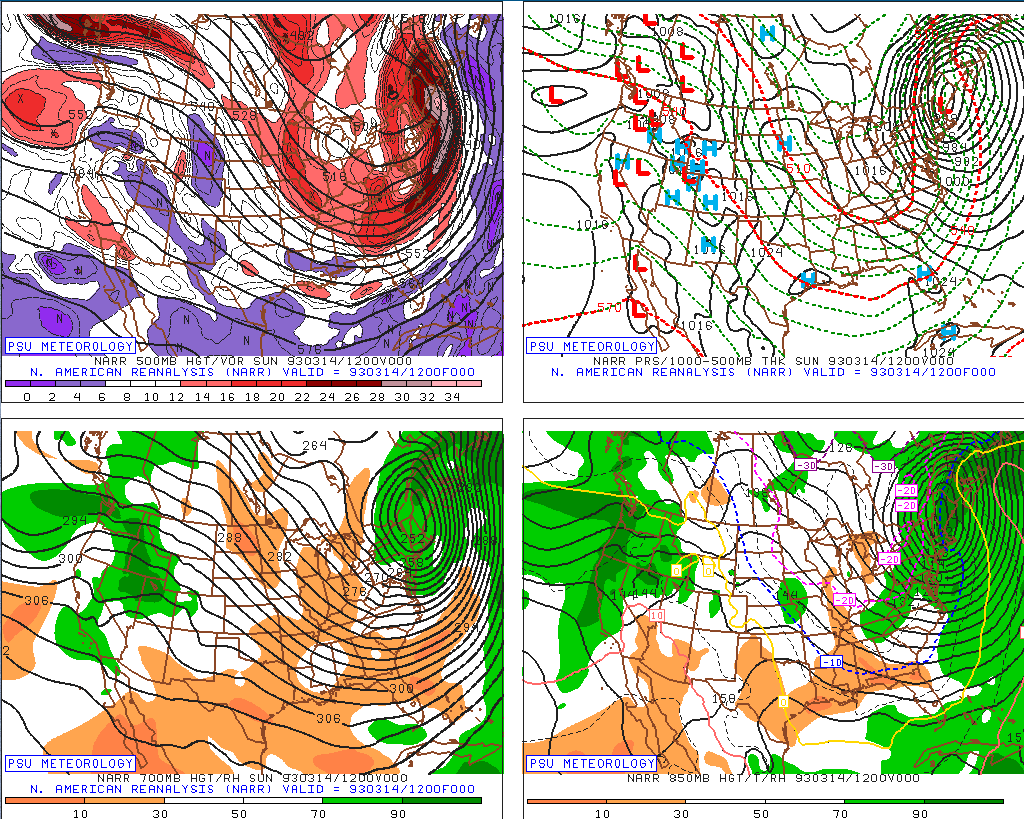
In addition, a trace of snow was recorded in Augusta, GA; Florence, SC; and Wilmington, NC. Even far to the south a trace of snow was recorded in unlikely places like Tallahassee, FL; Jacksonville, FL; and Fernandina Beach, FL. Weather Maps  through March 14, 1993 (0000 UTC)")
Airport Weather Observations Weather observations from nine local airports are provided for the period from 0000 UTC on March 12 through 2300 UTC on March 14, 1993. Look for large falls in pressure as the storm center crosses overhead, along with strong wind gusts and rapid temperature drops. Even along the coast light snow fell during the evening of March 13, 1993.
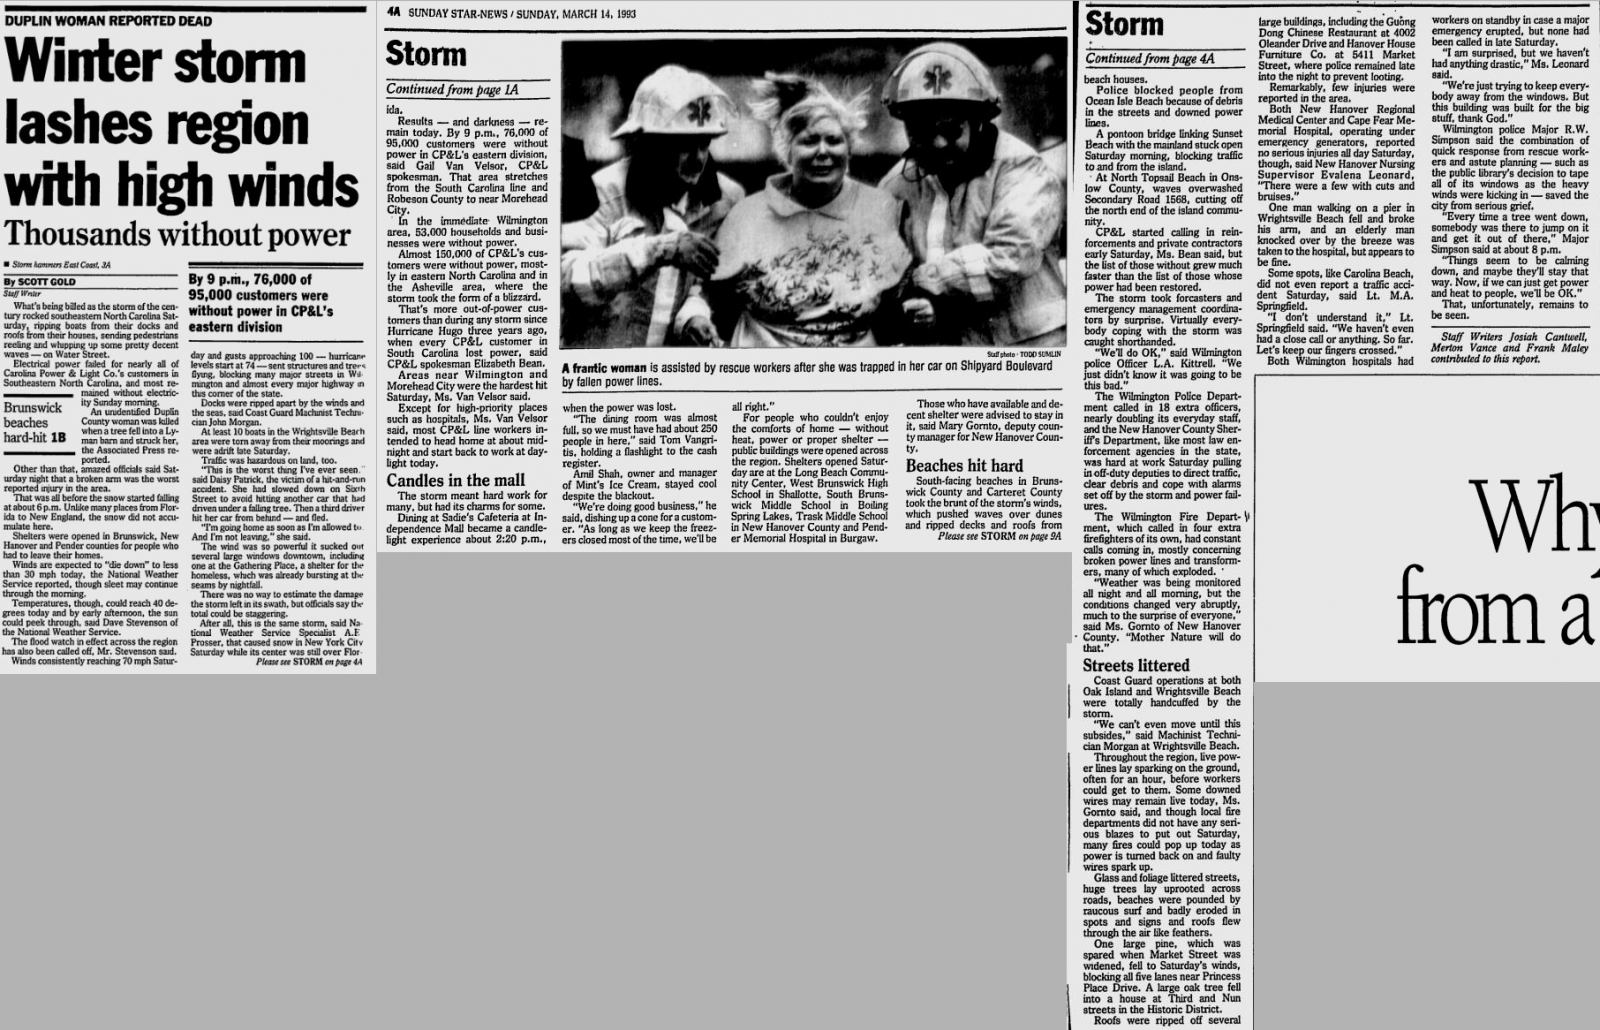
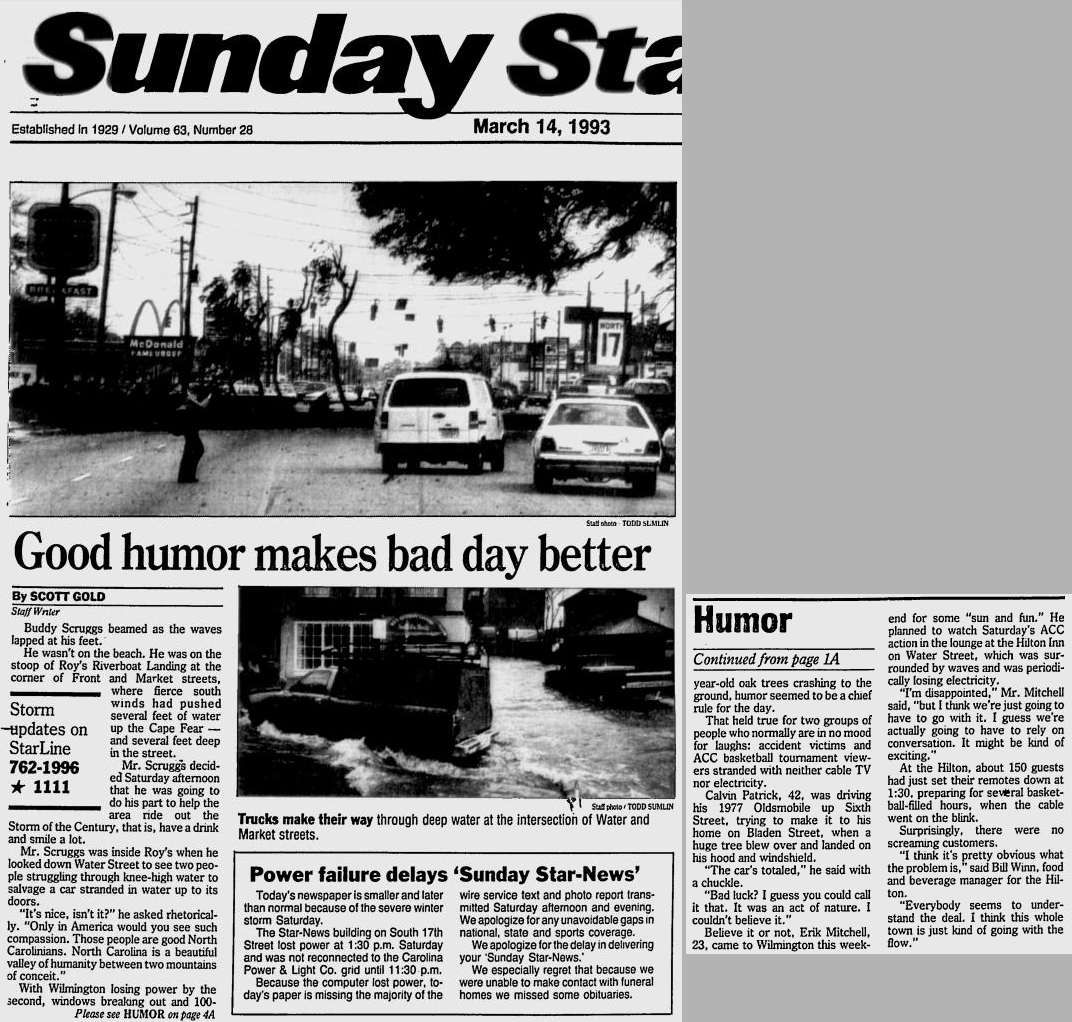
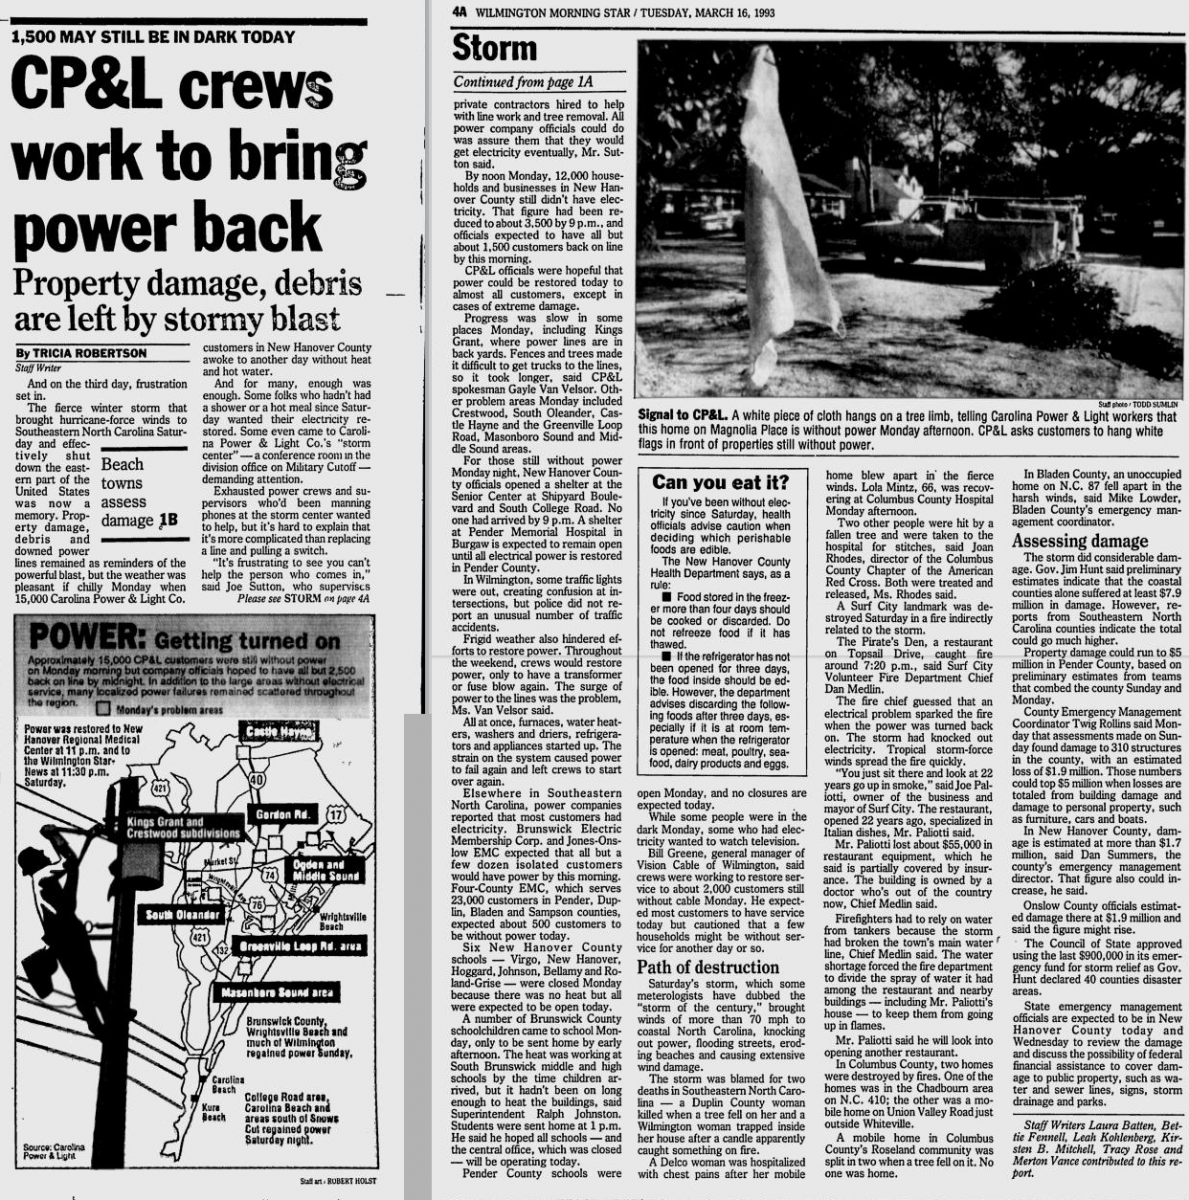
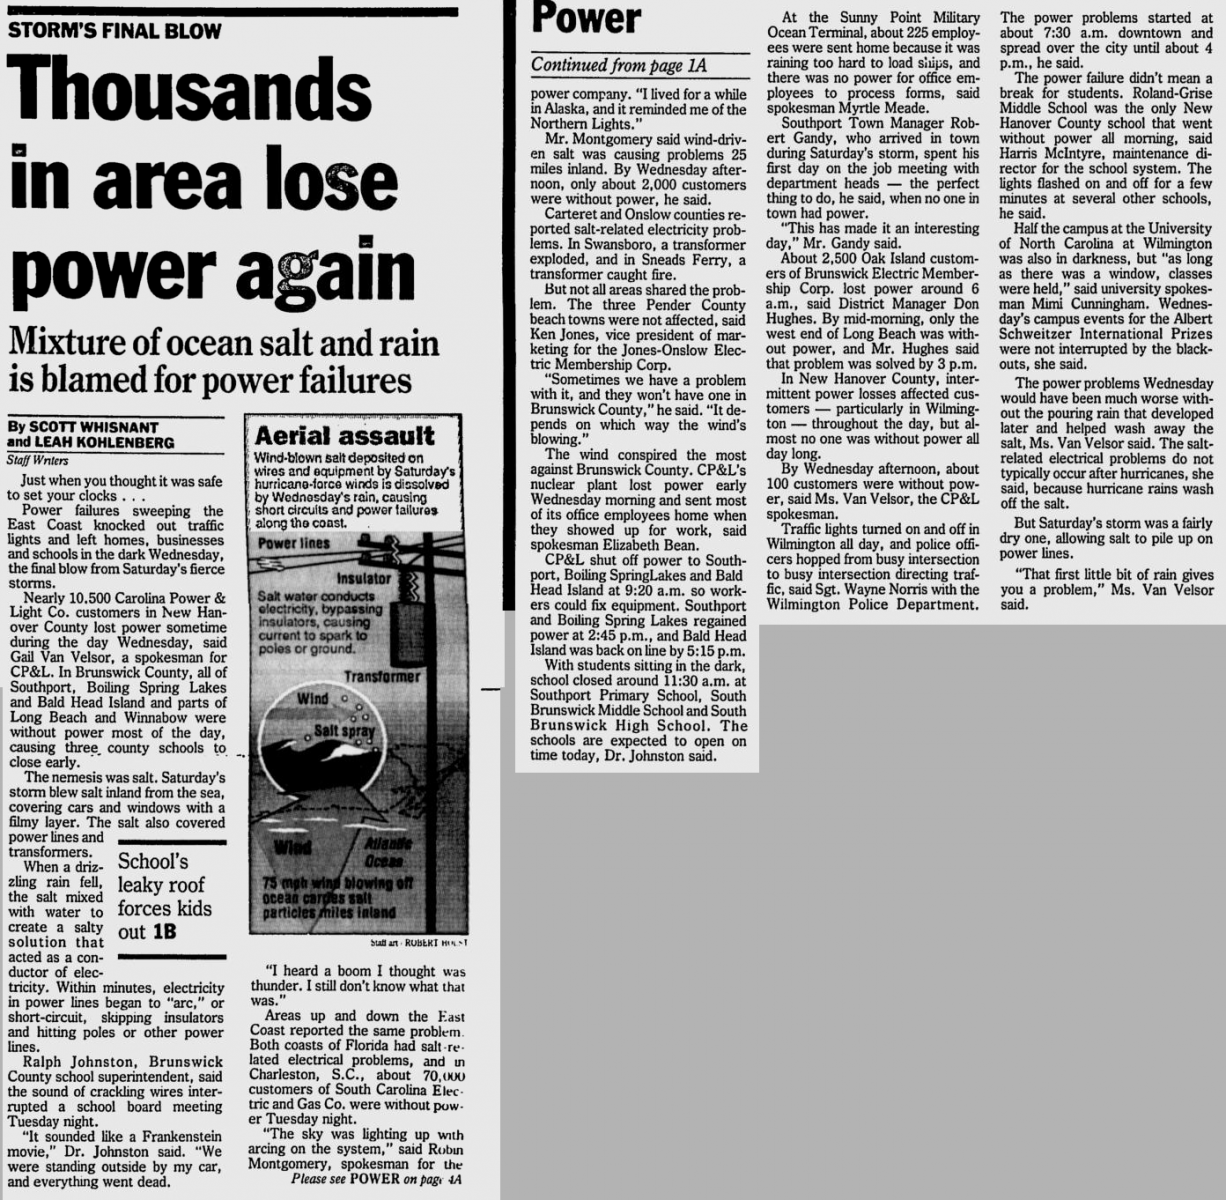
Human Impact The  1993 Superstorm moved across the densely populated eastern portion of the nation, with around 40% of the population of the United States directly affected by the storm. Upwards of 10 million electrical customers lost service due to the storm. An event summary from the National Climatic Data Center records the following death toll by state: 1993 Superstorm moved across the densely populated eastern portion of the nation, with around 40% of the population of the United States directly affected by the storm. Upwards of 10 million electrical customers lost service due to the storm. An event summary from the National Climatic Data Center records the following death toll by state:Florida: 44 Alabama: 16 Tennessee: 14 South Carolina: 1 Georgia: 15 North Carolina: 19 Kentucky: 5 Virginia: 13 West Virginia: 4 Maryland: 3 Pennsylvania: 49 New York: 23 Maine: 2 Every major airport on the U.S. East Coast was closed at one point by the storm. The volume of water dropped by the storm was immense: 44,000,000 acre-feet. (enough water to flood 44 million acres of land one foot deep) The volume of snow dropped by the Superstorm was computed at just under 13 cubic miles. Local Newspaper Reports  Here are some local stories about the Superstorm of 1993 from the Wilmington Star-News: Here are some local stories about the Superstorm of 1993 from the Wilmington Star-News:
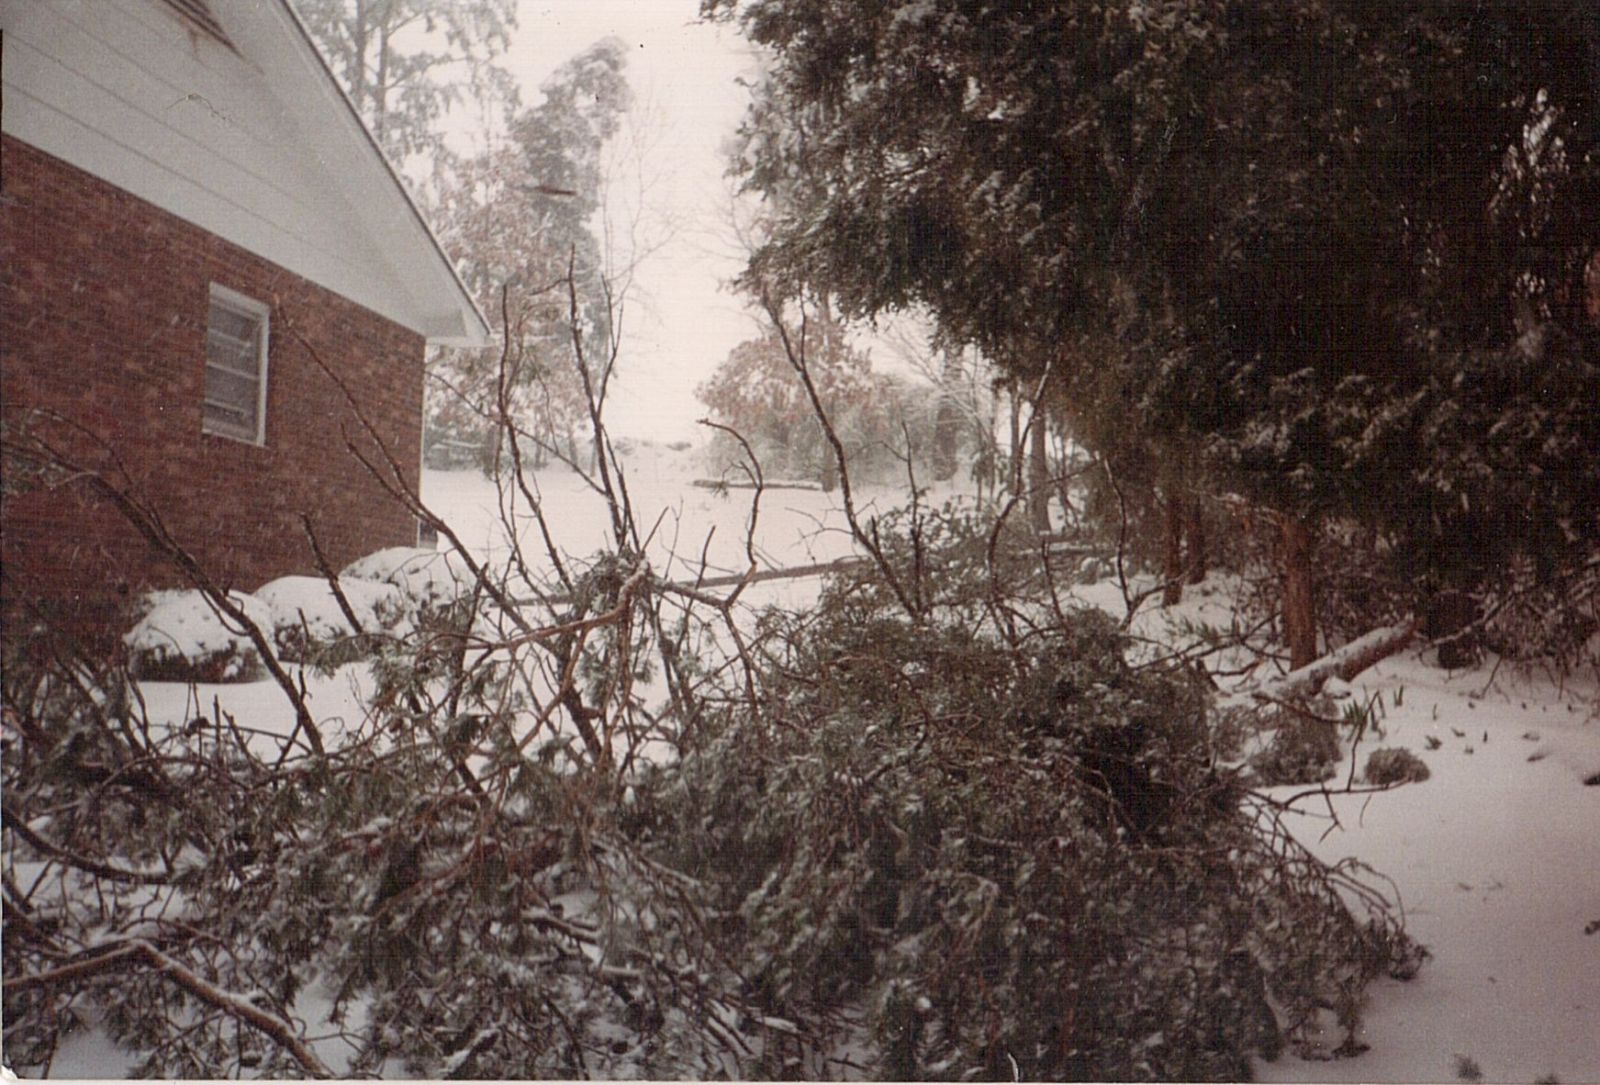
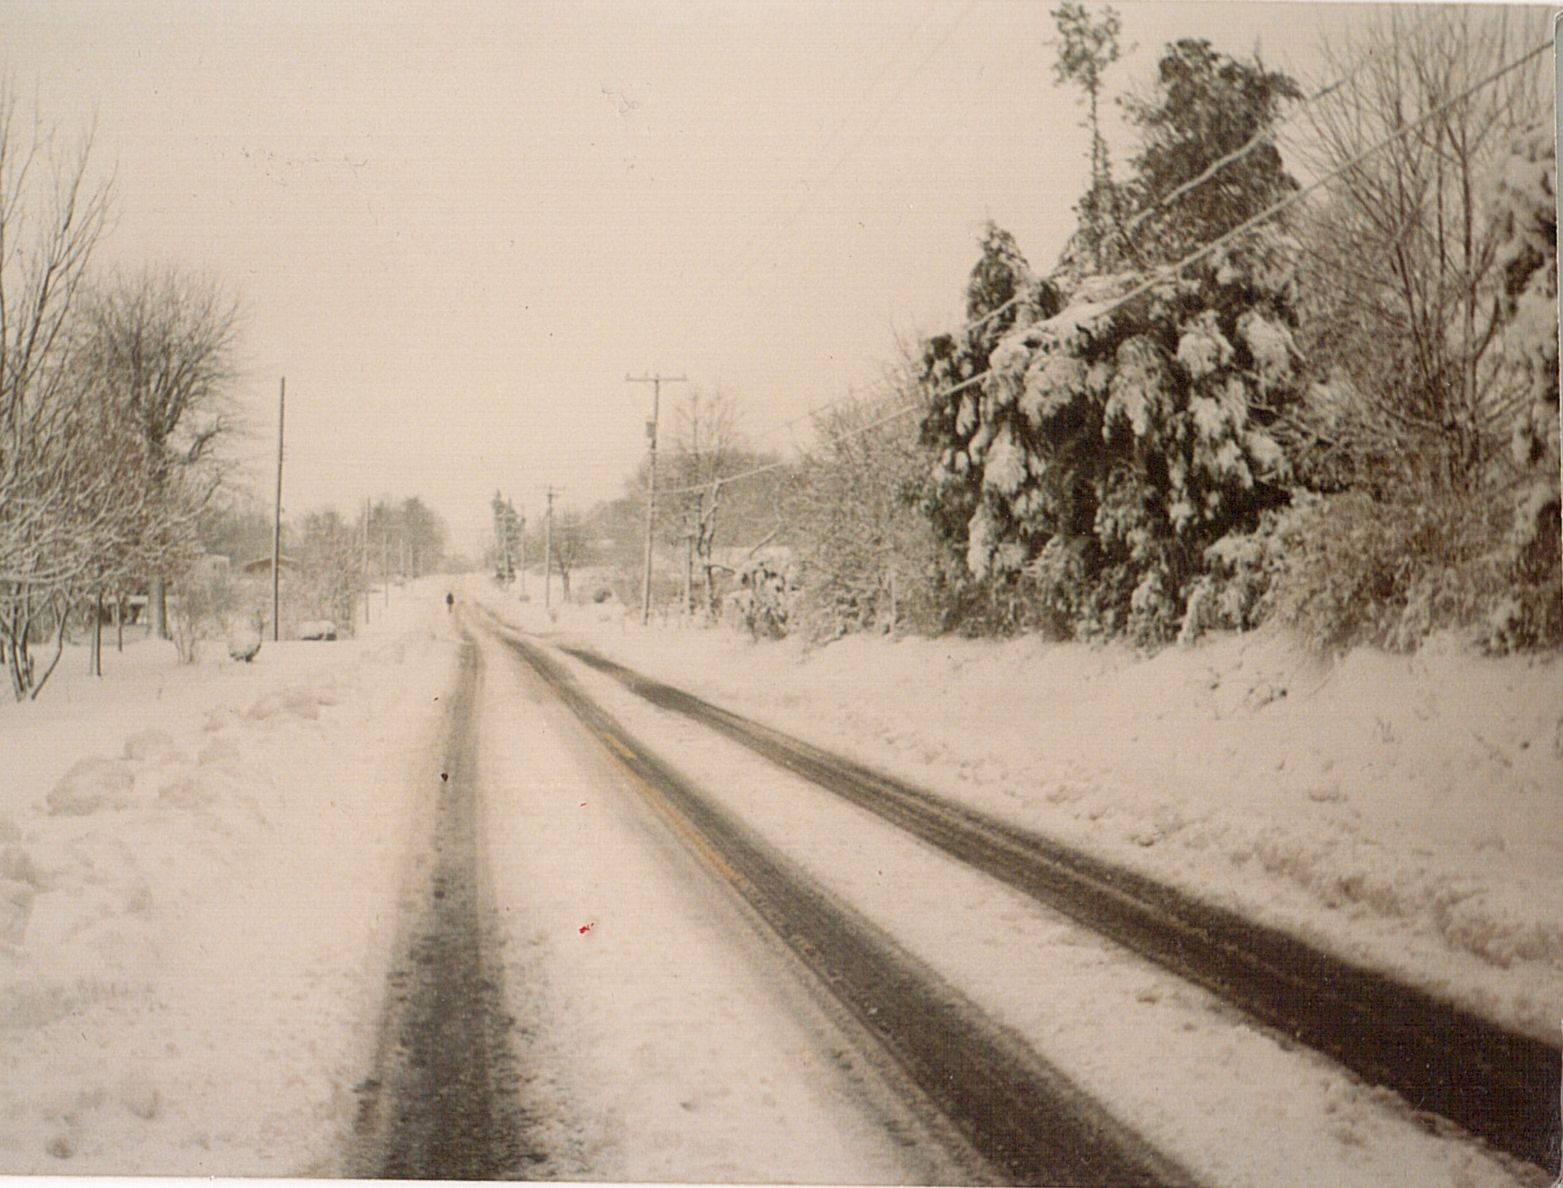
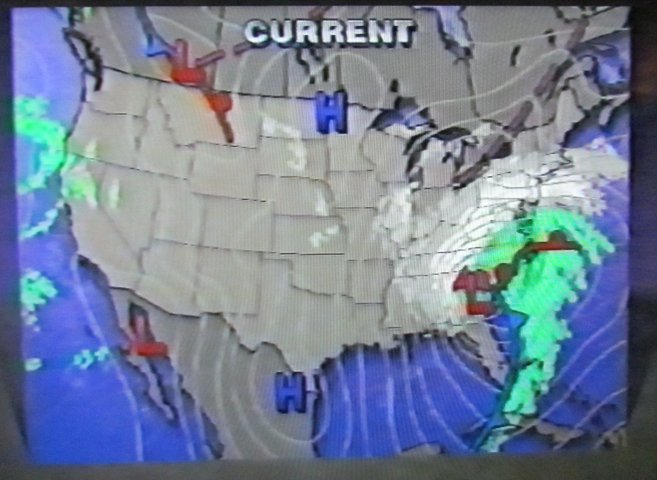
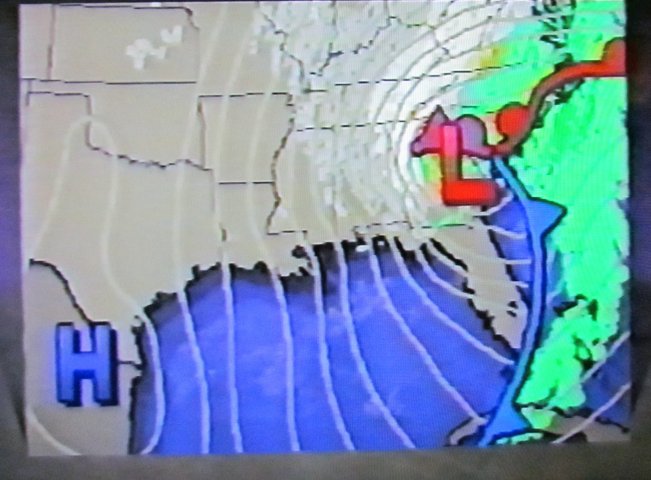
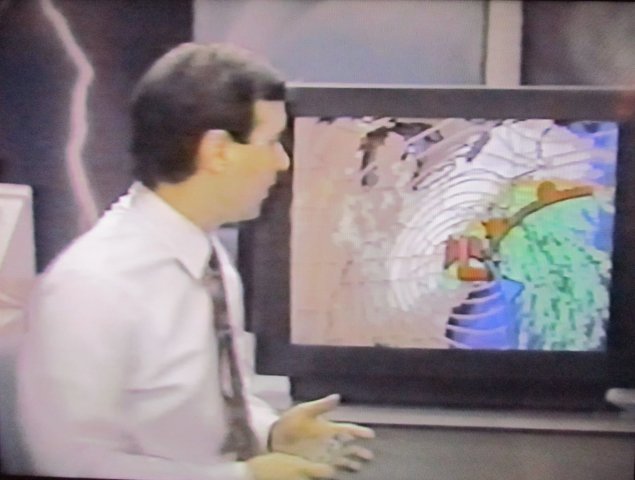
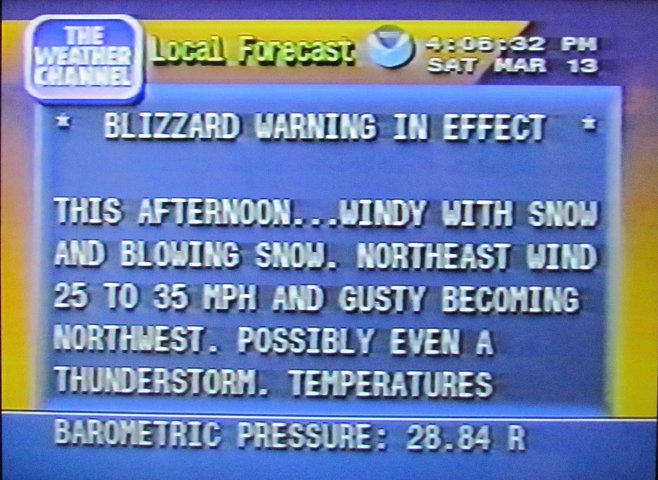
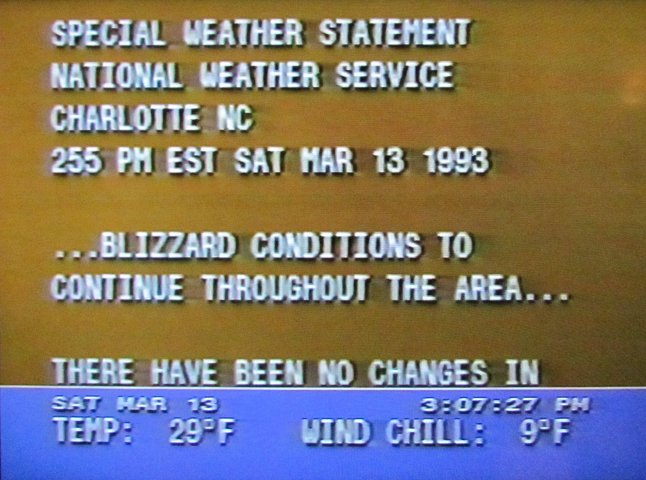
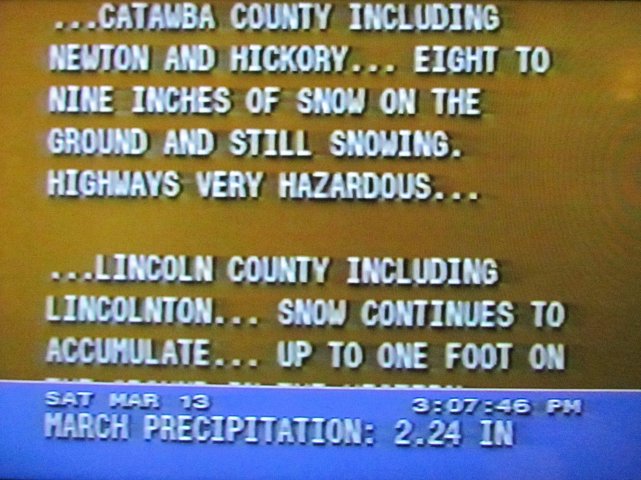
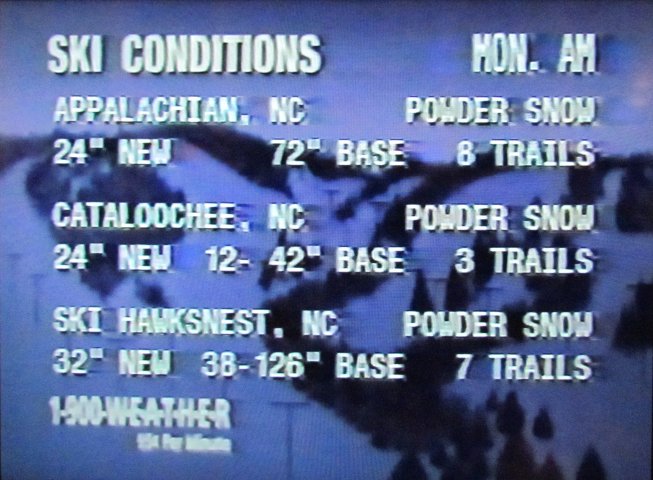
National Weather Service Products The National Climatic Data Center maintains an archive of all forecasts, discussions, warnings, and other products issued by all National Weather Service offices. Here are some interesting ones issued during the Superstorm of 1993. It is worth noting that despite the relatively primitive state of environmental modeling and meteorological data delivery in those days, forecasts and warnings before the storm accurately predicted the very significant event expected to unfold. State Forecast Discussions from Raleigh and Columbia Public Zone Forecasts from Raleigh and Columbia Local Forecast Updates from Charleston and Wilmington Coastal Waters Forecasts from Raleigh and Columbia Coastal Flood Warning from Raleigh High Wind Advisories/Warnings from Raleigh and Columbia Local Storm Reports Note: no tornadoes were confirmed in the Carolinas during the Superstorm Public Information Statements Personal Stories  When the Superstorm occurred, the author of this webpage was a high school student living in western North Carolina. This was the first time I had ever experienced an actual blizzard or observed thundersnow. Here are some scans of a “daily weather log” I kept that details the excitement this storm created in a future meteorologist. When the Superstorm occurred, the author of this webpage was a high school student living in western North Carolina. This was the first time I had ever experienced an actual blizzard or observed thundersnow. Here are some scans of a “daily weather log” I kept that details the excitement this storm created in a future meteorologist.During the early 1990s television and radio were the only methods of receiving realtime information about the storm. Here are some of my old photos I took and VCR screen captures from The Weather Channel’s coverage. Also included are two very informative videos of live storm coverage found online.
Technical Reports 93-01 Review of the Storm of the Century https://repository.library.noaa.gov/view/noaa/13837 93-03 Water Equivalent vs Rain Gauge Measurements from the March 1993 Blizzard: https://permanent.fdlp.gov/lps63357/tr9303.pdf Overview of the 12-14 March 1993 Superstorm: https://weather.gov/media/ilm/Overview_Kocin_Schumacher_Morales_Uccelini.pdf A Diagnostic Analysis of the Superstorm of March 1993: https://www.atmos.umd.edu/~dalin/huo-zhangyakum-superstorm-m95.pdf Natural Disaster Survey Report: https://www.weather.gov/media/publications/assessments/Superstorm_March-93.pdf Monthly Weather Review paper discussing model performance: https://atmos.uw.edu/~hakim/papers/dickinson_etal_1997.pdf The Superstorm Derecho: http://www.spc.noaa.gov/misc/AbtDerechos/casepages/mar12-131993page.htm Other links on the Superstorm of '93 NC State Climate Office Storm Summary: http://climate.ncsu.edu/climate/winter/event_details?e=129 NOAA Celebrating 200 Years: https://celebrating200years.noaa.gov/events/storm/welcome.html Various Still Satellite Images: http://ww2010.atmos.uiuc.edu/(Gh)/arch/cases/930312/sat/vis.rxml Hourly Automated Surface Maps of the Superstorm of 1993: http://ww2010.atmos.uiuc.edu/(Gh)/arch/cases/930312/sfc/xcn.rxml |


 Coastal Flood
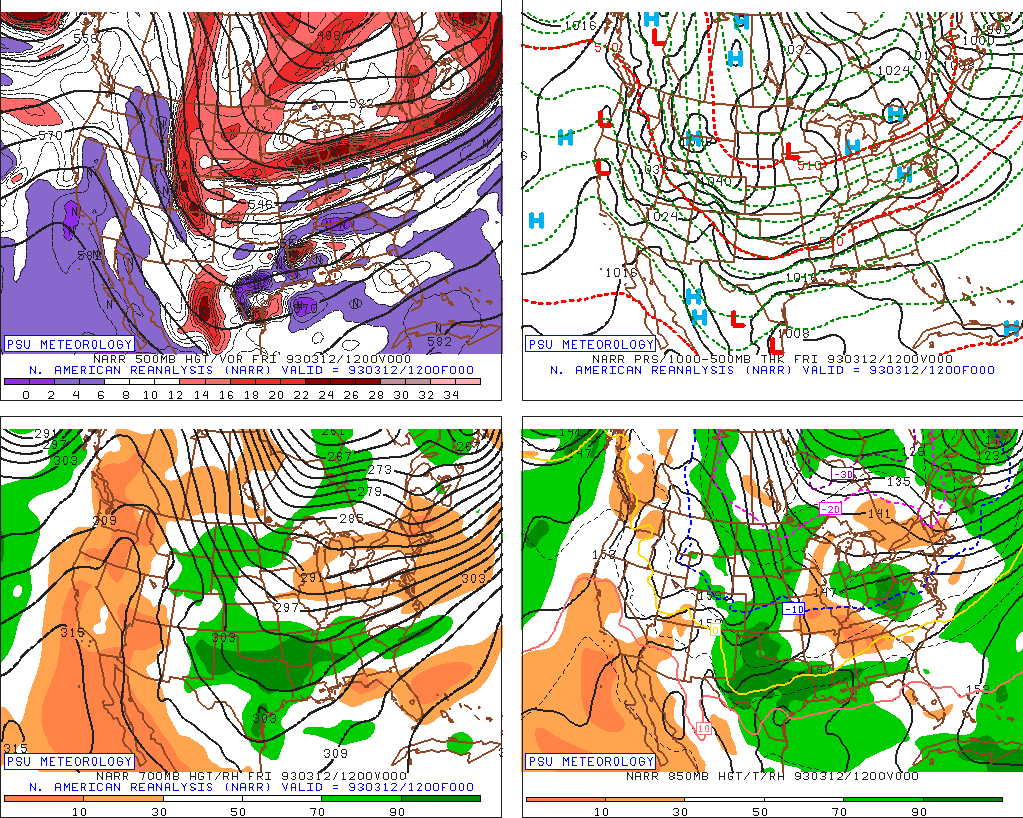