Climate.gov's El Niño/La Niña page
Current Conditions
| Tropical Pacific Sea Surface Temperatures | Tropical Pacific Sea Surface Temperature Anomalies |
 |
 |
| Tropical Pacific sea surface temperatures (left image) and associated anomalies (right image). An unusually warm strip of sea surface temperatures oriented west to east across the central and eastern equatorial Pacific Ocean is typical of El Niño conditions. La Nina conditions are indicated by anomalously cool water temperatures. | |
Quick Facts
What are El Niño and La Niña?
El Niño and La Niña are two of the most important climate phenomena on Earth due to their ability to change the global atmospheric circulation, which in turn influences temperature and precipitation across the globe. We also focus on El Niño and La Niña because we can often predict their arrival a few seasons in advance of the strongest impacts on weather and climate
How did El Niño get its name? South American fisherman noticed a warm up of coastal waters that occurred every so often around Christmas. They referred to the warming as “El Niño,” (niño being Spanish for a boy child) in connection with the Christmas holiday. In the 1980s the term La Niña began being used for the cooling of those waters.
 |
|
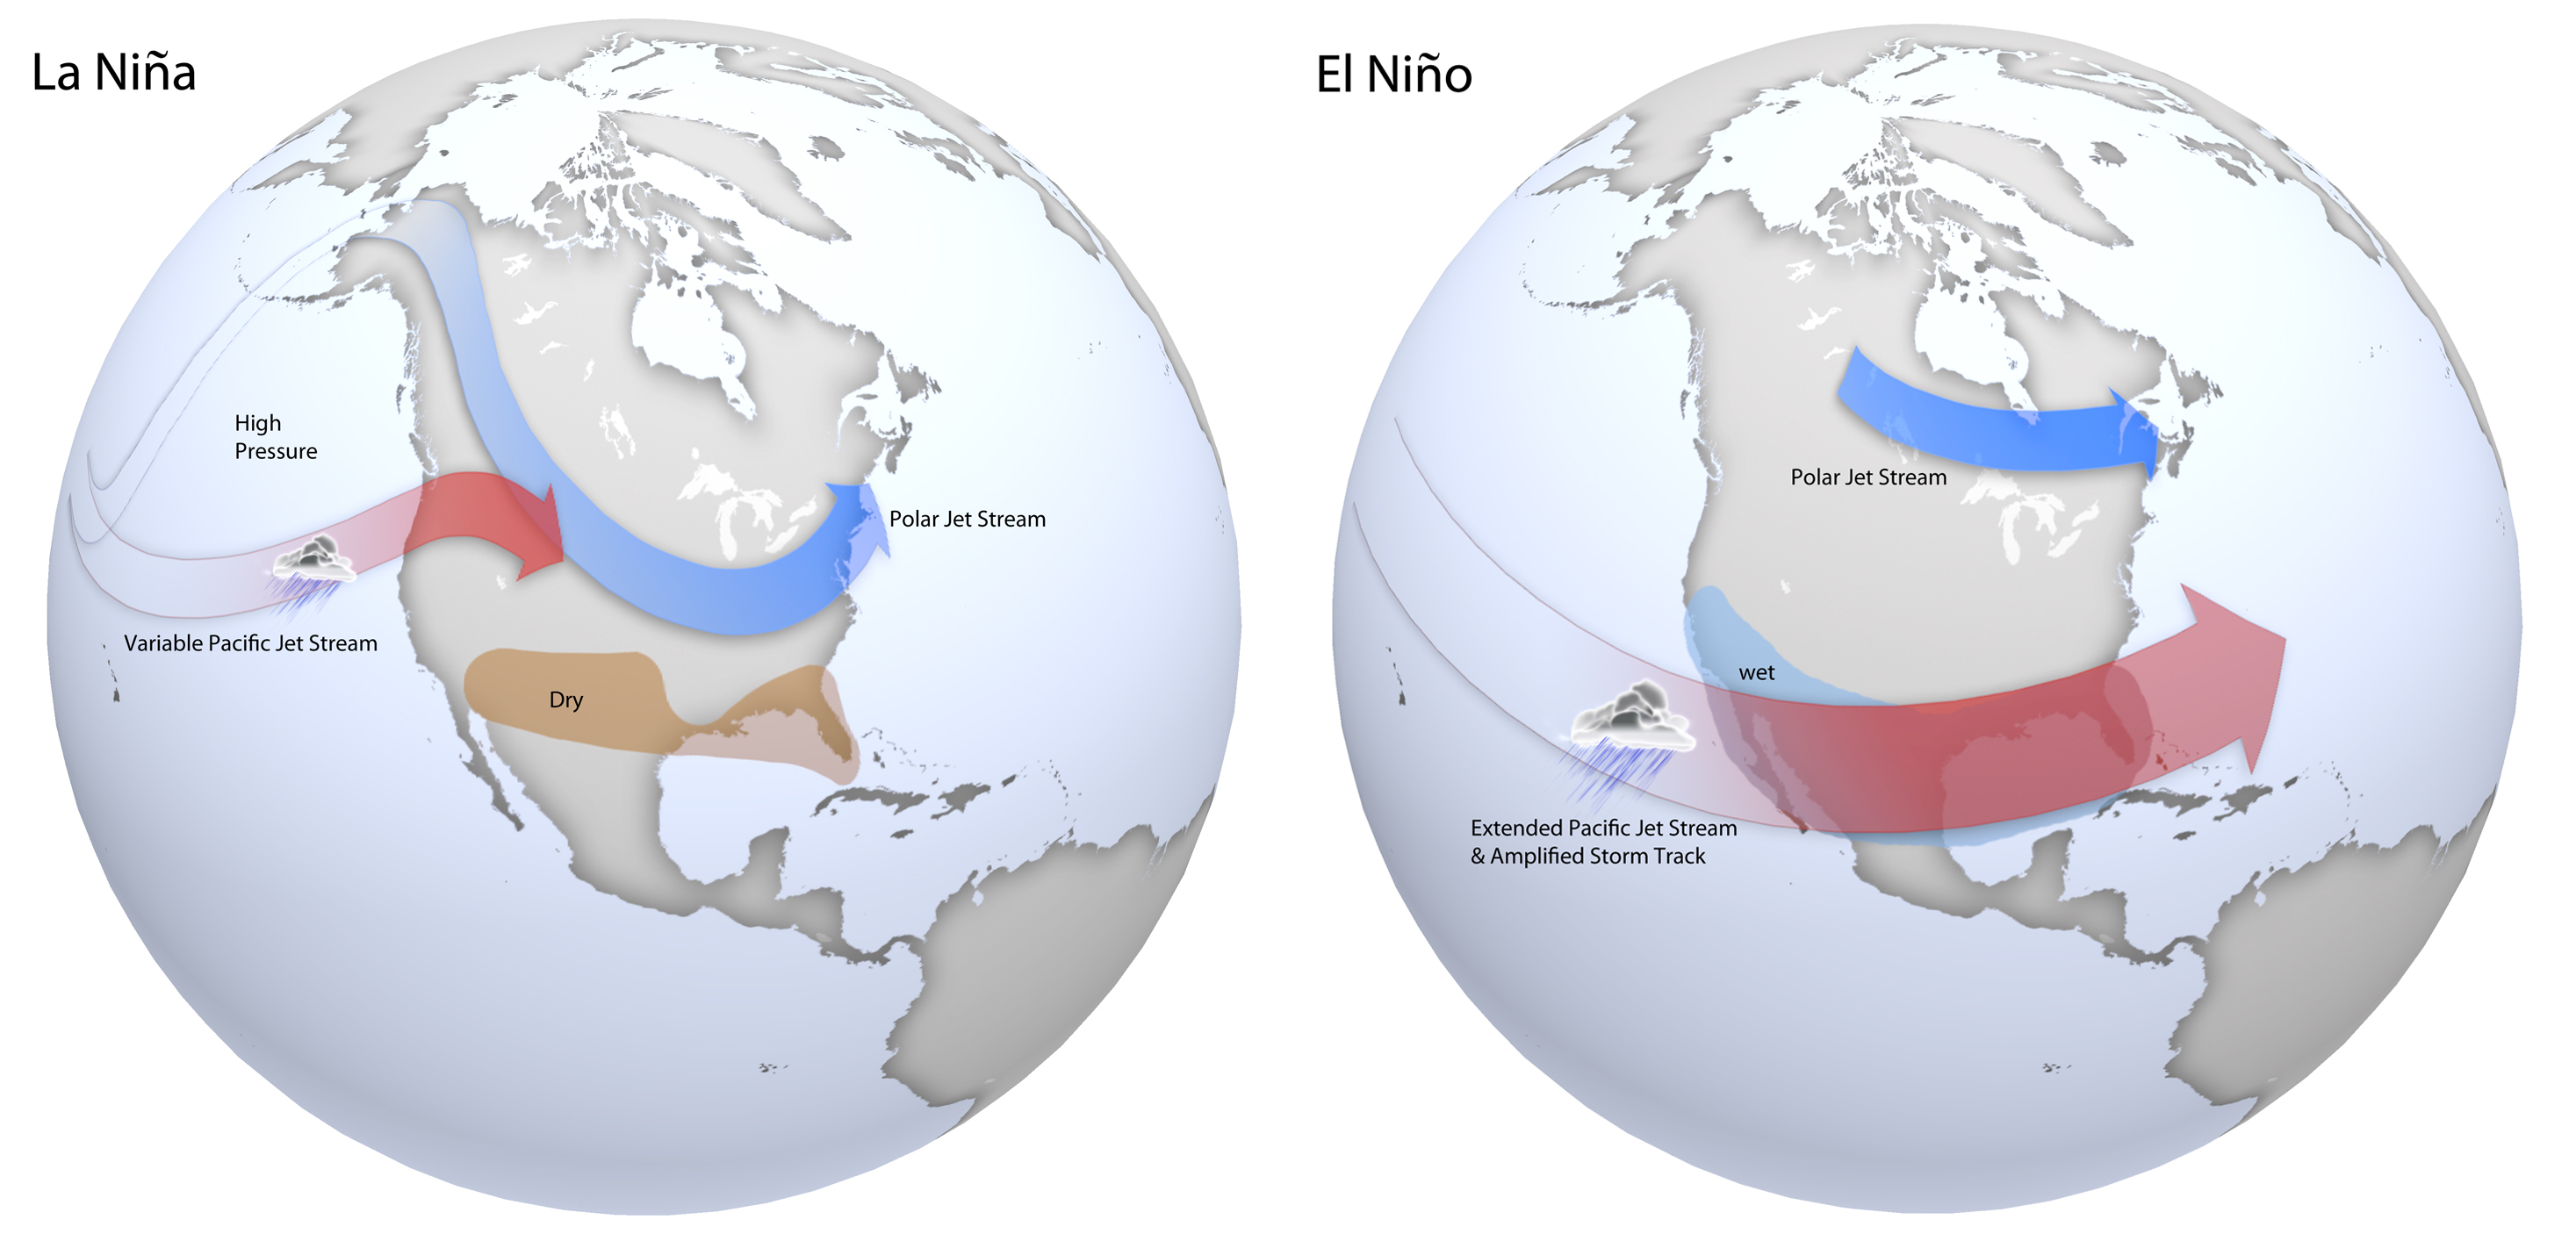
Typical late fall through early spring upper level jet stream positions associated with moderate to strong La Niña (left) and El Niño (right) events. During La Niña, a variable Pacific jet stream in association with a polar jet stream shifted further south favors below normal precipitation across the southern US, with below normal temperatures across the northern US. During El Niño, a strong and amplified Pacific jet stream extending across the southern US in association with a polar jet stream shifted further north into Canada favors above normal precipitation across the southern US, and above normal temperatures over the northern US. Based on original graphics from NOAA’s Climate Prediction Center. 2-page ENSO Fact Sheet |
How Do El Niño and La Niña Impact Central Kentucky and Southern Indiana Weather?
Effects from El Niño and La Niña tend to be small across the Ohio Valley. However, moderate and especially strong events do at times affect the region, especially during the mid winter through spring months. The following graphics depict November through March temperature and precipitation anomalies associated with nine of the strongest El Niño and La Niña episodes. These composites DO NOT represent a forecast of expected conditions.
El Niño
 |
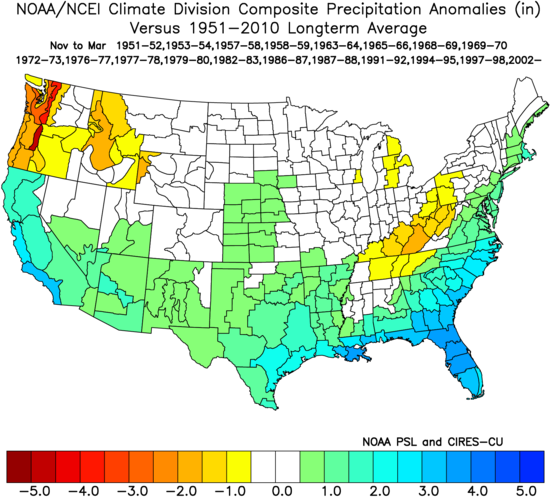 |
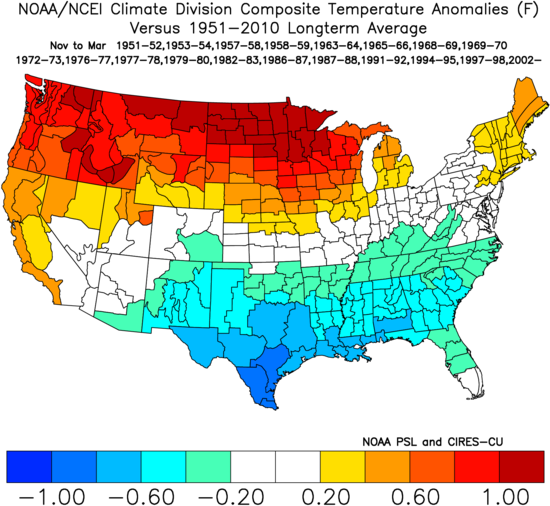
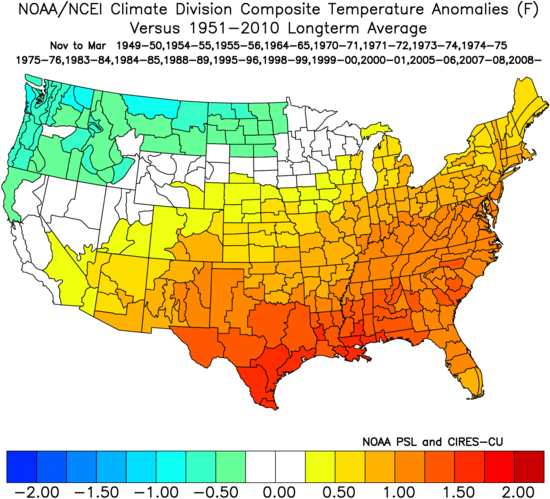
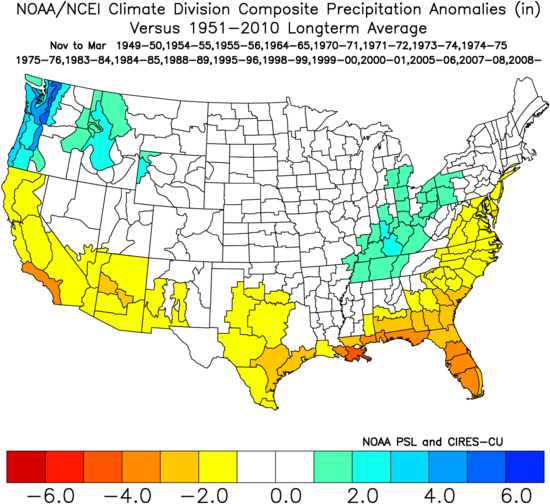
| November-March Temperature Anomalies | November-March Precipitation Anomalies |
These composites do not represent a forecast of expected conditions. November through March temperature and precipitation anomalies determined from El Niño episodes since 1950 are shown above. Warm colors indicate above normal temperatures (left) and below normal precipitation (right), while cool colors indicate below normal temperatures (left) and above normal precipitation (right). The temperature signal for our area is fairly weak. There is a better signal for precipitation, as we are often drier than normal during El Niño. Images courtesy of NOAA's Earth System Research Laboratory.
La Niña
 |
 |
| November-March Temperature Anomalies | November-March Precipitation Anomalies |
These composites do not represent a forecast of expected conditions. November through March temperature and precipitation anomalies from La Niña episodes since 1950 are shown above. Warm colors indicate above normal temperatures (left) and below normal precipitation (right), while cool colors indicate below normal temperatures (left) and above normal precipitation (right). The Ohio and Tennessee Valleys tend to have increased precipitation and warmer temperatures during LaNiña . Images courtesy of NOAA's Earth System Research Laboratory.
El Niño: Risk of Temperature/Precipitation Extremes
The images below depict the odds of extreme wet/dry or warm/cold fall-spring months associated with historical El Niño episodes. Extreme weather is defined as being in the highest or lowest 20% of the climatological record. These composites do not represent a forecast of expected conditions.
El Niño: Risk of Temperature Extremes
 |
 |
 |
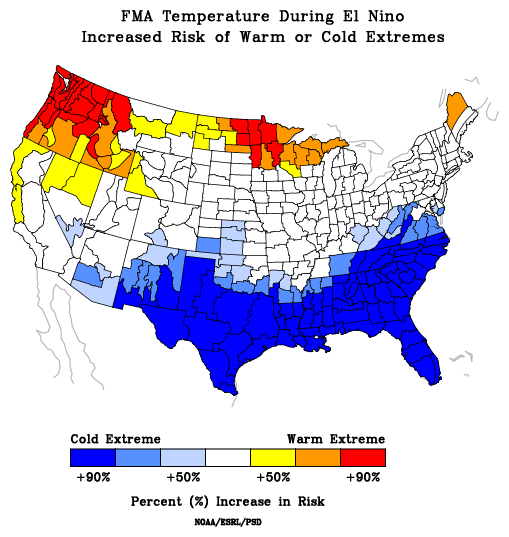 |
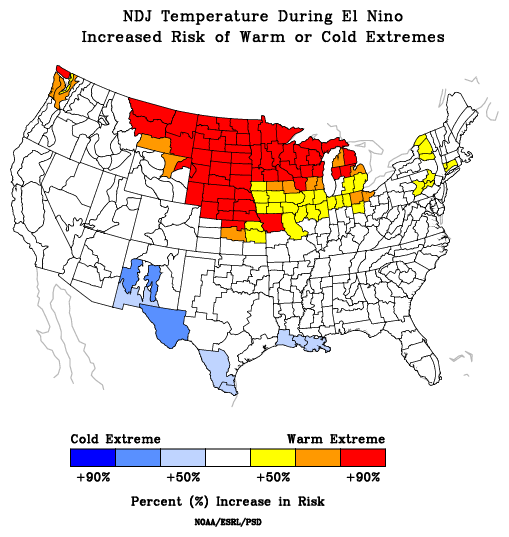
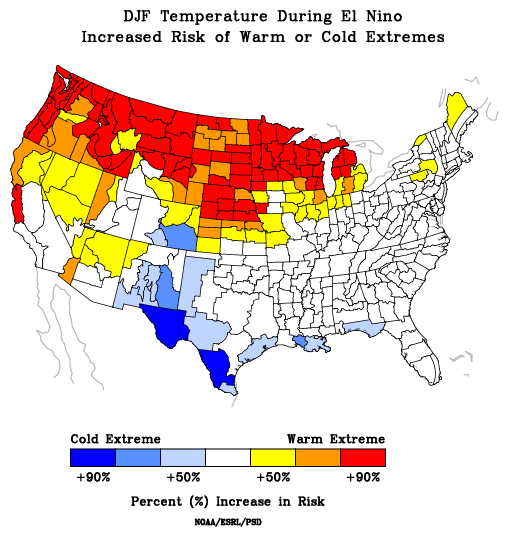
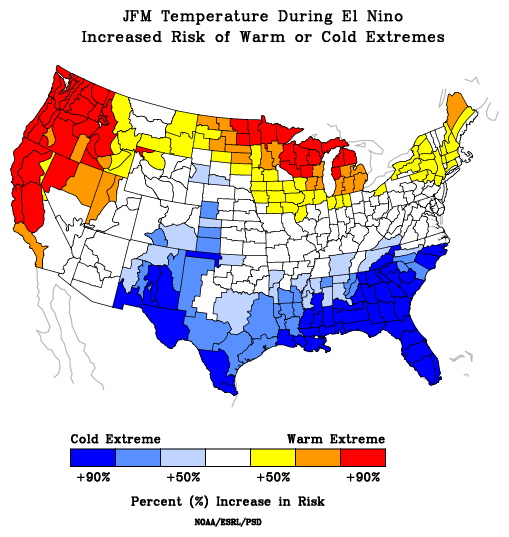
| November - January | December - February | January - March | February - April |
These composites do not represent a forecast of expected conditions. The above four images depict the odds of extreme warm or cold fall-spring months associated with past El Niños. Extreme weather is defined as being in the warmest or coldest 20% of the climatological record. Warm colors indicate an increased risk of warm temperature extremes, while cool colors indicate an increased risk of cold temperature extremes. Click the images to enlarge. Images courtesy of NOAA's Earth System Research Laboratory.
El Niño: Risk of Precipitation Extremes
 |
 |
 |
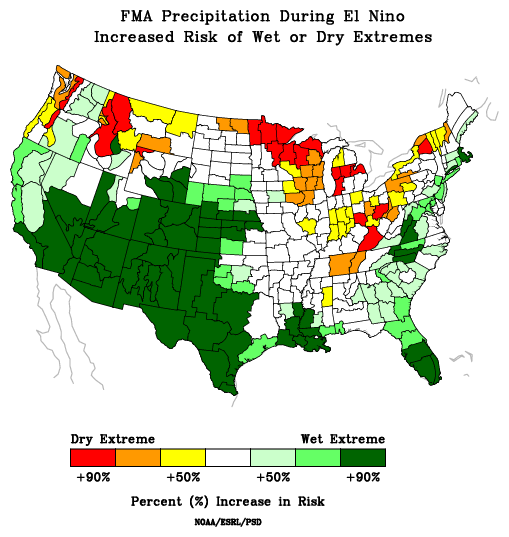 |
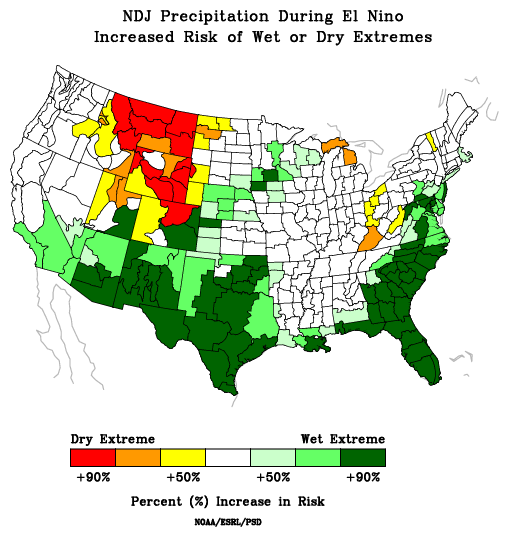
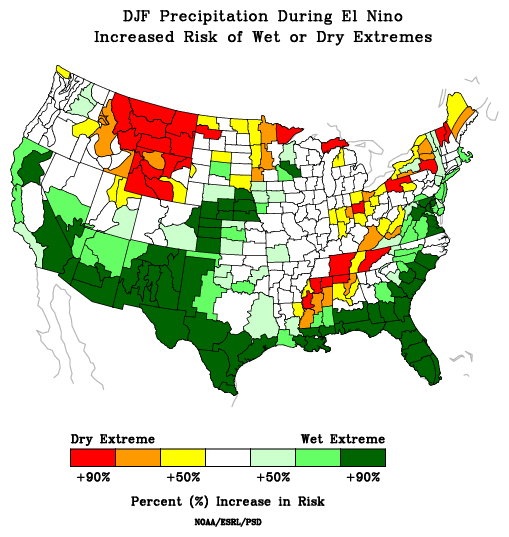
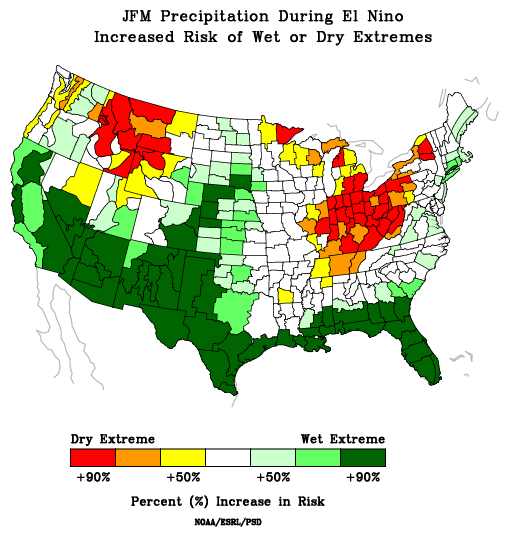
| November - January | December - February | January - March | February - April |
These composites do not represent a forecast of expected conditions. The above images depict the odds of extreme wet or dry fall-spring months associated with past El Niños. Extreme weather is defined as being in the wettest or driest 20% of the climatological record. Warm colors indicate an increased risk of dry precipitation extremes, while green colors indicate an increased risk of wet precipitation extremes. Click the images to enlarge. Images courtesy of NOAA's Earth System Research Laboratory.
La Niña: Risk of Temperature/Precipitation Extremes
The images below depict the odds of extreme wet/dry or warm/cold fall-spring months associated with historical La Niña episodes. Extreme weather is defined as being in the highest or lowest 20% of the 100 year record. These composites do not represent a forecast of expected conditions.
La Niña: Risk of Temperature Extremes
 |
 |
 |
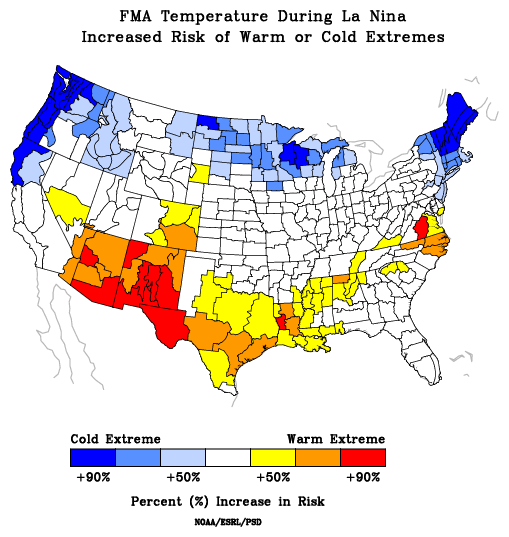 |
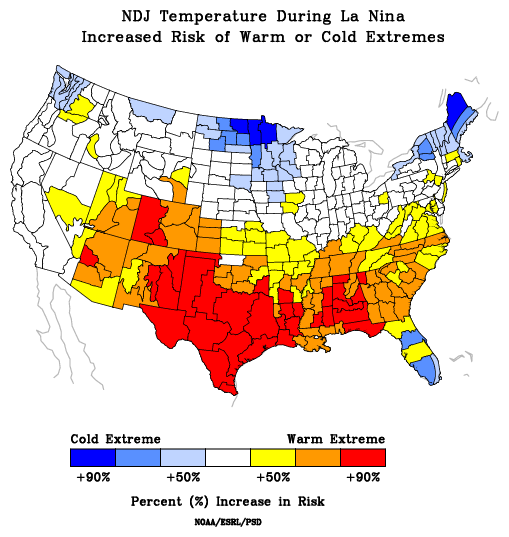
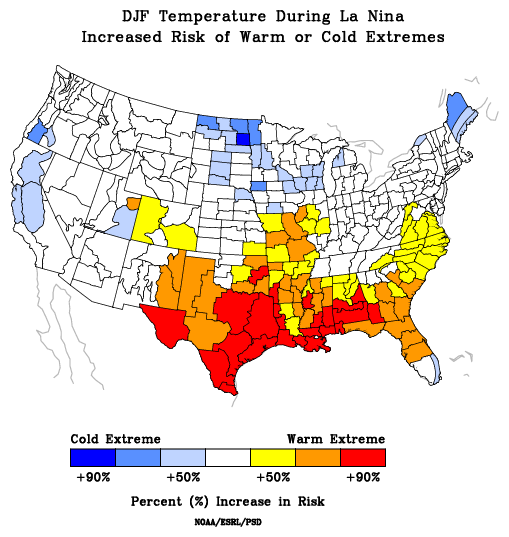
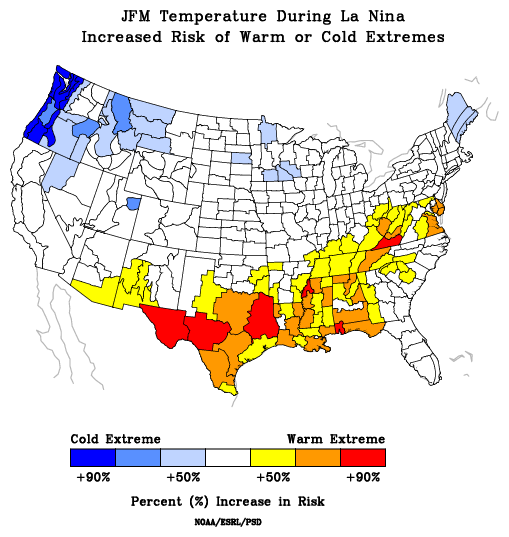
| November - January | December - February | January - March | February - April |
These composites do not represent a forecast of expected conditions. The above images depict the odds of extreme warm or cold fall-spring months associated with past La Niña's. Extreme weather is defined as being in the warmest or coldest 20% of the climatological record. Warm colors indicate an increased risk of warm temperature extremes, while cool colors indicate an increased risk of cold temperature extremes. Click the images to enlarge. Images courtesy of NOAA's Earth System Research Laboratory.
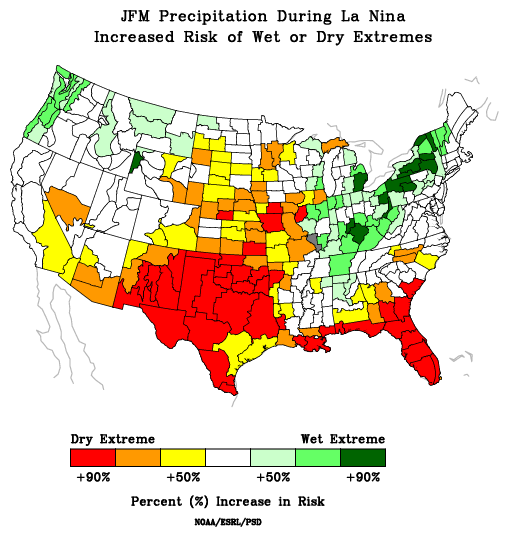
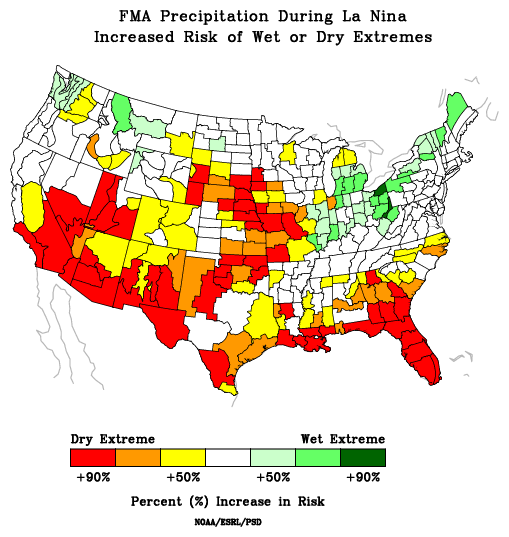
La Niña: Risk of Precipitation Extremes
 |
 |
 |
 |
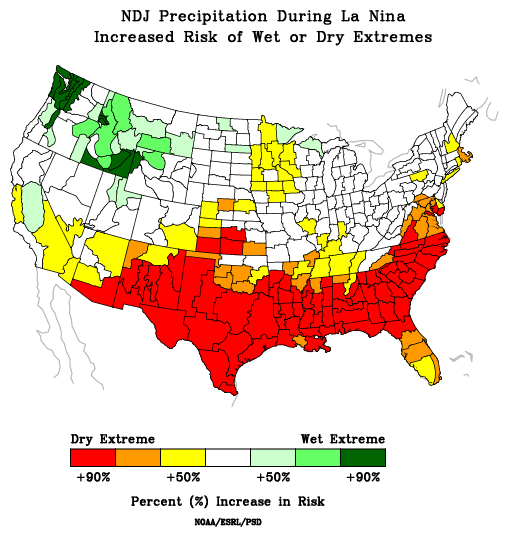
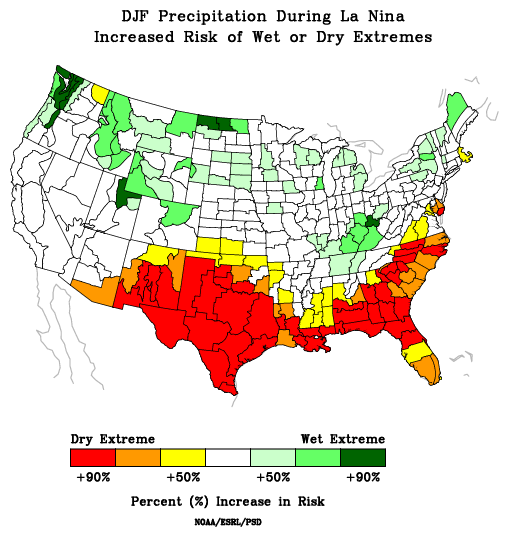
| November - January | December - February | January - March | February - April |
These composites do not represent a forecast of expected conditions. The above images depict the odds of extreme wet or dry fall-spring months associated with past La Niña's. Extreme weather is defined as being in the wettest or driest 20% of the climatological record. Warm colors indicate an increased risk of dry precipitation extremes, while green colors indicate an increased risk of wet precipitation extremes. Click the images to enlarge. Images courtesy of NOAA's Earth System Research Laboratory.
Official Long-Range Forecasts
Below are official long-range forecasts issued by the Climate Prediction Center (CPC). Climatologists at CPC take into account many different factors when assembling these forecasts, including El Niño/La Niña.
One-Month Forecast
 |
 |
| Chances of Above/Below Normal Temperatures | Chances of Above/Below Normal Precipitation |
Three-Month Forecast
 |
 |
| Chances of Above/Below Normal Temperatures | Chances of Above/Below Normal Precipitation |
El Niño/La Niña & Spring Severe Thunderstorm Frequency
A paper published in Nature Geoscience in April 2015 examines the influence of El Niño/La Niña on springtime hailstorms and tornadoes across the contiguous United States from late winter through spring. The images below are adapted from that paper and show tornado and hail frequencies for the spring months (March-May) during El Niño (left column) and La Niña (right column). The authors mention that the connection between El Niño/La Niña conditions and summertime storms is less clear.
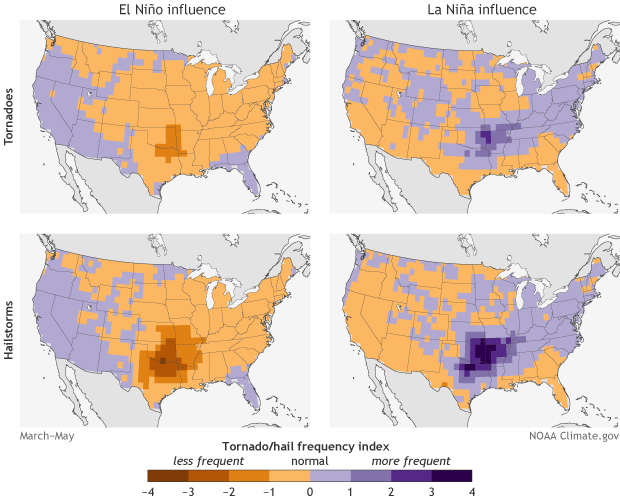 |
| Tornado and hail frequencies for the spring months (March-May) during El Niño (left column) and La Niña (right column). Purple favors higher storm event frequency, and brown favors lower storm event frequency. Specifics vary, but in general, springtime tornadoes and hailstorms are less frequent in the central and southern United States during El Niño, and more frequent during La Niña. Image courtesy of NOAA climate.gov. |


 Weather Story
 Weather Map
 Local Radar