This page presents a 75-year climatology of severe weather reports in the NWS Chicago forecast area which covers portion of northern Illinois and northwestern Indiana. The information herein can provide additional detail to the frequency and magnitude of local severe weather as well as rankings of the most significant events by year, number of reports, and days with at least one report. All statistics were derived by collecting and analyzing certified storm reports in NOAA's StormData publication for all counties currently being served by NWS Chicago. Edits were made to a small number of reports owing to known data quality problems within StormData (i.e., Edwards et al. 2018) and to thread together tornado reports (which were initially partitioned by county).
Throughout this and linked pages, severe weather may be referred to "significant or "non-significant," as defined below:
| Tornado (EF Scale) | Damaging Wind Gust (More info) | Hail Diameter | |
| All Report | Any Rating | Any Speed >= 58 mph | Any Size >=1" |
| Significant Report | F/EF2, F/EF3, F/EF4, F/EF5 | >= 75 mph | >= 2" |
| Non-Significant Report | F/EFU, F/EF0, F/EF/1 | < 75 mph |
< 2" |
Page last updated: May 2025
Period of record: 1950 - 2024
Find any errors or have questions? Email nws.chicago@noaa.gov
Annual Averages
Averages by Report
The table below shows the average number of severe weather reports in our local area broken into several groups:
| Annual Severe Weather Reports | Any Severe Weather Reports | Significant Reports | Non-Significant Reports |
| 10-Year Average | 345 reports | 38 reports | 308 reports |
| 20-Year Average | 330 reports | 36 reports | 293 reports |
| 30-Year Average | 263 reports | 27 reports | 236 reports |
| 75-Year Average | 118 reports | 14 reports | 105 reports |
| Tornado Reports |
Any Tornado Reports (F/EF0+ or EF-U) |
Significant Tornado Reports (F/EF2+) |
Non-Significant Tornado Reports (F/EF0-1 or EF-U) |
| 10-Year Average | 26 reports | 1 report | 24 reports |
| 20-Year Average | 19 reports | 2 reports | 17 reports |
| 30-Year Average | 16 reports | 1 reports | 14 reports |
| 75-Year Average | 11 reports | 2 reports | 9 reports |
| Damaging Wind Reports |
Any Wind Reports (>=58 mph) |
Significant Wind Reports (>75 mph) |
Non-Significant Wind Reports (<75 mph) |
| 10-Year Average | 245 reports | 31 reports | 212 reports |
| 20-Year Average | 240 reports | 31 reports | 209 reports |
| 30-Year Average | 188 reports | 22 reports | 166 reports |
| 75-Year Average | 80 reports | 10 reports | 70 reports |
| Damaging Hail Reports |
Any Hail Reports (>=1") |
Significant Hail Reports (>=2") |
Non-Significant Hail Reports (<2") |
| 10-Year Average | 75 reports | 5 reports | 69 reports |
| 20-Year Average | 71 reports | 4 reports | 67 reports |
| 30-Year Average | 60 reports | 4 reports | 56 reports |
| 75-Year Average | 28 reports | 2 reports | 26 reports |
10-year average range: 2015-2024 | 20-year average range: 2005-2024 | 30-year average range: 1995-2024 | Database average range: 1950-2024
Averages by Days with at least One Report
The table below shows the average number of days with at least one report of severe weather reports in our local area broken into several groups:
Since all days with any severe weather reported are treated equally regardless of the number of reports (e.g. a day with 100 reports is treated the same as a day with 2 reports), the table below provides the best "snapshot" of the frequency of severe weather as well as individual hazards in our local area.
| Annual Severe Weather Days | Any Severe Weather Days | Significant Severe Days | Non-Significant Severe Days |
| 10-Year Average | 28 days | 7 days | 28 days |
| 20-Year Average | 29 days | 8 days | 29 days |
| 30-Year Average | 26 days | 7 days | 26 days |
| 75-Year Average | 16 days | 5 days | 16 days |
| Tornado Days |
Any Tornado Days (F/EF0+ or EF-U) |
Significant Tornado Days (F/EF2+) |
Non-Significant Tornado Days (F/EF0-1 or EF-U) |
| 10-Year Average | 7 days | 1 day | 7 days |
| 20-Year Average | 6 days | 1 day | 6 days |
| 30-Year Average | 5 days | 1 day | 5 days |
| 75-Year Average | 5 days | 1 day | 4 days |
| Damaging Wind Days |
Any Wind Days (>=58 mph) |
Significant Wind Days (>75 mph) |
Non-Significant Wind Days (<75 mph) |
| 10-Year Average | 24 days | 6 days | 23 days |
| 20-Year Average | 24 days | 7 days | 24 days |
| 30-Year Average | 21 days | 5 days | 21 days |
| 75-Year Average | 11 days | 3 days | 11 days |
| Damaging Hail Days |
Any Hail Days (>=1") |
Significant Hail Days (>=2") |
Non-Significant Hail Days (<2") |
| 10-Year Average | 11 days | 2 days | 11 days |
| 20-Year Average | 13 days | 2 days | 13 days |
| 30-Year Average | 12 days | 2 days | 12 days |
| 75-Year Average | 7 days | 1 day | 7 days |
10-year average range: 2015-2024 | 20-year average range: 2005-2024 | 30-year average range: 1995-2024 | Database average range: 1950-2024
Time of Year
In this section, the climatology of severe weather by time of year in the NWS Chicago forecast area is displayed.
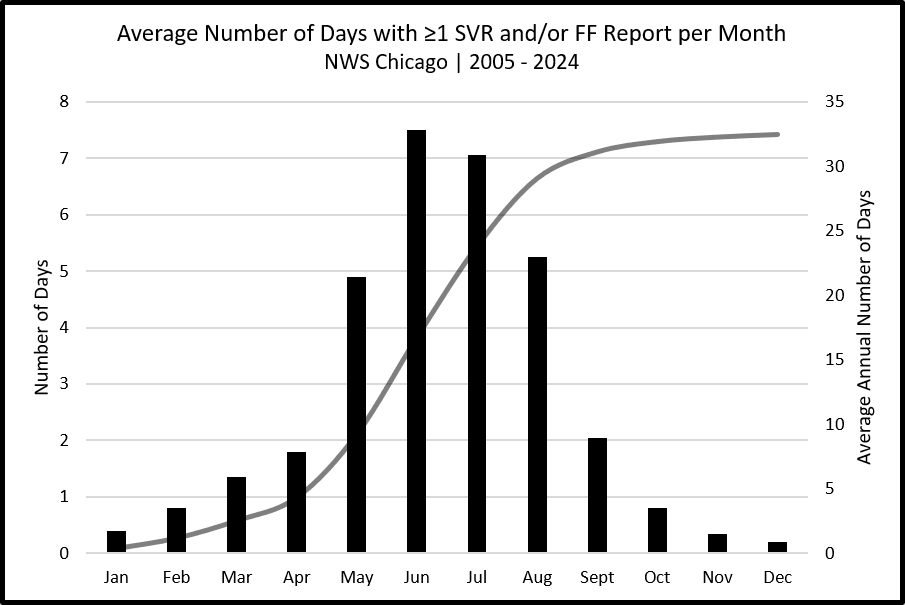
20-Year Averages in Days with Severe Weather Reports (Tornado, Hail, and/or Wind)
Plots use the database of reports from 2001 to 2020.
 |
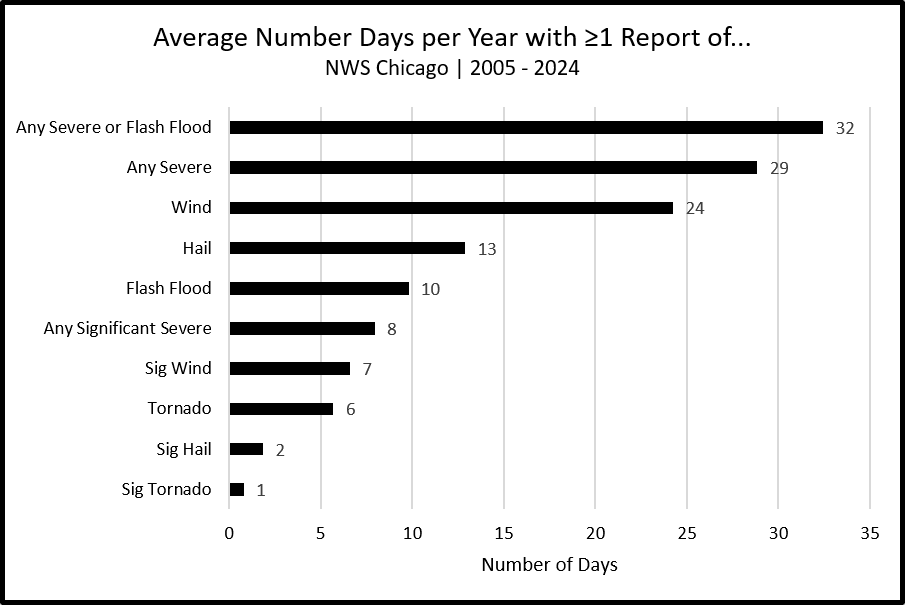 |
20-Year Average Hazards Breakdown
Plots use the database of reports from 2005 to 2024.
 |
 |
 |
 |
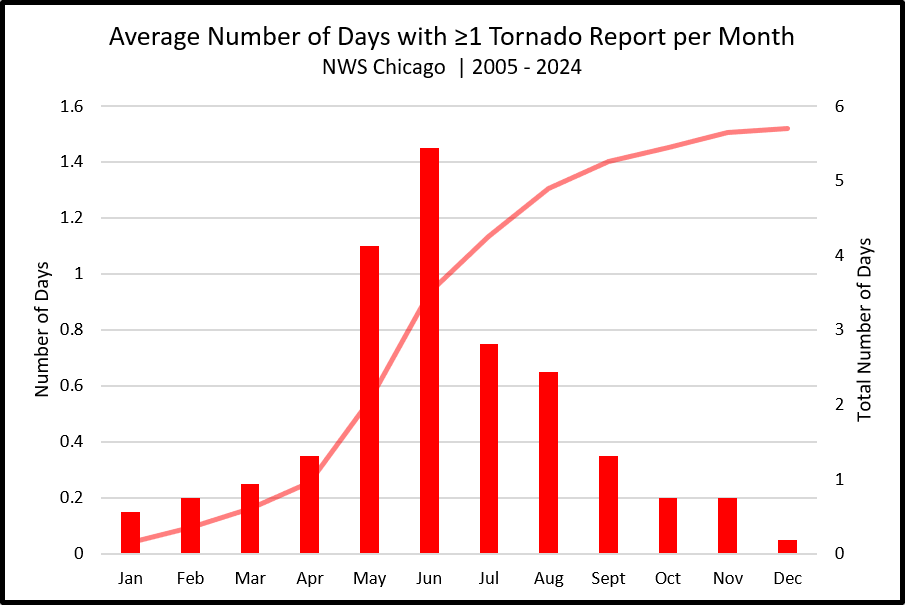
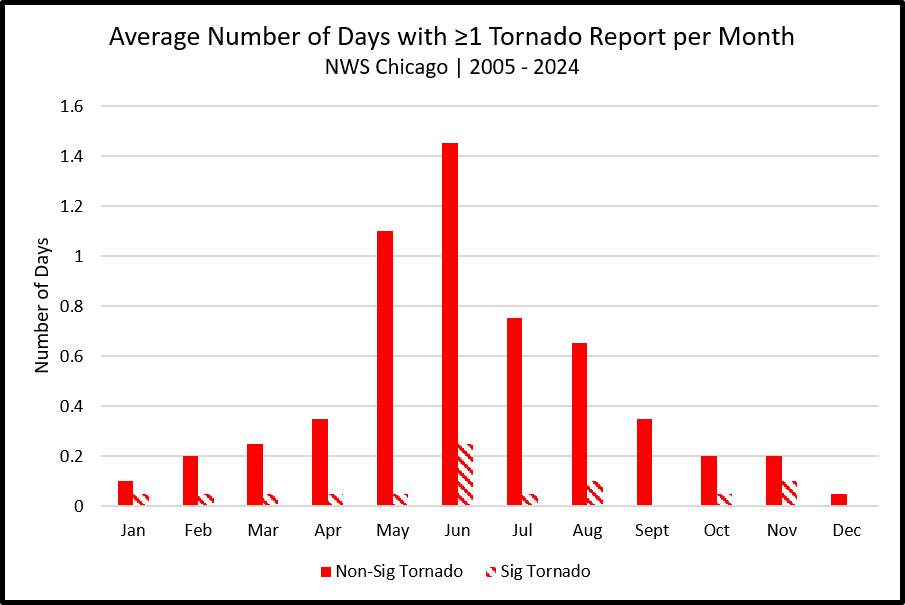
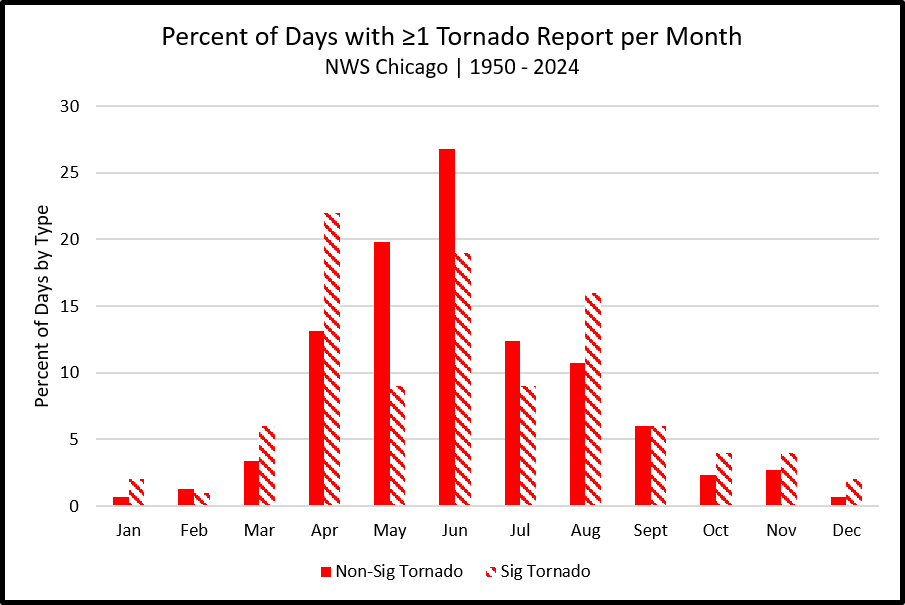
Tornadoes
(Any day with at least one report of a tornado)
Tornadoes are most frequent in May and June with an average of one day per month with at least one report.
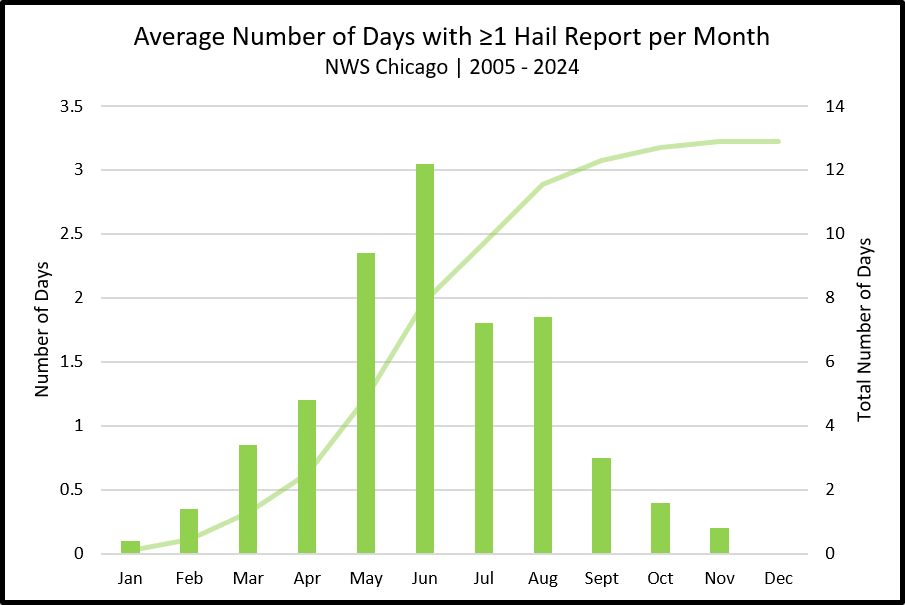
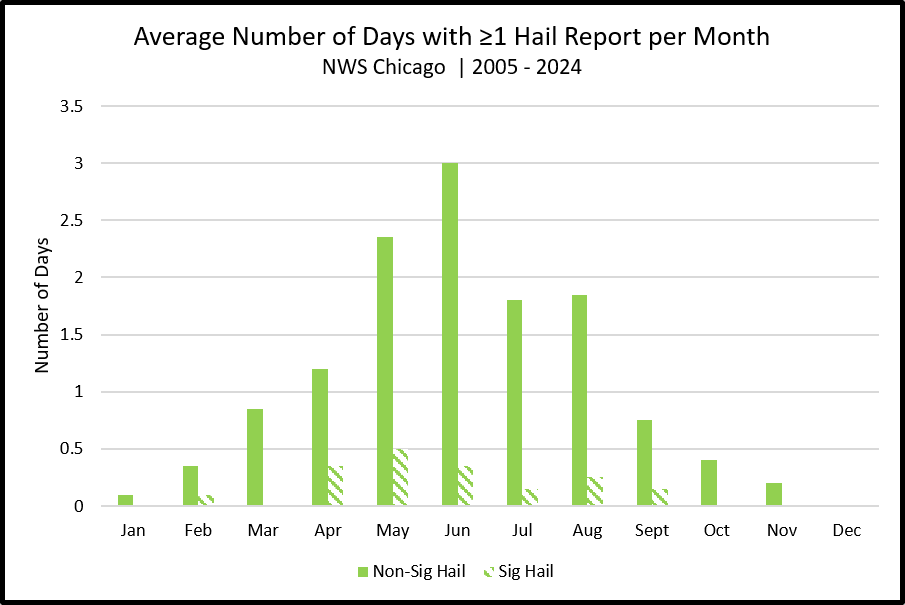
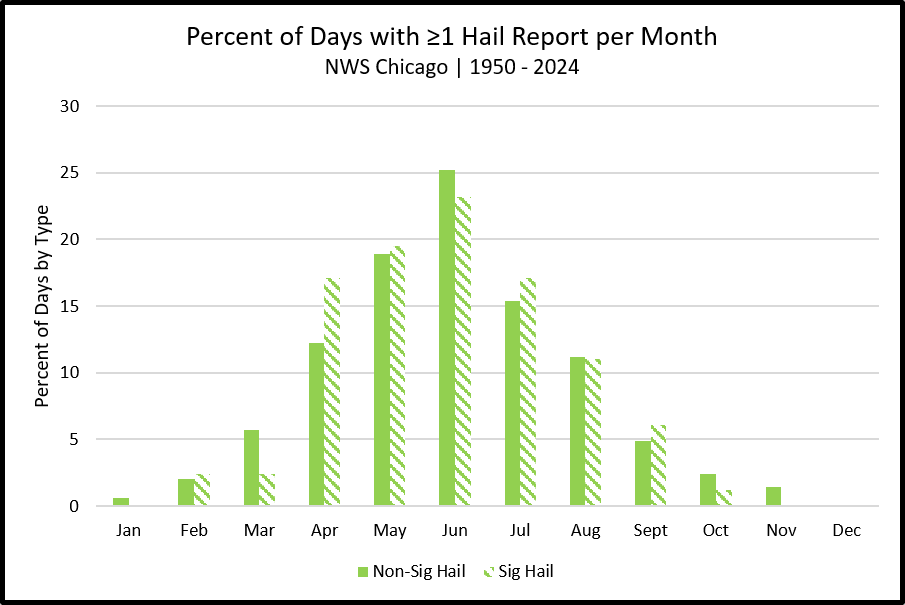
Damaging Hail
(Any day with at least one report of hail >1" in diameter)
Damaging hail is most frequent in May and June with an average of two to three days per month with at least one hail report.
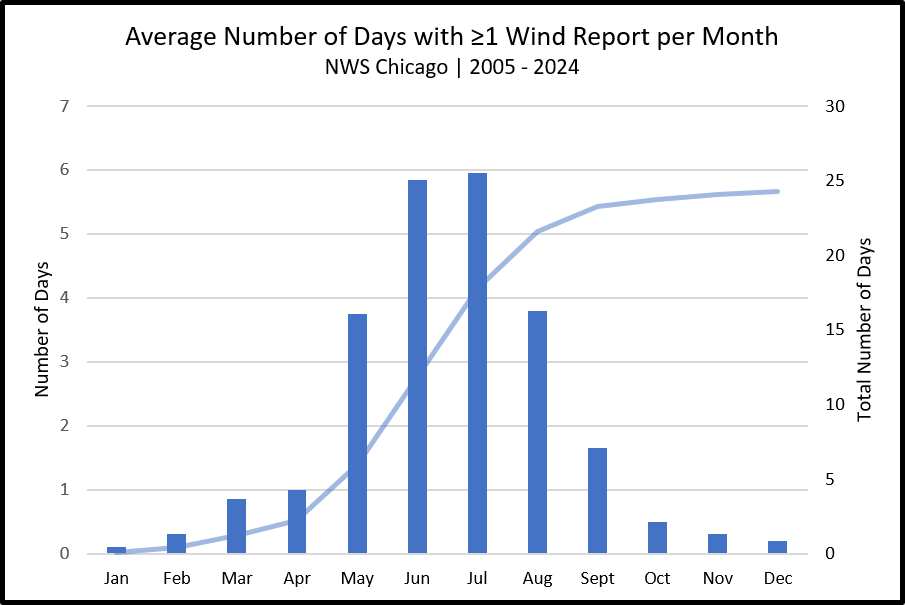
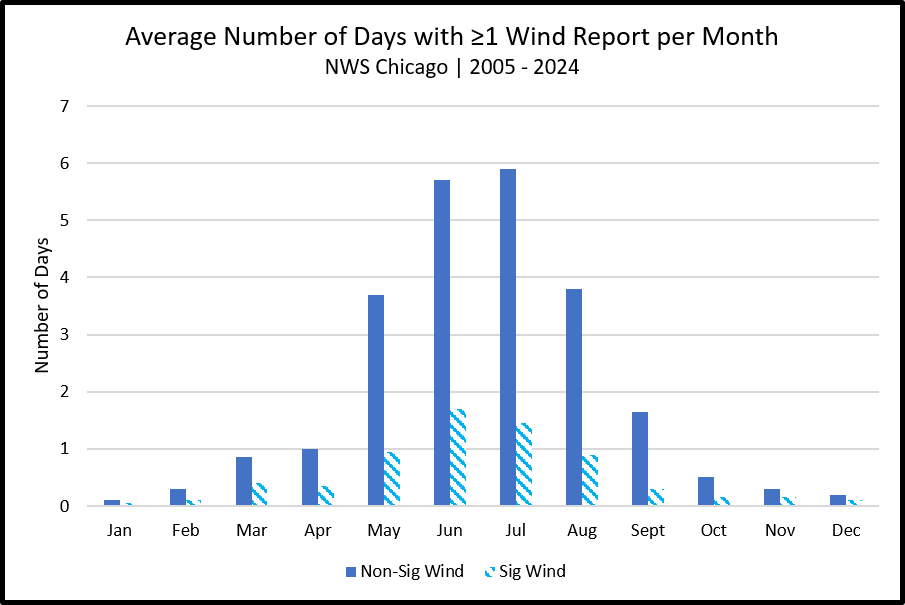
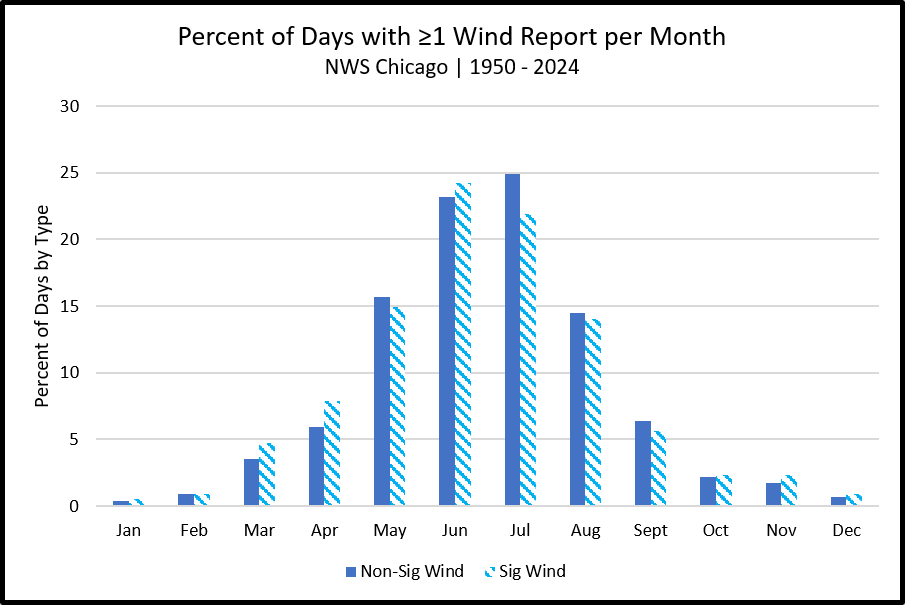
Damaging Winds
(Any day with at least one report of damaging winds >58 mph)
Damaging winds are most frequent in June and July with an average of five to six days per month with at least one damaging wind report.
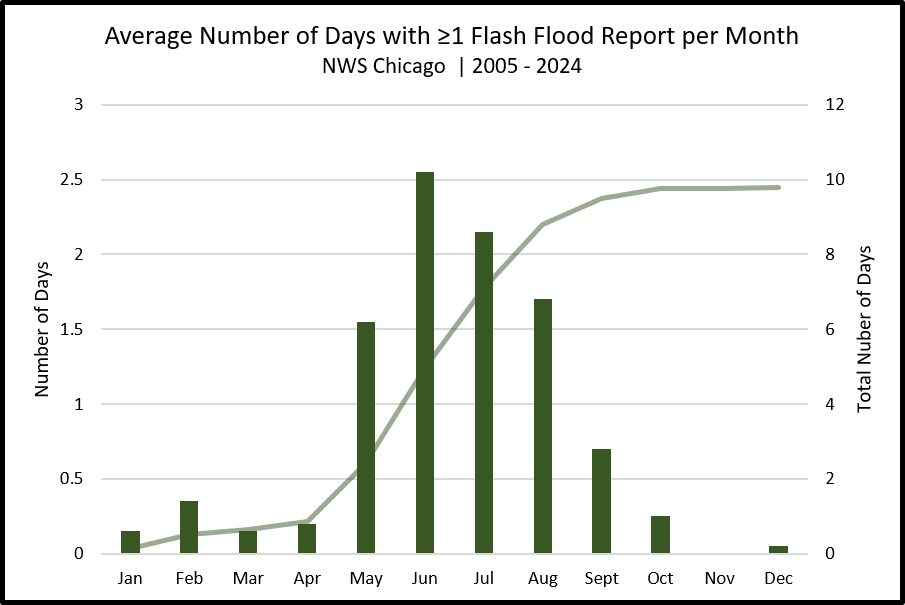
Flash Flooding
(Any day with at least one report of flash flooding)
Flash flooding is most common from May through August with at least one to two reports of flash flooding per month.
Generally speaking, hazards during the severe weather season transition from tornadoes, hail, damaging winds as the year progresses. However, all hazards can occur at any point throughout year.
Breakdown of Significant and Non-Significant Days
Plots use the database of reports from 2005 to 2024.
 |
 |
 |
 |
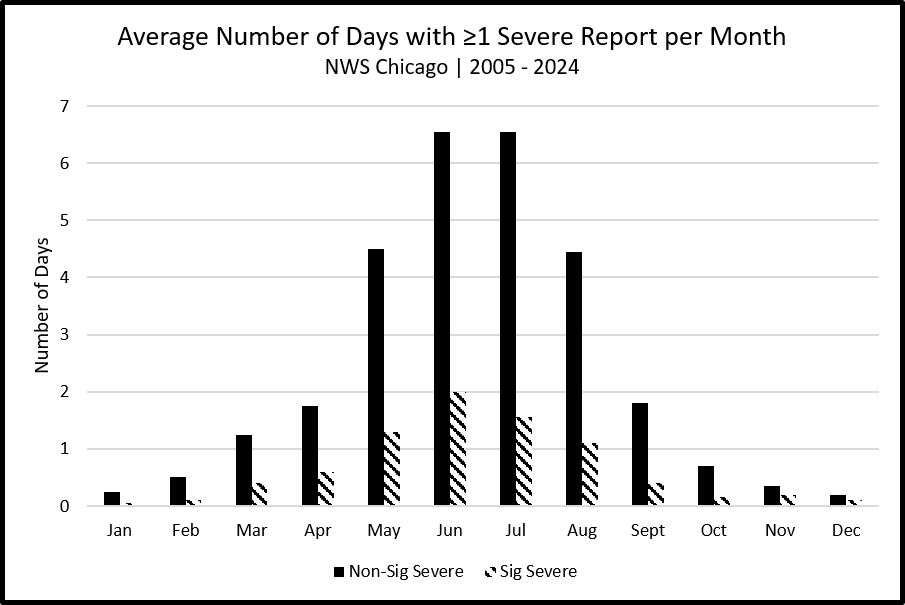
When treating days with significant or non-significant reports separately, June stands out as the month with the most frequent significant severe weather with around 2 days with at least one report every year. Altogether, significant severe weather is most frequent from May through August.
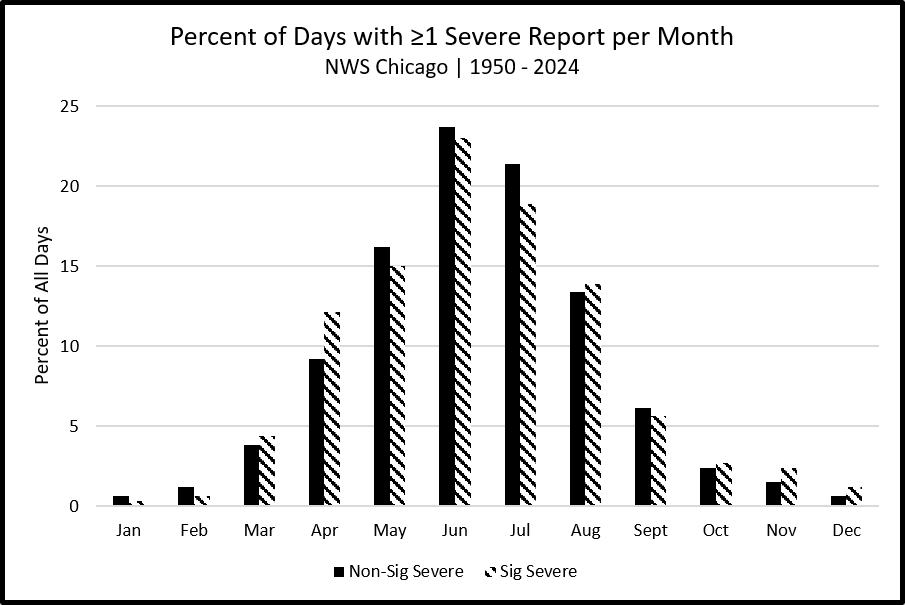
75-Year Severe Weather Days Breakdown
Plots use the database of reports from 1950 to 2024.
 |
 |
 |
 |
When looking at the entire 75-year database of days with at least one severe weather report, June sticks out as the month with the most frequent severe weather for most severe weather types (nearly 25% of all days for significant and non-significant severe weather!)
Time of Day
In this section, the climatology of severe weather by time of day (local time; no daylight savings time) in the NWS Chicago forecast area is displayed.
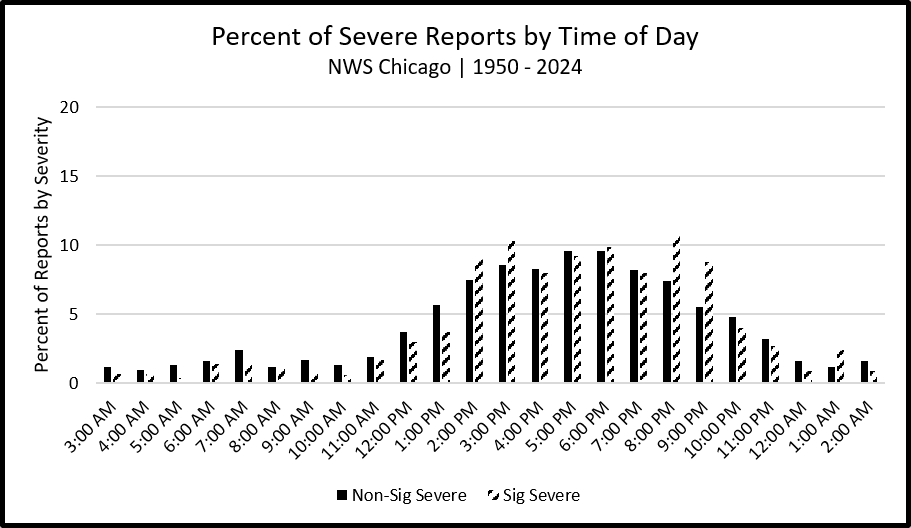
Any Severe Weather (e.g. Tornado, Damaging Winds, or Damaging Hail)
 |
|
In general, severe weather is most frequent between 1 and 9 PM local time, regardless of the intensity or magnitude of the severe weather. A secondary "spike" in reports occurs near sunrise, which appears to be driven by damaging winds (see below).
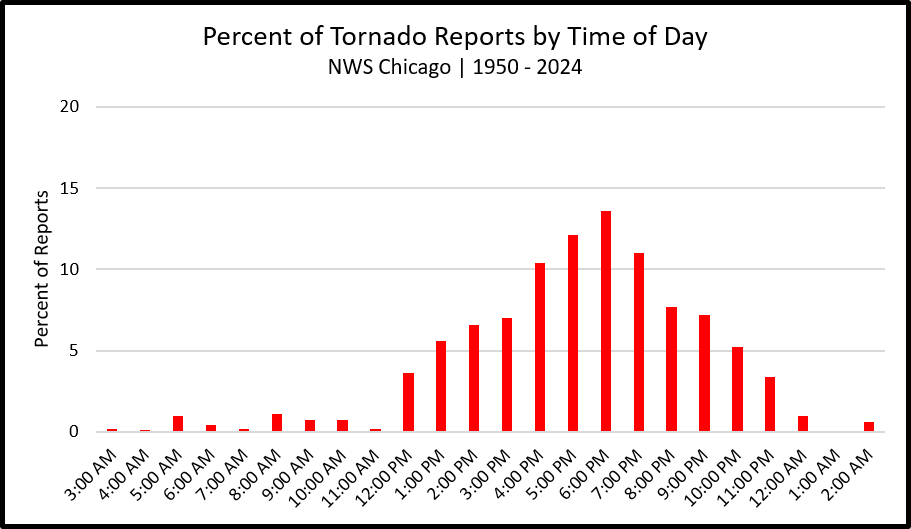
Tornadoes
 |
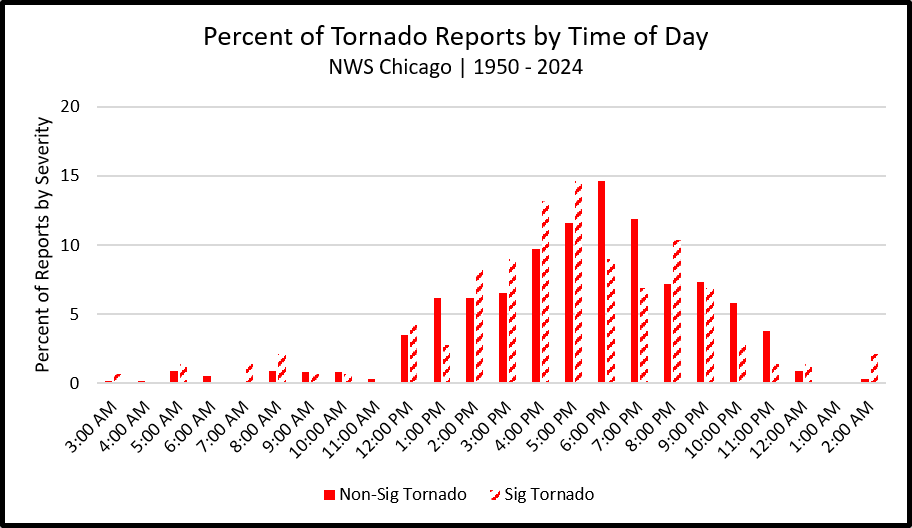 |
Tornadoes are most common between 12 and 11 PM local time, and especially between 4 and 8 PM, regardless of intensity.
Damaging Winds
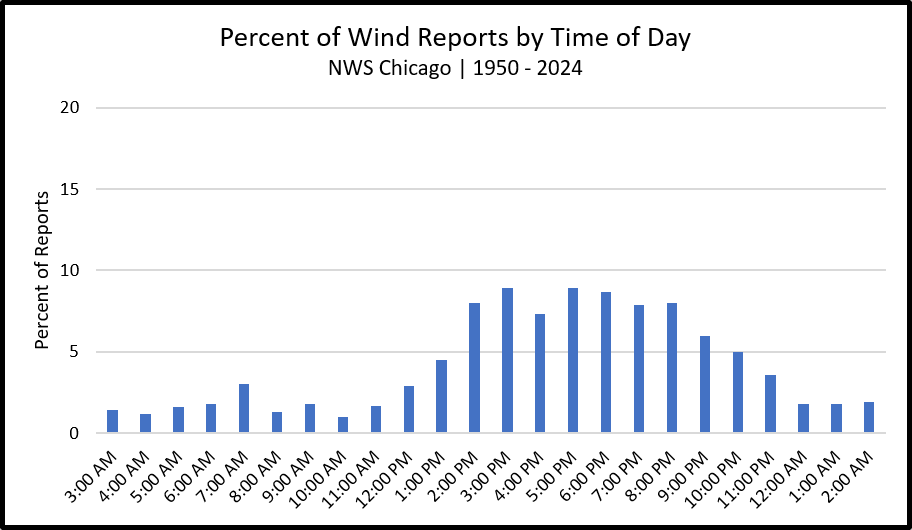 |
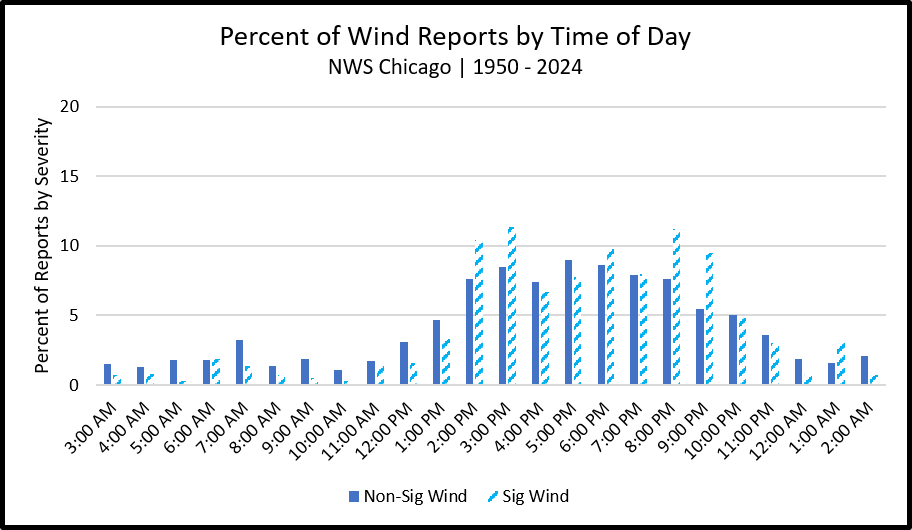 |
Damaging winds are most common between 1 and 9 PM local time, though the tail of the distribution extends outward into nighttime hours likely owing to a common summertime regime of nocturnal mesoscale convective systems.
Damaging Hail
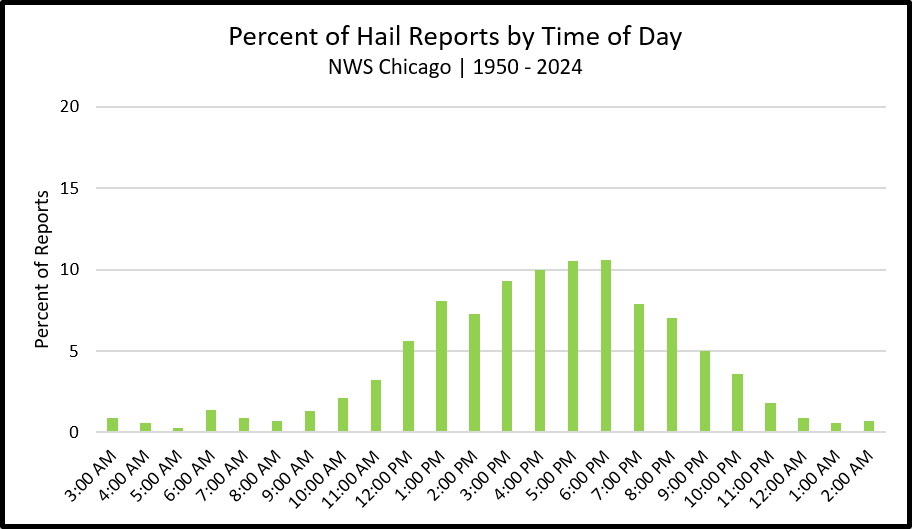 |
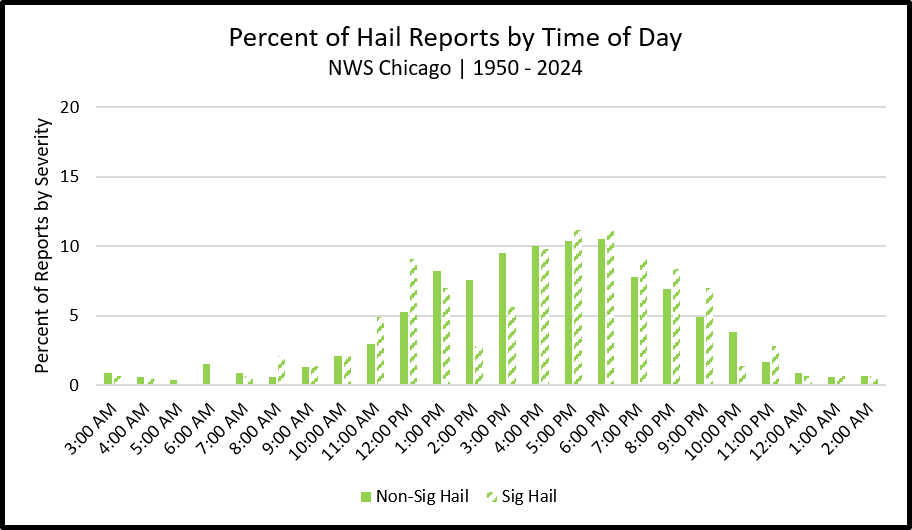 |
Damaging hail is most frequently reported during daylight hours. We suspect that a non-negligible amount of damaging hail at night often goes unreported as spotters are often sleeping.
Flash Flooding
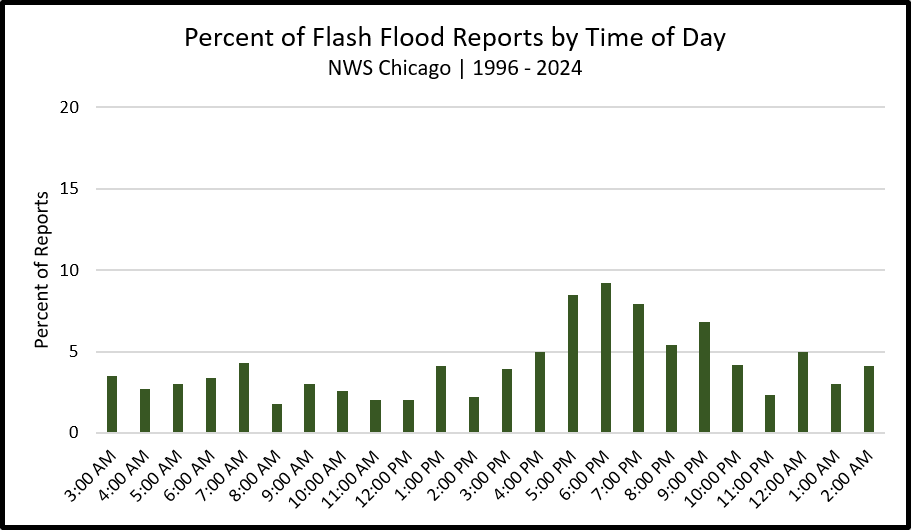 |
Finally, the distribution of Flash Flood reports is vast with only a modest peak during the evening hours. In other words, flash flooding is more or less equally likely at any time of day!
Trends in Severe Weather Reports
In this section, trends in the climatology of severe weather in the NWS Chicago forecast area is presented.
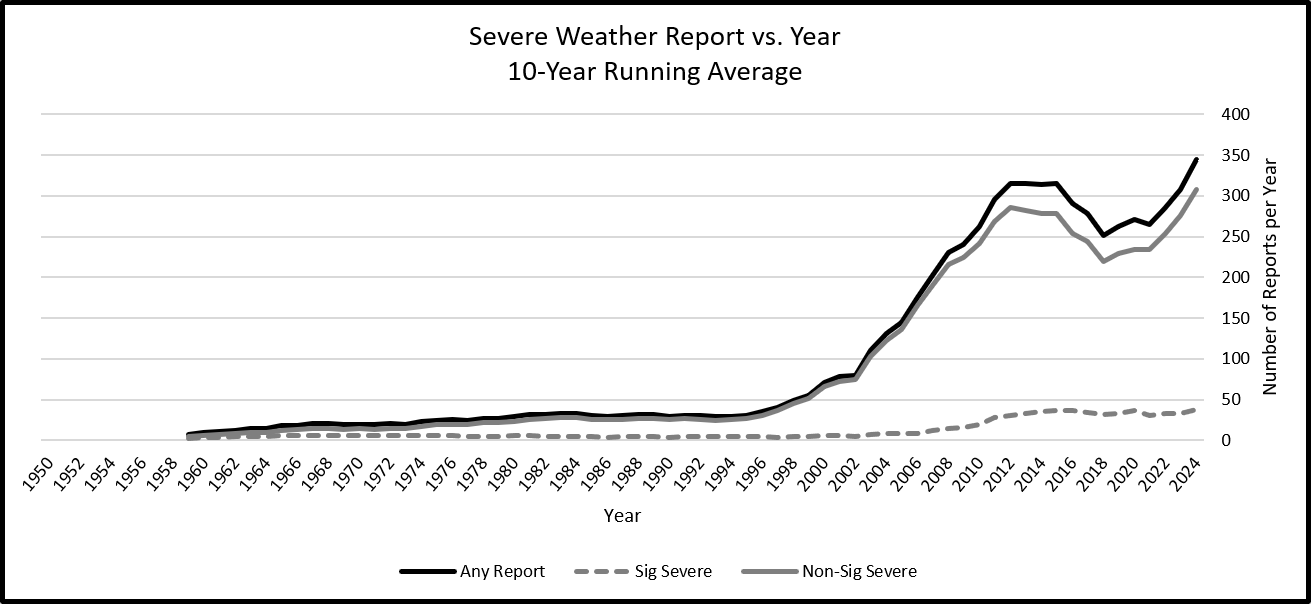
Any Severe Weather Type (Tornado, Damaging Wind, and/or Damaging Hail)
 |
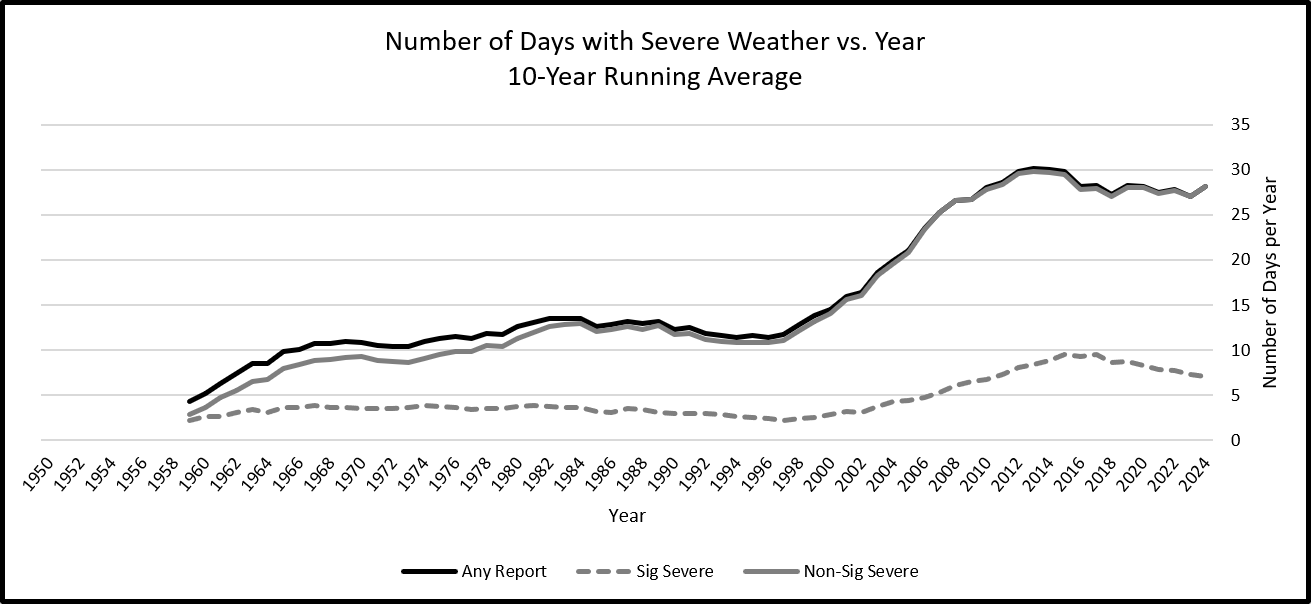 |
On average, our area sees severe weather 25 to 30 days out of the year. In addition, our area experiences about 10 days per year with Significant Severe Weather (EF-2+ tornadoes, hail greater or equal to 2" in diameter, and/or winds greater than or equal to 74 mph).
In the early 2000s, both the number of reports and number of days with at least 1 report increased dramatically. What lead to this increase? We believe there are three main factors:
The rise of the internet, social media, and mobile phone usage, leading to more ways to report severe weather to the NWS.
A gradual increase in population in the Rockford and Chicago areas translating to more people to report severe weather.
An increase in storm spotter training and other education by the NWS.
While the number of reports appears to be increasing once again as we continue through the 2020s, the number of days with at least one report of severe weather is more or less stagnant. It appears we are now capturing the true climatology of severe weather in our area.
Trends in Tornado Days
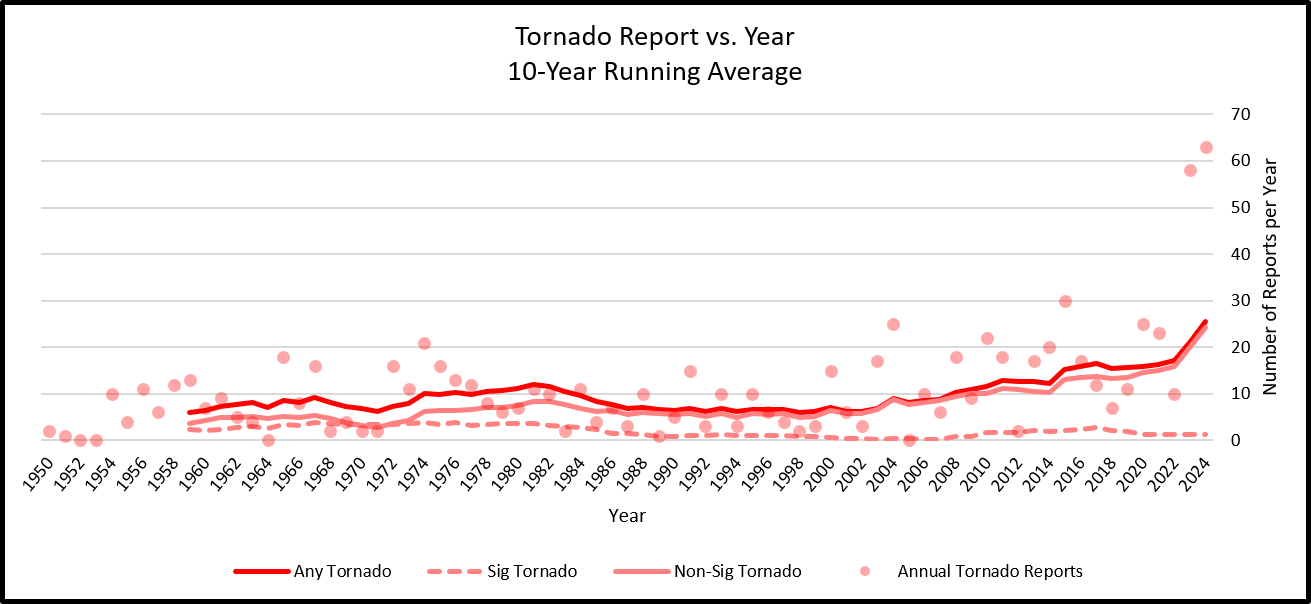 |
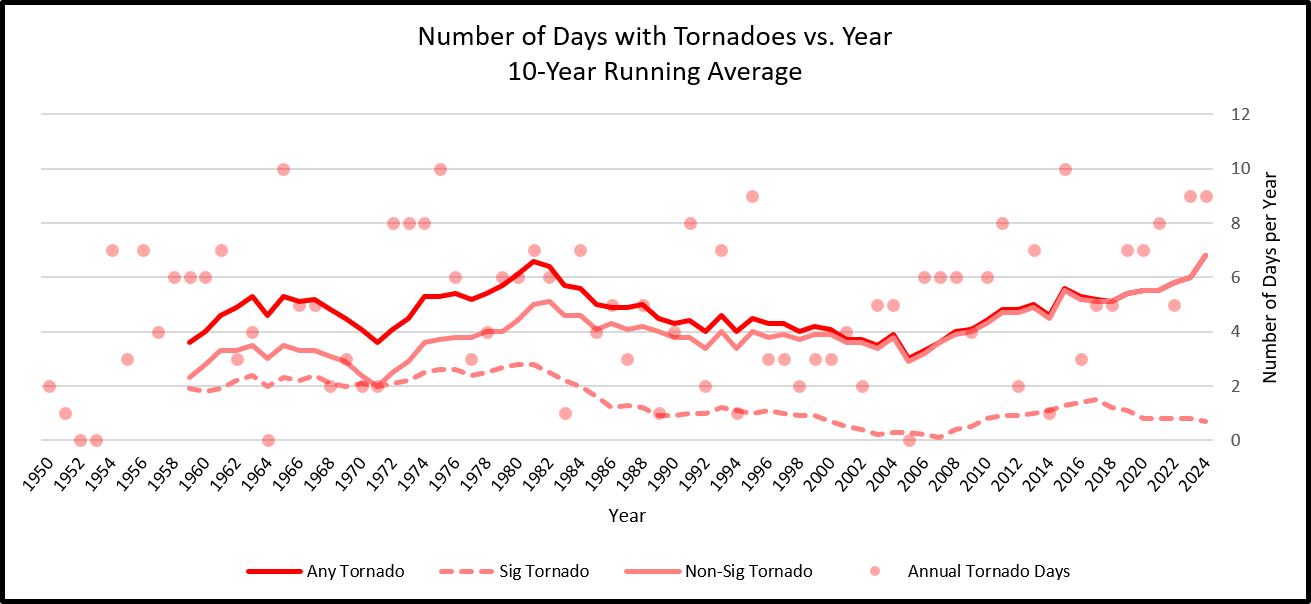 |
While the number of tornadoes per year have increased in the past few decades, the number of days per year with at least one tornado has remained relatively constant (around 4 to 6 days per year).
Interestingly, the number of days with a Significant Tornado, or tornado with a damage rating of F/EF2 or greater on the Enhanced Fujita Scale, have decreased from the 1970s and 1980s to 2010s from about two days per year to around one. We believe improvements in building codes and construction practices may help explain the apparent downward trend in Significant Tornadoes especially considering the frequency of days with Non-Significant Tornadoes or Any Tornado have remained constant (if not slightly increased).
In the entire severe weather database (1950-2024), the number of days with at least one tornado have ranged from zero (1952, 1953, 1964, 2005) to ten (1965, 1975, 2015).
Trends in Damaging Wind Days
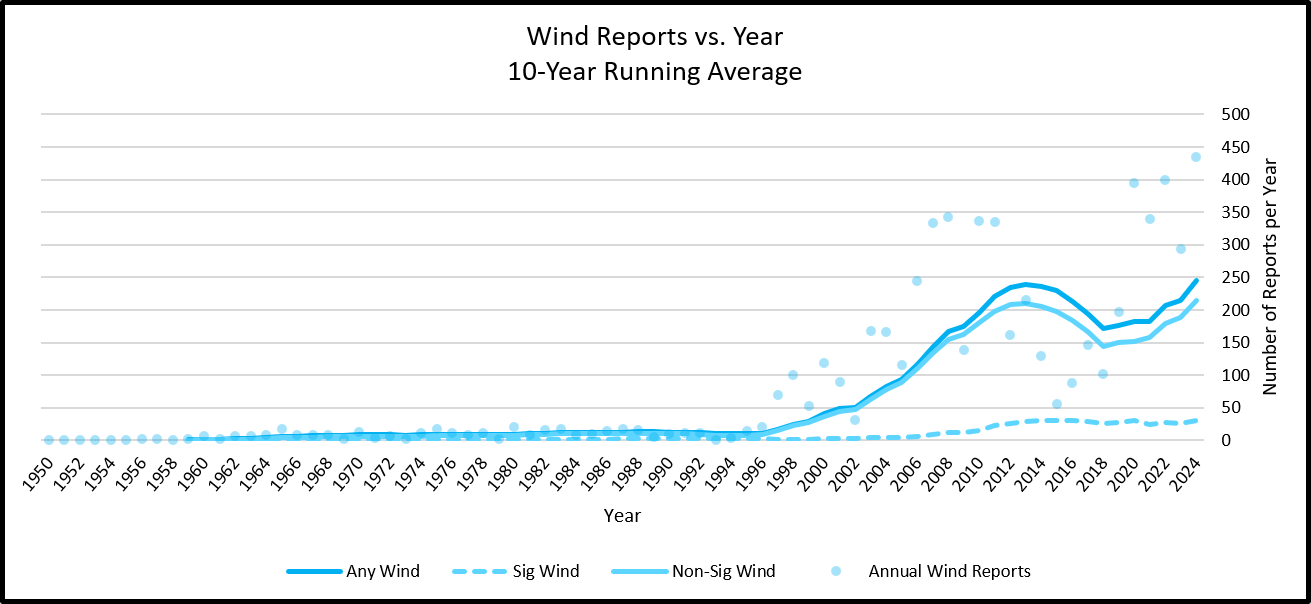 |
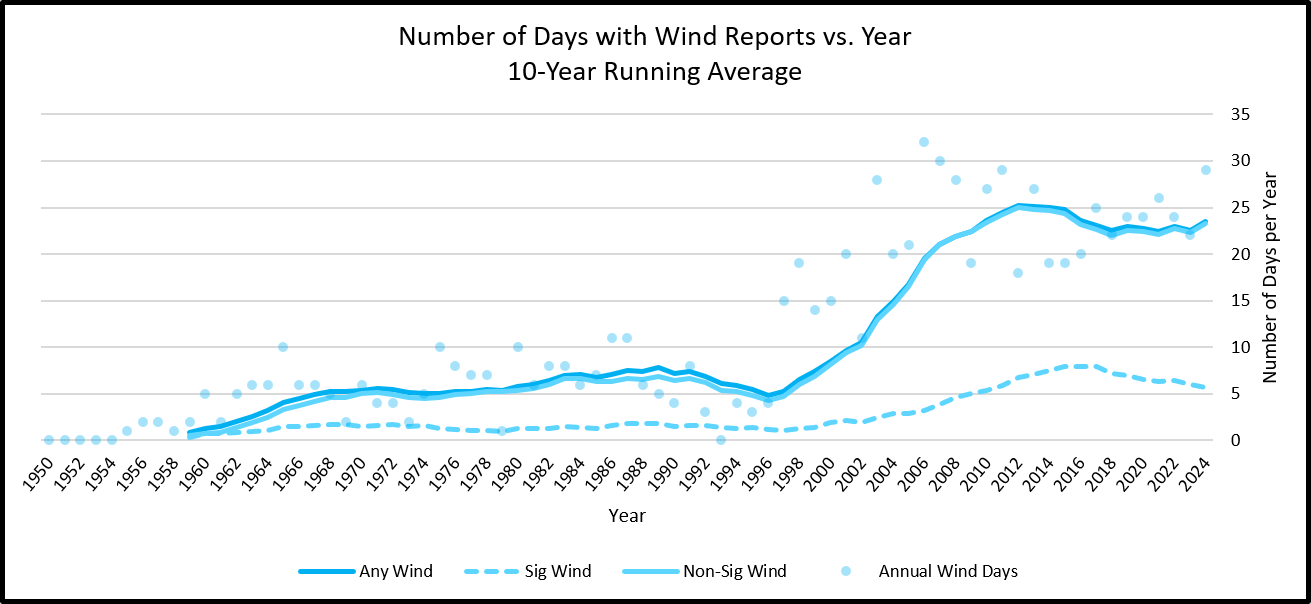 |
Our local area typically experiences 20 to 25 days with at least one report of damaging winds, and about 5 to 6 days per year with at least one report of Significant Damaging Winds with wind speeds of 75 mph or greater.
The number of reports of damaging winds appears to be increasing, though the number of days with damaging winds remains more or less the same.
Trends in Hail Days
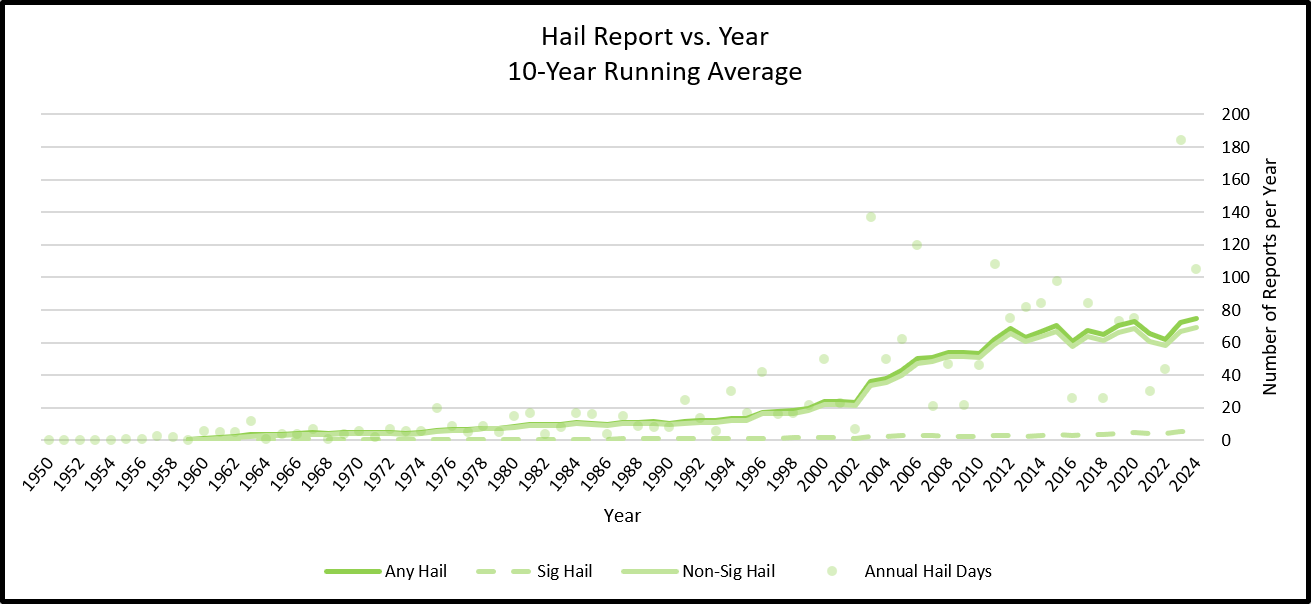 |
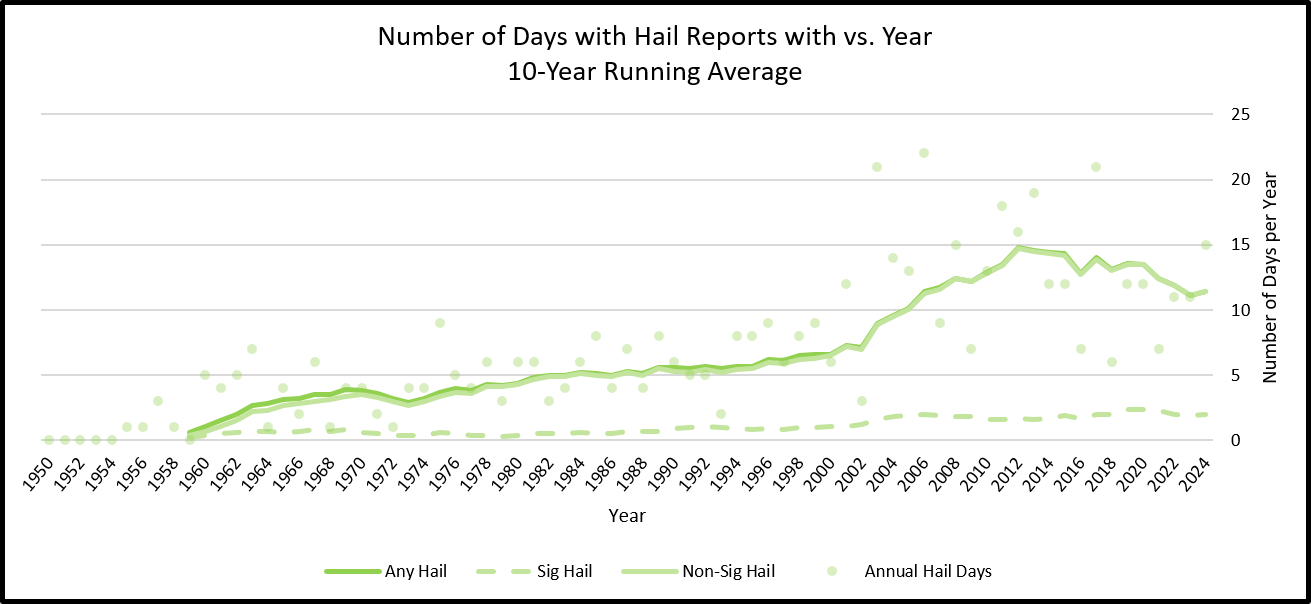 |
Our local area typically experiences 10 to 15 days per year with at least one report of damaging hail, and about two to three days per year with at least one report of Significant Hail with a diameter of 2" or larger. We suspect the number of days with damaging hail may be higher than shown since hail that falls in rural areas or at nighttime is often underreported.
Severe Weather Rankings and Hazard Breakdown
Have you ever wondered in which year our local area experienced the most severe weather? Or, the largest tornado event in our area? Check out the links below to be brought to individual webpages.
Old Page:
Tornado and Severe Weather Climatology page
 |
Media use of NWS Web News Stories is encouraged! Please acknowledge the NWS as the source of any news information accessed from this site. Additional recaps can be found on the NWS Chicago Past Events Page |
|

